. 2023 Jun 2;25(6):1031-1043.
doi: 10.1093/neuonc/noac233.

TRIM67 drives tumorigenesis in oligodendrogliomas through Rho GTPase-dependent membrane blebbing

Affiliations

TRIM67 drives tumorigenesis in oligodendrogliomas through Rho GTPase-dependent membrane blebbing

Engin Demirdizen et al. Neuro Oncol. .

Abstract

Background: IDH mutant gliomas are grouped into astrocytomas or oligodendrogliomas depending on the codeletion of chromosome arms 1p and 19q. Although the genomic alterations of IDH mutant gliomas have been well described, transcriptional changes unique to either tumor type have not been fully understood. Here, we identify Tripartite Motif Containing 67 (TRIM67), an E3 ubiquitin ligase with essential roles during neuronal development, as an oncogene distinctly upregulated in oligodendrogliomas.

Methods: We used several cell lines, including patient-derived oligodendroglioma tumorspheres, to knock down or overexpress TRIM67. We coupled high-throughput assays, including RNA sequencing, total lysate-mass spectrometry (MS), and coimmunoprecipitation (co-IP)-MS with functional assays including immunofluorescence (IF) staining, co-IP, and western blotting (WB) to assess the in vitro phenotype associated with TRIM67. Patient-derived oligodendroglioma tumorspheres were orthotopically implanted in mice to determine the effect of TRIM67 on tumor growth and survival.

Results: TRIM67 overexpression alters the abundance of cytoskeletal proteins and induces membrane bleb formation. TRIM67-associated blebbing was reverted with the nonmuscle class II myosin inhibitor blebbistatin and selective ROCK inhibitor fasudil. NOGO-A/Rho GTPase/ROCK2 signaling is altered upon TRIM67 ectopic expression, pointing to the underlying mechanism for TRIM67-induced blebbing. Phenotypically, TRIM67 expression resulted in higher cell motility and reduced cell adherence. In orthotopic implantation models of patient-derived oligodendrogliomas, TRIM67 accelerated tumor growth, reduced overall survival, and led to increased vimentin expression at the tumor margin.

Conclusions: Taken together, our results demonstrate that upregulated TRIM67 induces blebbing-based rounded cell morphology through Rho GTPase/ROCK-mediated signaling thereby contributing to glioma pathogenesis.

Keywords: E3 ligase; Rho GTPase signaling; TRIM67; glioma; membrane blebbing; mouse.


Conflict of interest statement

The authors declare no conflicts of interest.

Figures
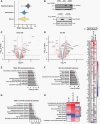
Figure 1.
Figure 1.
TRIM67 overexpression influences cytoskeletal proteins and pathways. (A) Bar plot shows log2 expression of TRIM67 in oligodendrogliomas, astrocytomas, and IDH wild-type (wt) gliomas. The Cancer Genome Atlas LGG RNA-seq data were downloaded from GlioVis. Histopathological classification is based on the 2007 WHO classification of CNS tumors. (B) Immunoblotting for Flag in EV (−) or TRIM67OE (+) hNPC, S24, TS603 cells (upper panel) and TS600 and TS543 cells (lower panel). Actin serves as the loading control. (C, D) Volcano plots highlighting differentially abundant proteins shown in red (−log10[P value] >1,4, absolute[log2 fold change] > 1) identified by mass spectrometry (MS) in TRIM67OE TS603 (C) or S24 cells (D) compared to EV control cells. Proteins of interest are shown in the plot. (E-G) Top 10 significantly enriched cytoskeletal pathways among the differentially abundant proteins (-log10[P value] >1,4) in TRIM67OE TS603 (E), TRIM67OE S24 (F), and Co-IP MS experiment in TRIM67OE TS603 cells (G). (H) Heatmap comparison of pathways enriched among the differentially abundant proteins in TRIM67OE cells (S24_MS and TS603_MS) and the putative TRIM67 interacting partners in TS603 cells (TS603_Co-IP_MS). (I) Heatmap showing the differentially abundant signaling proteins within the Rho family GTPases for S24_MS, TS603_Co-IP_MS, and TS603_MS.
Figure 2.
Figure 2.
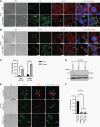
TRIM67 overexpression induces membrane blebbing and rounded cell morphology. (A) Representative IF images of EV or TRIM67OE HEK293TN cells. DIC indicates bright-field images, Flag in green, F-Actin in red, and DAPI in blue. The zoomed regions of interest (ROI) are shown by white rectangles. Membrane blebs are indicated by white arrows. Scale bar, 10 μm. (B) Representative IF images of EV or TRIM67OE TS603 cells. DIC indicates bright-field images, TRIM9 in green, F-Actin in red, and DAPI in blue. The zoomed ROI are shown by white rectangles. Membrane blebs are marked by white arrows. Scale bar, 25 μm. (C) Quantification of (A) and (B). * P < .05, *** P < .001. (D) Immunoblotting for TRIM67 and GAPDH in SU-A03 cells transduced with scrambled shRNA, or TRIM67 shRNA (sh1 or sh4). E) Representative IF images of SU-A03 cells transduced with scrambled shRNA, TRIM67 shRNA (sh.1 or sh.4). DIC indicates bright-field images, TRIM9 in green, F-Actin in red, and DAPI in blue. Membrane blebs are indicated by white arrows. Scale bar, 8 μm. (F) Quantification of (E). *** P < .001.
Figure 3.
Figure 3.
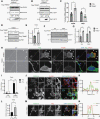
TRIM67 induces membrane blebbing through NOGO-A/Rho GTPase/ROCK signaling. (A, B) Immunoblotting for RHOA (A) or RAC1 (B) after GTP pulldown in EV or TRIM67OE TS603 cells. GDP is used as a negative control and GTPγS as a positive control for GTP pulldown. (C) The normalized quantification for active RHOA and RAC1. Error bars indicate the standard error of the mean. Two-tailed t-test was performed, * P < .05. (D) Immunoblotting for Flag-TRIM67, ROCK2, and GAPDH in control and TRIM67OE TS603 cells. GAPDH serves as a loading control. (E) Normalized quantification for ROCK2. (F) Immunoblotting for NOGO-A in EV and TRIM67OE S24 and TS603 cells. GAPDH serves as the loading control. (G) Normalized quantification for NOGO-A is shown. (H) Representative IF images with and without fasudil treatment in TRIM67OE TS603 cells. DIC indicates bright-field images, Flag in green, F-Actin in red, and DAPI in blue. The zoomed ROI are shown by white rectangles. Membrane blebs are marked by white arrows. Scale bar, 10 μm. (I) Bar plot indicates the percentage of cells with membrane blebbing with (+) or without (−) fasudil (Fas) treatment. (J) Representative IF images of control and TRIM67OE TS603s. NOGO-A in green, F-Actin in red, and DAPI in blue. The zoomed ROI are shown by white rectangles. Scale bar, 8 μm. (K) Colocalization of NOGO-A and F-actin in the regions indicated by the white lines in (J) (3rd panel in the last column). (L) Bar plot showing the average intensity of NOGO-A in EV or TRIM67OE TS603s. (M) Representative IF images of TRIM67OE TS603 cells. NOGO-A in green, Flag in red, and DAPI in blue. The zoomed ROI are shown by white rectangles. Scale bar, 8 μm. (N) Colocalization of NOGO-A and Flag. A representative region for quantification is indicated by the white line in (M) (1st panel in the last column).
Figure 4.
Figure 4.
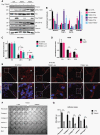
TRIM67 expression induces cell migration. (A) Immunoblotting for Tensin-2, pFAK, FAK, Flag-TRIM67, pAkt, Akt in EV (−) and TRIM67OE (+) S24, TS603, and TS600 cells. GAPDH was used as the loading control. (B) The normalized quantification of (A). pFAK and pAkt were also normalized to total FAK and Akt, respectively. Error bars indicate the standard error of the mean. Two-tailed t-test was performed, * P < .05, ** P < .01 and *** P < .001. (C, D) The quantification of Supplementary Figure 10B for normalized wound area in SK.N.BE2 cells transduced with scrambled shRNA or TRIM67 shRNA (sh4 and sh5) (C) and control or TRIM67OE TS600 cells (D). Error bars indicate the standard error of the mean. Two-tailed t-test was performed, * P < .05 and ** p < .01. (E) Representative IF images of wound healing in SK.N.BE2 cells transduced with scrambled shRNA or TRIM67 shRNA (sh4 and sh5). F-Actin in red and DAPI in blue. Bleb-based migrating cells are marked by white arrows. Scale bar, 10 μm. (F) Cell adhesion assay showing control and TRIM67OE TS603 cells on 5 different coating matrices. BSA (bovine serum albumin) serves as the negative control. (G) Quantification of (F). Error bars indicate the standard error of the mean. Two-tailed t-test was performed, *** P < .001.
Figure 5.
Figure 5.
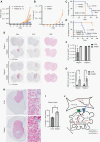
TRIM67 acts as an oncogene in oligodendroglioma implantation models. (A) Serial BLI imaging after implantation of control or TRIM67OE TS603s (5000 cells injected) was shown for individual mice. (B) Average signal for BLI in (A). Two-tailed t-test was performed, * P < .05, ** P < .01. (C) Kaplan-Meier survival curve of EV and TRIM67OE TS603s (5000 cells injected). Log-rank test was performed, P = .0012. (D) Kaplan-Meier survival curve of SU-AO3 transduced with scrambled or TRIM67 shRNAs (sh1, sh4). Log-rank test was performed, P < .0001. E) IHC images for Flag, Ki-67, and H&E using brain sections at 2 different regions from representative mice implanted with control or TRIM67OE TS603s (50 000 cells injected). (F, G) Quantification of Ki-67 (F) and H&E (G). (H) Representative images of vimentin IHC in 5 μm thick coronal sections of mouse brains implanted with control or TRIM67OE TS603s (50 000 cells injected) (left); scale bar, 1 cm. Zoomed-in regions around the tumor edge showing vimentin IHC (red); scale bar, 875 μm. (I) ROI (3 areas per section) quantification of vimentin within the tumor edge. Representative offset (blue window) is shown in H (right panel) (control = 16 sections, TRIM67 = 36 sections, two-tailed t-test was performed) *** P < .001. Error bars indicate the standard error of the mean. (J) Model illustrating the TRIM67-induced membrane blebbing in gliomas. Upregulated TRIM67 induces NOGO-A, which activates RHOA/ROCK2 signaling but inhibits RAC1 signaling. TRIM67 expression leads to actomyosin contractility and membrane blebbing, in turn reducing cell adhesion, increasing cell migration, vimentin expression at the tumor margin, and tumor growth.

Comment in

References

    1. Brat DJ, Verhaak RG, Aldape KD, et al. Comprehensive, integrative genomic analysis of diffuse lower-grade gliomas. N Engl J Med. 2015; 372(26):2481–2498. - PMC - PubMed
    1. Yan H, Parsons DW, Jin G, et al. IDH1 and IDH2 mutations in gliomas. N Engl J Med. 2009;360(8):765–773. - PMC - PubMed
    1. Hatakeyama S. TRIM family proteins: roles in autophagy, immunity, and carcinogenesis. Trends Biochem Sci. 2017;42(4):297–311. - PubMed
    1. Boyer NP, Monkiewicz C, Menon S, Moy SS, Gupton SL. Mammalian TRIM67 functions in brain development and behavior. eNeuro. 2018;5(3):ENEURO.0186–ENEU18.2018. - PMC - PubMed
    1. Montell DJ. TRIMing neural connections with ubiquitin. Dev Cell. 2019;48(1):5–6. - PMC - PubMed

Publication types