. 2022 Oct 10;20(10):e3001543.
doi: 10.1371/journal.pbio.3001543. eCollection 2022 Oct.

A genome-wide screen identifies SCAI as a modulator of the UV-induced replicative stress response

Affiliations

A genome-wide screen identifies SCAI as a modulator of the UV-induced replicative stress response

Jean-François Lemay et al. PLoS Biol. .

Abstract

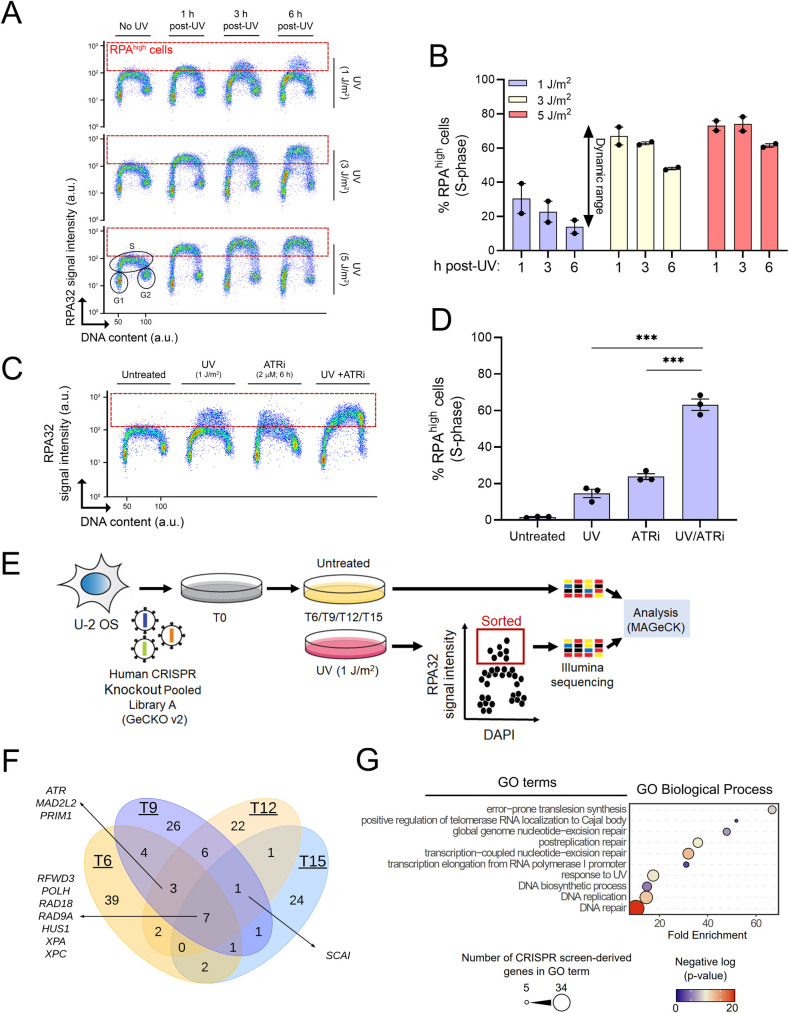
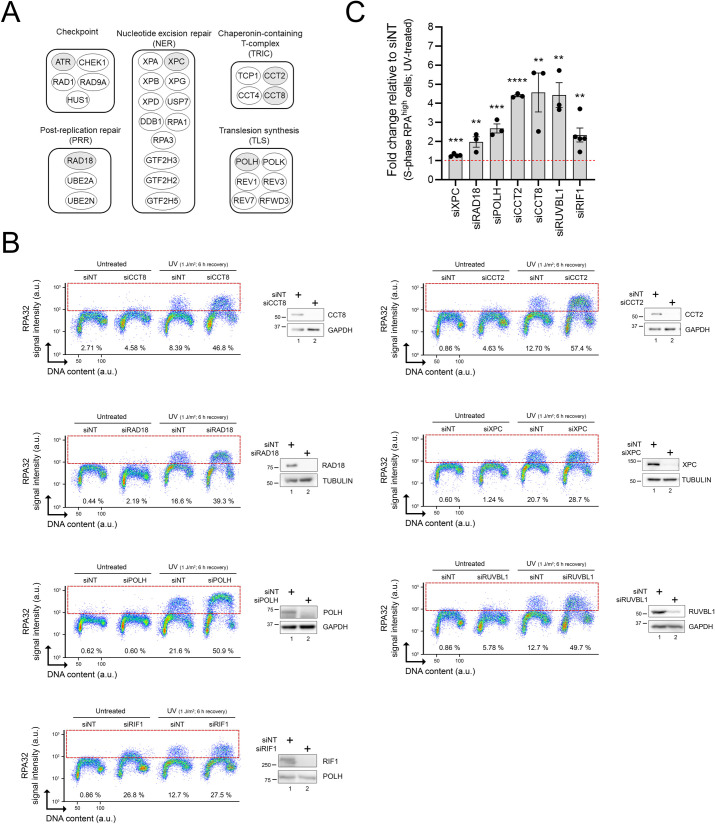
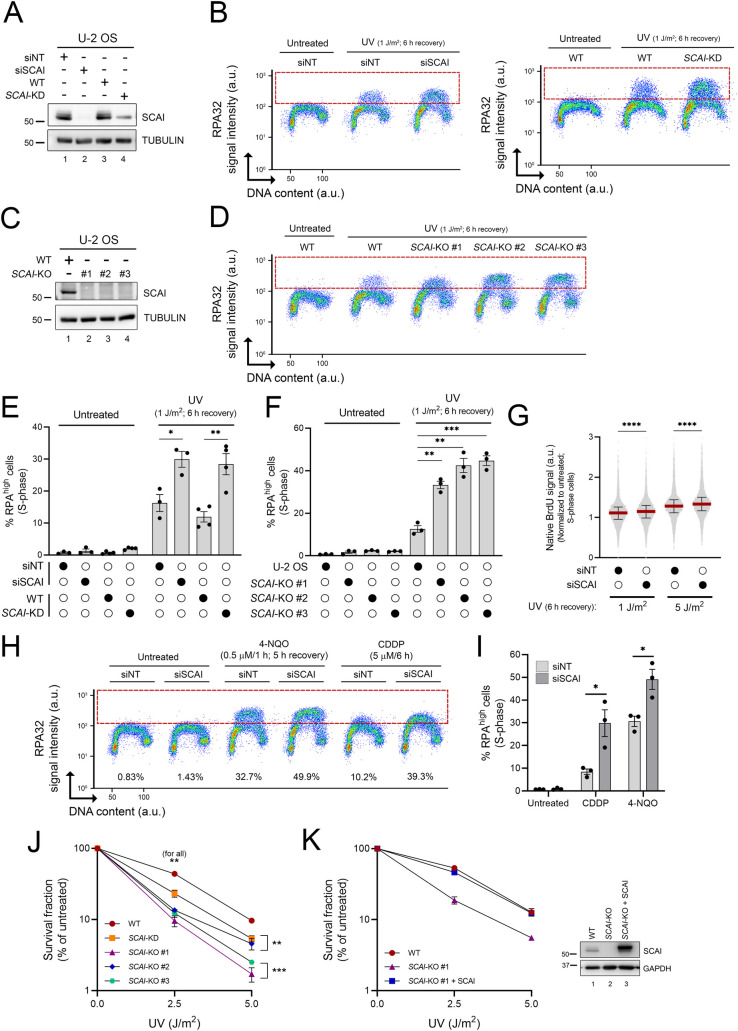
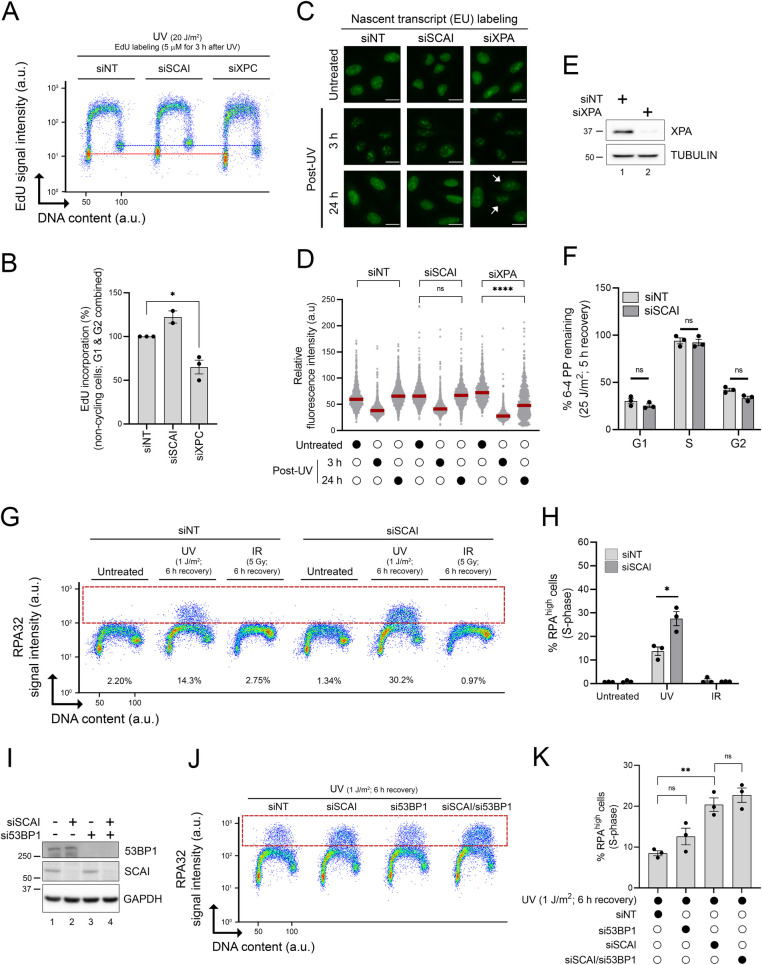
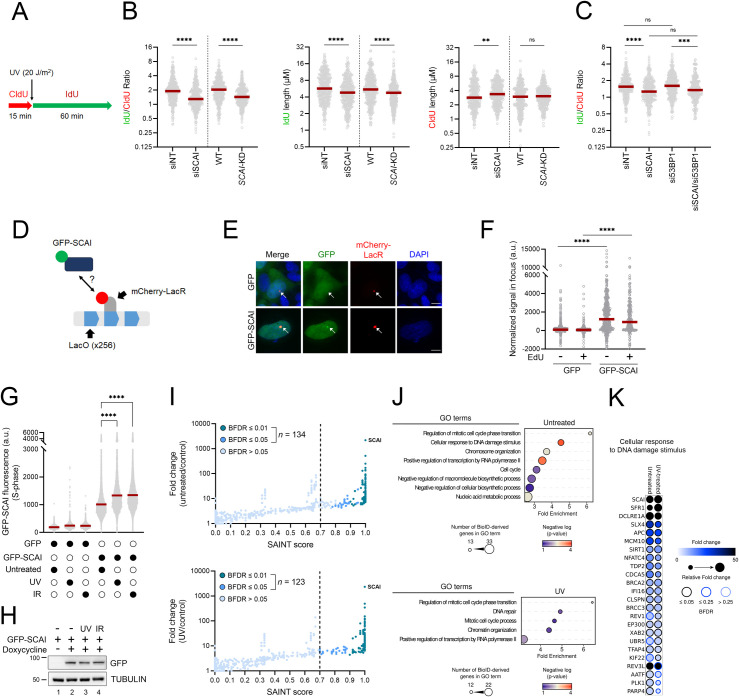
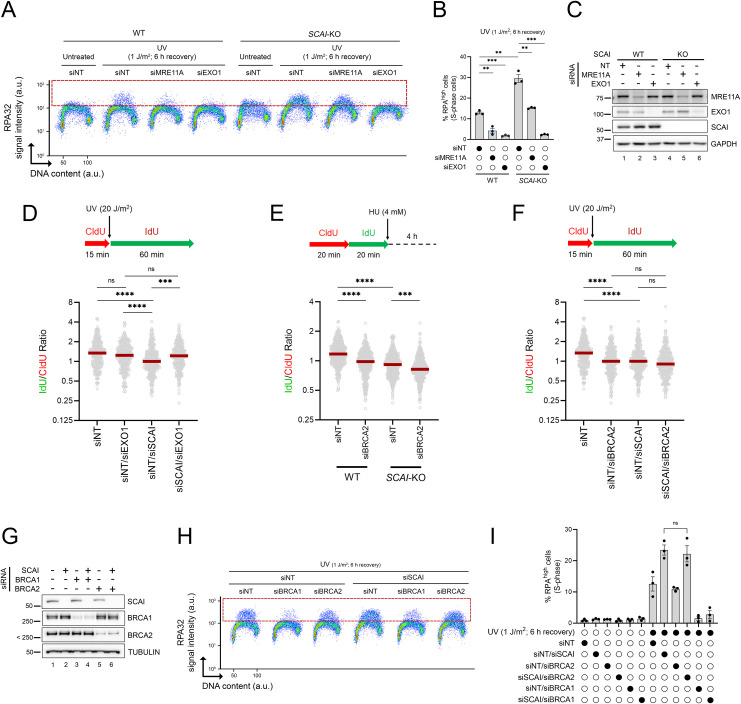
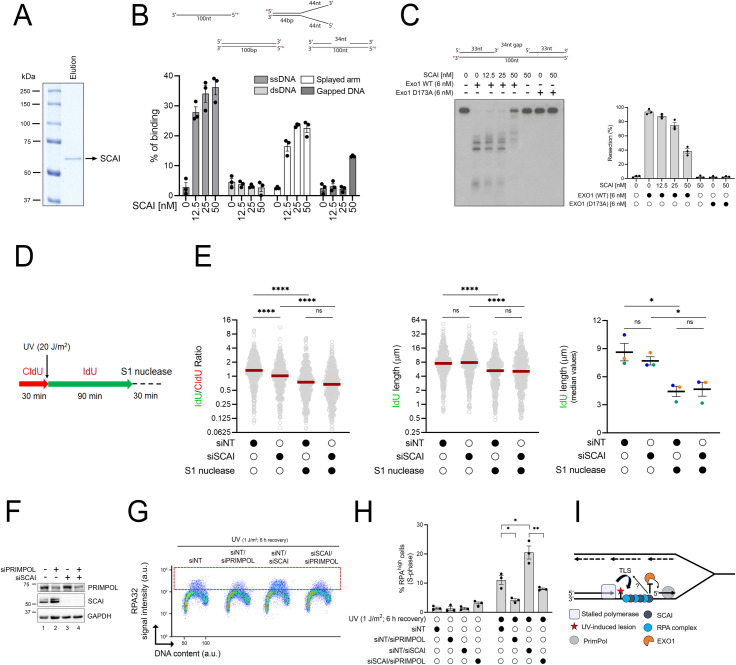
Helix-destabilizing DNA lesions induced by environmental mutagens such as UV light cause genomic instability by strongly blocking the progression of DNA replication forks (RFs). At blocked RF, single-stranded DNA (ssDNA) accumulates and is rapidly bound by Replication Protein A (RPA) complexes. Such stretches of RPA-ssDNA constitute platforms for recruitment/activation of critical factors that promote DNA synthesis restart. However, during periods of severe replicative stress, RPA availability may become limiting due to inordinate sequestration of this multifunctional complex on ssDNA, thereby negatively impacting multiple vital RPA-dependent processes. Here, we performed a genome-wide screen to identify factors that restrict the accumulation of RPA-ssDNA during UV-induced replicative stress. While this approach revealed some expected "hits" acting in pathways such as nucleotide excision repair, translesion DNA synthesis, and the intra-S phase checkpoint, it also identified SCAI, whose role in the replicative stress response was previously unappreciated. Upon UV exposure, SCAI knock-down caused elevated accumulation of RPA-ssDNA during S phase, accompanied by reduced cell survival and compromised RF progression. These effects were independent of the previously reported role of SCAI in 53BP1-dependent DNA double-strand break repair. We also found that SCAI is recruited to UV-damaged chromatin and that its depletion promotes nascent DNA degradation at stalled RF. Finally, we (i) provide evidence that EXO1 is the major nuclease underlying ssDNA formation and DNA replication defects in SCAI knockout cells and, consistent with this, (ii) demonstrate that SCAI inhibits EXO1 activity on a ssDNA gap in vitro. Taken together, our data establish SCAI as a novel regulator of the UV-induced replicative stress response in human cells.


Conflict of interest statement

The authors have declared that no competing interests exist.

Figures

Fig 1
Fig 1. A flow cytometry–based CRISPR screen to identify regulators of RPA-bound ssDNA formation.
(A) Immunofluorescence flow cytometry was used to measure ssDNA-bound RPA32 (y-axis) and total DNA content (x-axis; DAPI signal). Cells were treated with 1, 3, or 5 J/m2 UV or mock-treated, and samples were collected 1, 3, or 6 h post-UV. The dashed red box delineates DNA-bound RPAhigh cells. (B) Quantification from (A). Values are the mean ± SEM from 2 independent experiments. (C) Proof-of-concept using the ATR inhibitor VE-821. Cells were mock-treated or irradiated with 1 J/m2 UV +/− 2 μM of VE-821. Samples were harvested 6 h posttreatment. (D) Quantification from (C). Values are mean ± SEM from 3 experiments. (E) Schematic overview of the FACS-based CRISPR-Cas9 screen. Cells were irradiated with 1 J/m2 UV at 6, 9, 12, and 15 days postinfection with the GeCKOv2 lentiviral library (see Materials and methods). At each time point, mock-treated cells were collected to assess sgRNA representation. (F) Venn diagram of the distribution of the genes recovered at each time point. (G) GO term enrichment analysis of genes identified at all time points. Statistics used: unpaired t test corrected for multiple comparisons using the Holm–Šídák method. **: p ≤ 0.01, ***: p ≤ 0.001. The data underlying the graphs shown in the figure can be found in S1 Data. a.u., arbitrary units ATR, Ataxia telangiectasia and Rad3-related; GO, Gene Ontology; RPA, Replication Protein A; ssDNA, single-stranded DNA.
Fig 2
Fig 2. Validation of selected genes identified in the CRISPR-Cas9 screen.
(A) Main functional groups derived from genes recovered in the screen. Genes selected for further validation are shaded in grey. (B) Representative immunofluorescence flow cytometry assays and immunoblots after siRNA-mediated depletion of selected genes. Cells transfected with nontargeting (siNT) or gene-specific siRNAs were mock- or UV-treated (1 J/m2). % RPAhigh cells (dashed box) were assessed 6 h after irradiation. (C) Quantification of (B). Values represent the mean ± SEM of at least 3 independent experiments. Statistics used: unpaired t test corrected for multiple comparisons using the Holm–Šídák method. *: p ≤ 0.05, **: p ≤ 0.01, ***: p ≤ 0.001, ****: p ≤ 0.0001. The data underlying the graph shown in the figure can be found in S1 Data. a.u., arbitrary units; RPA, Replication Protein A.
Fig 3
Fig 3. SCAI influences the replication stress response post-UV.
(A, C) Immunoblot of whole-cell extracts from control U-2 OS, SCAI-depleted cells (A) and SCAI KO cells (C). (B, D) Immunofluorescence flow cytometry measurements of DNA-associated RPA32 in control, SCAI-depleted cells (B, left plot: siSCAI, right plot: SCAI-KD), or SCAI-KO (D) cells 6 h after 1 J/m2 UV irradiation. RPAhigh cells are delineated by a dashed box. (E, F) Quantification from (B) and (D), respectively. Values are the mean ± SEM from at least 3 independent experiments. (G) Depletion of SCAI increases ssDNA generation post-UV. Control and SCAI-depleted cells were exposed to BrdU for 48 h, and then irradiated with UV as indicated. Native BrdU signal was assessed by immunofluorescence flow cytometry at 6 h post-UV. Median is presented (red line), and error bars indicate the interquartile range. Data combined from 2 independent experiments with similar results. (H) Immunofluorescence flow cytometry measurements of DNA-associated RPA32 in control and SCAI-depleted cells (as in (B)). U-2 OS transfected with siNT or siSCAI were treated with 0.5 μM 4-NQO for 1 h and allowed to recover for 5 h or continuously exposed for 6 h to 5 μM cisplatin (CPPD). (I) Quantification from (H). Values are the mean ± SEM from 3 independent experiments. (J) SCAI-KD/KO cells are sensitive to UV as measured by clonogenic survival. Values are the mean ± SEM from 3 independent experiments. (K) Rescue of UV sensitivity of SCAI-KO cells by transient overexpression of SCAI as determined by clonogenic survival. Values are the mean ± SEM from 2 independent experiments. Right: immunoblot of whole-cell extracts from control U-2 OS (WT), SCAI KO cells, and SCAI-KO that transiently overexpress SCAI. Statistics used: two-tailed unpaired Student t test (E, I), unpaired t test corrected for multiple comparisons using the Holm–Šídák method (J, F), and Mann–Whitney (G). *: p ≤ 0.05, **: p ≤ 0.01, ***: p ≤ 0.001, ****: p ≤ 0.0001. The data underlying the graphs shown in the figure can be found in S1 Data. 4-NQO, 4-nitroquinoline 1-oxide; a.u., arbitrary units; CDDP, cisplatin KD, knockdown; KO, knockout; RPA, Replication Protein A; ssDNA, single-stranded DNA siNT, nontargeting siRNA; siSCAI, SCAI-targeting siRNA; WT, wild type.
Fig 4
Fig 4. The functions of SCAI in the UV-induced replication stress response are unrelated to NER or 53BP1-dependent DSB repair.
(A) Immunofluorescence flow cytometry was used to measure repair synthesis-associated EdU incorporation in G1/G2 cells (y-axis) and total DNA content (x-axis; DAPI signal). Cells transfected with siNT, SCAI-, or XPC-targeting siRNAs were irradiated with 20 J/m2 UV and allowed to recover for 3 h in medium containing 5 μM EdU. The red and blue dashed lines are positioned, respectively, in the middle of the EdU signal of the G1 and G2 cell populations of the siNT-treated cells to facilitate comparison. (B) Quantification from (A). Values are the mean ± SEM from at least 2 independent experiments and are relative to siNT-treated cells. (C) Representative images of 5-EU incorporation from cells transfected with the indicated siRNA. Cells were either mock- or UV-treated (6 J/m2) and samples collected 3 and 24 h after irradiation. Scale bar = 20 μM. White arrows indicate cells with reduced incorporation of 5-EU. (D) Quantification from (C). The red lines represent the median. The assay was repeated twice independently with similar result. (E) Validation of siRNA-mediated KD of XPA using immunoblot. (F) Quantification of UV-induced 6-4PP removal as a function of cell cycle using a flow cytometry–based assay from cells transfected with siNT or siSCAI. Values are the mean ± SEM from 3 independent experiments. (G) Immunofluorescence flow cytometry was used to measure DNA-bound RPA32 (y-axis) and DNA content (x-axis; DAPI signal). Cells were irradiated with either 1 J/m2 UV or 5 Gy IR and allowed to recover for 6 h prior to sample collection. The dashed red box delineates DNA-bound RPAhigh cells. Representative flow cytometry plots are shown. (H) Quantification from (G). Values represent the mean ± SEM from 3 experiments. (I) Immunoblot analysis from cells transfected with the indicated siRNAs. (J) siNT-, siSCAI-, si53BP1-, and siSCAI/si53BP1-transfected cells were irradiated with 1 J/m2 UV and allowed to recover for 6 h before immunofluorescence flow cytometry analysis. The dashed red box delineates DNA-bound RPAhigh cells. Representative flow cytometry plots are shown. (J) Quantification from (I). Values represent the mean ± SEM from 3 independent experiments. Statistics used: two-tailed unpaired Student t test (B, H), two-tailed Mann–Whitney test (D), unpaired t test corrected for multiple comparisons using the Holm–Šídák method (F, I). ns: nonsignificant, *: p ≤ 0.05, **: p ≤ 0.01, ****: p ≤ 0.0001. The data underlying the graphs shown in the figure can be found in S1 Data. a.u., arbitrary units; DAPI, 4′,6-diamidino-2-phenylindole DSB, double-strand break; EdU, 5-ethynyl-2′-deoxyuridine; EU,5-ethynyl-uridine IR, ionizing radiation; KD, knockdown; NER, nucleotide excision repair; RPA, Replication Protein A; SEM, standard error of the mean 6-4PP, 6–4 pyrimidine-pyrimidone photoproduct.
Fig 5
Fig 5. SCAI influences RF progression in cells exposed to UV.
(A) Schematic of the DNA fiber assay used to assess RF progression post-UV. Cells were incubated with CldU (red) for 15 min, irradiated with UV (20 J/m2), and then incubated with IdU (green) for 60 min. (B) Left panel: dot plot and median (red line) of IdU/CldU ratio from control (siNT or WT) or SCAI-depleted (siSCAI or SCAI-KD) cells. Middle panel: dot plot and median of IdU tract lengths. Right panel: dot plot and median of CIdU tract lengths (data combined from n = 3 with similar result). (C) 53BP1 does not influence RF progression post-UV in cells lacking SCAI. Similar experiment as in (B) (left panel; data combined from n = 2 with similar result). (D) SCAI localizes to stalled RFs. Schematic of the assay used to evaluate recruitment of SCAI to stalled RF caused by binding of mCherry-LacR to a LacO array. (E) Representative microscopy images for the assay described in (D). Scale bar = 10 μM. (F) Quantification of GFP or GFP-SCAI normalized signal intensity in the mCherry-LacR foci in non-S phase cells (EdU−) or S phase cells (EdU+). Each point represents a single cell. Lines represent the median. Data combined from 3 similar biological replicates. (G) GFP-SCAI associates with DNA post-UV. Signal intensity from S phase cells was determined by flow cytometry +/− irradiation with 2 J/m2 UV or 5 Gy IR. Cells were allowed to recover for 6 h (UV) or 5 h (IR). Red line represents the mean. Representative results from 3 independent experiments. (H) Immunoblot analysis of the expression level of GFP-SCAI under the experimental conditions described in (G) ± induction by doxycycline. (I) Interrogation of proximity interactome was performed through biotin labeling using TurboID-SCAI under untreated and UV-treated (2 J/m2) conditions. Fold-change is relative to the CRAPome background controls (see Materials and methods). Proteins with a SAINT score ≥0.7 and a BFDR ≤0.05 are considered significant. (J) GO term enrichment analysis of proteins found in the untreated and UV-treated conditions. (K) Proteins associated with the GO term “Cellular response to DNA damage stimulus” are shown as a dot plot in which node color represents the fold increase, node size represents the relative fold change between the experimental conditions, and node edges represent the SAINTexpress BFDR. Raw data are in S2 Table. Statistics used: Mann–Whitney test (B), Kruskal–Wallis with Dunn’s multiple comparisons test (C), two-tailed unpaired Student t test (F), one-way ANOVA corrected for multiple comparisons using Tukey’s test (G). ns: nonsignificant, *: p ≤ 0.05, **: p ≤ 0.01, ***: p ≤ 0.001, ****: p ≤ 0.0001. The data underlying the graphs shown in the figure can be found in S1 Data. a.u., arbitrary units; BFDR, Bayesian false discovery rate; CldU, 5-chloro-2′-deoxyuridine GO, Gene Ontology; IdU, 5-iodo-2′-deoxyuridine IR, ionizing radiation; RF, replication fork; SAINTexpress, Significance Analysis of INTeractome; WT, wild type.
Fig 6
Fig 6. EXO1-dependent accumulation of ssDNA-RPA in cells lacking SCAI.
(A) Depletion of EXO1, and to a lesser extent MRE11, rescues RPA-ssDNA accumulation post-UV in cells lacking SCAI. Cells were treated with 1 J/m2 UV or mock-treated and allowed to recover for 6 h. The dashed red box delineates DNA-bound RPAhigh cells. (B) Quantification from (A). Values represent the mean ± SEM from 3 independent experiments. (C) Immunoblot analysis showing EXO1 or MRE11 depletions from whole-cell extracts from U-2 OS (WT) or SCAI-KO (#1) cells transfected with siRNAs. (D) Top: schematic of the DNA fiber assay used to assess RF progression post-UV. Cells were incubated with CldU (red) for 15 min, irradiated with UVC (20 J/m2), and then incubated with IdU (green) for 60 min. Bottom: dot plot of IdU/CldU ratio and median (red line) from U-2 OS transfected with siNT or siRNA against EXO1 (data combined from n = 2 with similar results). (E) Top: schematic of the DNA fiber assay to monitor RF protection defects (nascent DNA degradation) after HU. Cells were incubated successively with CldU (red) and IdU (green) for 20 min each and then exposed to 4 mM HU for 4 h. Bottom: dot plot of IdU/CldU ratio and median (red line) from U-2 OS (WT) and SCAI-KO (#1) cells transfected with siRNAs against BRCA2 (data combined from n = 2 with similar results). (F) Similar experiment as in (D) but from U-2 OS transfected with siNT or siRNA against BRCA2 (data combined from n = 2 with similar results). (G-I) Lack of BRCA1/2 does not cause RPA-ssDNA accumulation under our experimental conditions. (G) Validation of BRCA1 and BRCA2 KDs by immunoblot. (H) Experiments were performed as in (A) but with cells transfected with siRNAs against BRCA1 or BRCA2 +/− siSCAI. (I) Quantification from (H). Values are the mean ± SEM from 3 independent experiments. Statistics used: unpaired t test corrected for multiple comparisons using the Holm–Šídák method (B), two-tailed unpaired Student t test (I), Kruskal–Wallis with Dunn’s multiple comparisons test (D-F). ns: nonsignificant, **: p ≤ 0.01, ***: p ≤ 0.001, ****: p ≤ 0.0001. The data underlying the graphs shown in the figure can be found in S1 Data. a.u., arbitrary units; CldU, 5-chloro-2′-deoxyuridine HU, hydroxyurea; IdU, 5-iodo-2′-deoxyuridine KD, knockdown; KO, knockout; RF, replication fork; RPA, Replication Protein A; SEM, standard error of the mean ssDNA, single-stranded DNA; WT, wild type.
Fig 7
Fig 7. SCAI inhibits EXO1-mediated DNA resection at ssDNA gaps.
(A) Recombinant SCAI protein was purified from insect cells, separated by SDS-PAGE and visualized by Coomassie blue staining. (B) SCAI preferentially binds ssDNA over dsDNA. 5′-[32P]-labeled ssDNA, dsDNA, splayed arm, or gapped DNA were incubated with purified recombinant SCAI at increasing concentrations and the reaction products separated by acrylamide gel electrophoresis and visualized by autoradiography (see S6A Fig). Quantification of the percentage of SCAI-mediated DNA binding on ssDNA, dsDNA, and splayed arm substrates from 3 independent experiments. (C) Left: in vitro DNA resection assays using a 3′-[32P]-labeled gapped DNA substrate in the absence of any proteins, or with WT or a catalytically inactive version of EXO1 (D173A) supplemented with purified recombinant SCAI. Right: quantification of the percentage of DNA resection from 3 independent experiments. (D, E) Depletion of SCAI does not increase ssDNA gap generation post-UV. (D) Schematic of the DNA fiber assay used to assess RF progression post-UV. Cells were incubated with CldU (red) for 30 min, irradiated with UV (20 J/m2), and then incubated with IdU (green) for 90 min. Cells were then treated or not with S1 nuclease. (E) Left panel: dot plot and median (red line) of IdU/CldU ratio from cells transfected with siRNAs as indicated. Middle panel: dot plot and median of IdU tract lengths (DNA fiber dot plot are combined from n = 3 with similar result). Right panel: histogram of median values of IdU track length derived from independent experiments. Means and SEM are plotted as lines and whiskers. (F-H) Depletion of PrimPol rescues ssDNA-RPA accumulation in cells lacking SCAI. (F) Validation of siRNA-mediated KD of PrimPol and SCAI by immunoblot. (G) Representative immunofluorescence flow cytometry plots from cells transfected with the indicated siRNA treated with 1 J/m2 UV or mock-treated and allowed to recover for 6 h. The dashed red box delineates DNA-bound RPAhigh cells. (H) Quantification from (G). Histogram values represent the mean ± SEM from 3 independent experiments. (I) Proposed model. After UV exposure, PrimPol-dependent repriming generates ssDNA gaps behind RF. These gaps recruit RPA and SCAI, and SCAI acts to restrain the resection activity of EXO1. Possible modulation of Polζ/REV3L-dependent TLS by SCAI cannot be excluded. Statistics used: Kruskal–Wallis with Dunn’s multiple comparisons test (E; left and middle panels), unpaired t test corrected for multiple comparisons using the Holm–Šídák method (E; right panel, H). ns: nonsignificant, *: p ≤ 0.05, **: p ≤ 0.01, ****: p ≤ 0.0001. The data underlying the graphs shown in the figure can be found in S1 Data. a.u., arbitrary units; CldU, 5-chloro-2′-deoxyuridine; dsDNA, double-stranded DNA; IdU, 5-iodo-2′-deoxyuridine KD, knockdown; RF, replication fork; RPA, Replication Protein A; SEM, standard error of the mean; ssDNA, single-stranded DNA; TLS, translesion synthesis; WT, wild type.

Similar articles

Cited by

References

    1. Zeman MK, Cimprich KA. Causes and consequences of replication stress. Nat Cell Biol. 2014. Jan;16(1):2–9. doi: 10.1038/ncb2897 - DOI - PMC - PubMed
    1. Branzei D, Foiani M. Template Switching: From Replication Fork Repair to Genome Rearrangements. Cell. 2007. Dec;131(7):1228–30. doi: 10.1016/j.cell.2007.12.007 - DOI - PubMed
    1. Goodman MF, Woodgate R. Translesion DNA Polymerases. Cold Spring Harb Perspect Biol. 2013. Oct 1;5(10):a010363. doi: 10.1101/cshperspect.a010363 - DOI - PMC - PubMed
    1. Neelsen KJ, Lopes M. Replication fork reversal in eukaryotes: from dead end to dynamic response. Nat Rev Mol Cell Biol. 2015. Apr;16(4):207–20. doi: 10.1038/nrm3935 - DOI - PubMed
    1. Zellweger R, Dalcher D, Mutreja K, Berti M, Schmid JA, Herrador R, et al.. Rad51-mediated replication fork reversal is a global response to genotoxic treatments in human cells. J Cell Biol. 2015. Mar 2;208(5):563–79. doi: 10.1083/jcb.201406099 - DOI - PMC - PubMed

Publication types