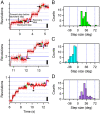
. 2022 Oct 18;119(42):e2210204119.
doi: 10.1073/pnas.2210204119. Epub 2022 Oct 10.

Direct observation of stepping rotation of V-ATPase reveals rigid component in coupling between Vo and V1 motors

Affiliations

Direct observation of stepping rotation of V-ATPase reveals rigid component in coupling between Vo and V1 motors

Akihiro Otomo et al. Proc Natl Acad Sci U S A. .

Abstract

V-ATPases are rotary motor proteins that convert the chemical energy of ATP into the electrochemical potential of ions across cell membranes. V-ATPases consist of two rotary motors, Vo and V1, and Enterococcus hirae V-ATPase (EhVoV1) actively transports Na+ in Vo (EhVo) by using torque generated by ATP hydrolysis in V1 (EhV1). Here, we observed ATP-driven stepping rotation of detergent-solubilized EhVoV1 wild-type, aE634A, and BR350K mutants under various Na+ and ATP concentrations ([Na+] and [ATP], respectively) by using a 40-nm gold nanoparticle as a low-load probe. When [Na+] was low and [ATP] was high, under the condition that only Na+ binding to EhVo is rate limiting, wild-type and aE634A exhibited 10 pausing positions reflecting 10-fold symmetry of the EhVo rotor and almost no backward steps. Duration time before the forward steps was inversely proportional to [Na+], confirming that Na+ binding triggers the steps. When both [ATP] and [Na+] were low, under the condition that both Na+ and ATP bindings are rate limiting, aE634A exhibited 13 pausing positions reflecting 10- and 3-fold symmetries of EhVo and EhV1, respectively. The distribution of duration time before the forward step was fitted well by the sum of two exponential decay functions with distinct time constants. Furthermore, occasional backward steps smaller than 36° were observed. Small backward steps were also observed during three long ATP cleavage pauses of BR350K. These results indicate that EhVo and EhV1 do not share pausing positions, Na+ and ATP bindings occur at different angles, and the coupling between EhVo and EhV1 has a rigid component.

Keywords: V-ATPase; molecular motors; single-molecule analysis.


Conflict of interest statement

The authors declare no competing interest.

Figures
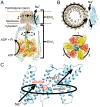
Fig. 1.
Fig. 1.
(A) Overall architecture of EhVoV1. The dotted circular arcs represent the rotation direction driven by ATP hydrolysis. (B) (Top) Top view of the a subunit (cyan) and c10 ring (brown) of EhVo and (Bottom) A (yellow), B (orange), D (green), and F subunits (pink) of EhV1. The black arrow in Top indicates the path of Na+ movement during ATP-driven rotation. The arcs in Bottom represent the catalytic AB pairs. (C) Side view of the a subunit viewed from the c subunit. This structure was constructed by the SWISS-MODEL server (36) using a structure of the a subunit of V-ATPase from T. thermophilus. The black arrows represent the path of Na+ movement during ATP-driven rotation. The mutated residue, aGlu634, is located on the surface of the entry half-channel of the a subunit as highlighted in red letters and a circle.
Fig. 2.
Fig. 2.
(A) Schematic model of the single-molecule rotation assay of EhVoV1 probed with AuNP. Each letter represents the name of the subunits. EhVoV1 was fixed on Ni2+-NTA–coated cover glass via His3 tags added to the C terminus of the c subunit. A streptavidin-coated gold nanoparticle (40 nm in diameter) was attached to the N terminus of the A subunit, which was biotinylated by adding an Avi-tag. Solid and dotted red lines indicate the center axis of EhVoV1 and the centroid of the attached AuNP, respectively. Because the rotor c10 ring was fixed on a glass surface, the stator subunits rotate counterclockwise against the rotor subunits as shown by red arrows. (B) [ATP] dependence of the rotation rate of wild type and aE634A at 300 mM NaCl. Red open circles and blue open squares indicate the data from individual molecules of wild type and aE634A, respectively. The closed symbols are averages, and error bars represent SDs. Data were fitted with the Michaelis–Menten equation: V = VmaxATP · [ATP]/(KmATP + [ATP]). The obtained kinetic parameters are summarized in Table 1. (C) [Na+] dependence of rotation rate of wild type and aE634A at 5 mM ATP. The correspondence of colored symbols is the same as in B. The black lines show the fit with the sum of two independent Michaelis–Menten equations: V = Vmax1Na · [Na+]/(Km1Na + [Na+]) + Vmax2Na · [Na+]/(Km2Na + [Na+]). The obtained kinetic parameters are summarized in Table 2. The contaminating Na+ in the observation buffers was taken into account as shown in SI Appendix, Fig. S6. Namely, 50 mM Bis-Tris (pH 6.5) was used for 0.09 mM Na+, and 20 mM potassium phosphate (pH 6.5) was used for the other [Na+] values as buffers.
Fig. 3.
Fig. 3.
(A) Typical trajectory of ATP-driven rotation of wild-type EhVoV1 at 5 mM ATP and 0.3 mM Na+ recorded at 3,000 fps (0.33 ms time resolution). (Right) Enlarged view of one revolution (360°). Pink, red, and black traces represent raw, median-filtered (current ± 4 frames), and fitted trajectories, respectively. (Inset) The corresponding x–y trajectory. Pink lines and red dots represent the raw and median-filtered (current ± 4 frames) coordinates, respectively. We collected 1,352 steps from 15 molecules. Other examples of trajectories are shown in SI Appendix, Fig. S7. (B) Distribution of the step size fitted with a single Gaussian assuming a single peak. The values at the top right are the fitted parameter (peak ± SD) and average. The ratio of backward steps was 0.8%. (C) Distribution of the duration time before the forward step fitted with a single exponential decay function. The value at the top right is the obtained time constant (fitted value ± SE of the fit).
Fig. 4.
Fig. 4.
Number of detected pauses per single turn of (A) wild type at 5 mM ATP and 0.3 mM Na+ corresponding to Fig. 3 and SI Appendix, Fig. S7; (B) aE634A at 5 mM ATP and 0.3 mM Na+ corresponding to Fig. 5 and SI Appendix, Fig. S8; and (C) aE634A at 1 μM ATP and 0.3 mM Na+ corresponding to Fig. 7 and SI Appendix, Fig. S10.
Fig. 5.
Fig. 5.
(A) Typical trajectory of ATP-driven rotation of aE634A at 5 mM ATP and 0.3 mM Na+ recorded at 1,000 fps (1 ms time resolution). (Right) Enlarged view of one revolution (360°). Pink, red, and black traces represent raw, median-filtered (current ± 7 frames), and fitted trajectories, respectively. (Inset) The corresponding x–y trajectory. Pink lines and red dots represent the raw and median-filtered (current ± 7 frames) coordinates, respectively. We collected 1,718 steps from 23 molecules. Other examples of trajectories are shown in SI Appendix, Fig. S9. (B) Distribution of the step size fitted with a single Gaussian assuming a single peak. The values at the top right are the fitted parameter (peak ± SD) and average. The ratio of backward steps was 1.2%. (C) Distribution of the duration time before the forward step fitted with a single exponential decay function. The value at the top right is the obtained time constant (fitted value ± SE of the fit).
Fig. 6.
Fig. 6.
Single-molecule analysis of aE634A at saturated [ATP] (5 mM). Experimental conditions are described on the left. Examples of trajectories are shown in SI Appendix, Fig. S10. (A and B) Distribution of the step size at 0.09 and 1.3 mM Na+. Black lines represent fitting with single Gaussians. The values at the top right are the fitted parameters (peak ± SD) and averages. (C and D) Distribution of the duration time before the forward step. Black lines represent fitting with single exponential decay functions. The value at the top right is the obtained time constant (fitted value ± SE of the fit). (E) Plot between [Na+] (0.09, 0.3, and 1.3 mM) and time constant obtained by the fitting at 5 mM ATP. The solid red line represents a straight line connecting two data points at 0.09 and 0.3 mM Na+, and its slope is −1.1. The solid blue line is the result of linear fitting among all three data points. The obtained slope is −1.0.
Fig. 7.
Fig. 7.
(A) Typical trajectory of ATP-driven rotation of aE634A at 1 μM ATP and 0.3 mM Na+ recorded at 1,000 fps (1 ms time resolution). (Right) Enlarged view of one revolution (360°). Pink, red, and black traces represent raw, median-filtered (current ± 7 frames), and fitted trajectories, respectively. (Inset) The corresponding x–y trajectory. Pink lines and red dots represent the raw and median-filtered (current ± 7 frames) coordinates, respectively. We collected 920 steps from 21 molecules. Other examples of trajectories are shown in SI Appendix, Fig. S11. (B) Distribution of the step size fitted with the sum of three Gaussians: one peak in backward (minus) direction and two peaks in forward (plus) direction, one of which was fixed at 36°, assuming that it was the step of EhVo. The ratio of backward steps was 6.1%. (C) Distribution of the duration time before the forward step fitted with the sum of two exponential decay functions. The values at the top right are obtained time constants (fitted value ± SE of the fit) and the coefficient of determination (R2) of fitting.
Fig. 8.
Fig. 8.
Backward steps of aE634A observed at 1 μM ATP and 0.3 mM Na+ with 1,000 fps (1 ms time resolution). (A) Examples of trajectories showing the backward steps. The pink, red, and black traces represent the raw, median-filtered (current ± 7 frames), and fitted trajectories of the median-filtered data identified by the algorithm, respectively. The green, cyan, and purple lines indicate forward steps just before backward steps, backward steps, and forward steps just after backward steps (recovery steps), respectively. An asterisk indicates a backward step that is not detected as a step by the algorithm (underfitting). (BD) Distributions of step size for forward steps just before backward steps, backward steps, and recovery steps, respectively. In B and D, the distributions seemed to show two peaks at <36° and 36°. In C, the peak position was larger than −36°, and the average value was −18.8°.
Fig. 9.
Fig. 9.
Schematic models of the stepping rotation and rigid coupling of EhVoV1. The orange circles and dark green squares indicate the pausing positions waiting for Na+ binding to EhVo and ATP binding to EhV1, respectively. The red arrows indicate the 36° steps between adjacent pausing positions for the EhVo. The blue arrows indicate the backward and forward steps smaller than 36° between adjacent pausing positions for EhVo and EhV1. (A) Condition in which only Na+ binding to EhVo is rate-limiting. In this condition, the pauses waiting for ATP binding to EhV1 are too short to be detected, and EhVoV1 rotates unidirectionally without backward steps. (B) Condition in which both Na+ and ATP bindings are rate-limiting. The pausing positions waiting for ATP binding are visualized, and then 13 pausing positions are detected per single turn. Because no torque is generated during the pauses waiting for ATP binding to EhV1, EhVoV1 rotates to the backward and forward pausing positions of EhVo driven by Brownian motion. As a result, backward and forward steps smaller than 36° are observed. A detailed model is shown in SI Appendix, Fig. S15.

Similar articles

Cited by

References

    1. Yasuda R., Noji H., Yoshida M., Kinosita K. Jr., Itoh H., Resolution of distinct rotational substeps by submillisecond kinetic analysis of F1-ATPase. Nature 410, 898–904 (2001). - PubMed
    1. Forgac M., Vacuolar ATPases: Rotary proton pumps in physiology and pathophysiology. Nat. Rev. Mol. Cell Biol. 8, 917–929 (2007). - PubMed
    1. Walker J. E., The ATP synthase: The understood, the uncertain and the unknown. Biochem. Soc. Trans. 41, 1–16 (2013). - PubMed
    1. Boyer P. D., The ATP synthase—A splendid molecular machine. Annu. Rev. Biochem. 66, 717–749 (1997). - PubMed
    1. Vasanthakumar T., Rubinstein J. L., Structure and roles of V-type ATPases. Trends Biochem. Sci. 45, 295–307 (2020). - PubMed

Publication types

LinkOut - more resources