. 2022 Oct 18;119(42):e2205326119.
doi: 10.1073/pnas.2205326119. Epub 2022 Oct 10.

Spatial patterns of climate change across the Paleocene-Eocene Thermal Maximum

Affiliations

Spatial patterns of climate change across the Paleocene-Eocene Thermal Maximum

Jessica E Tierney et al. Proc Natl Acad Sci U S A. .

Abstract

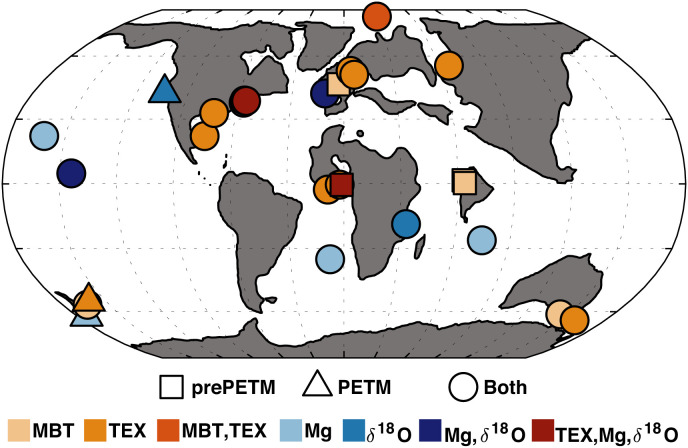
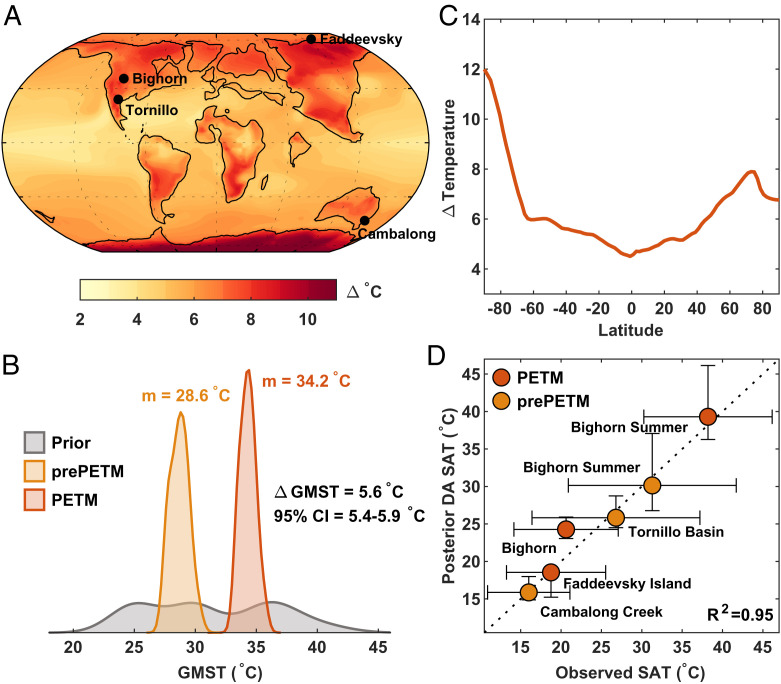
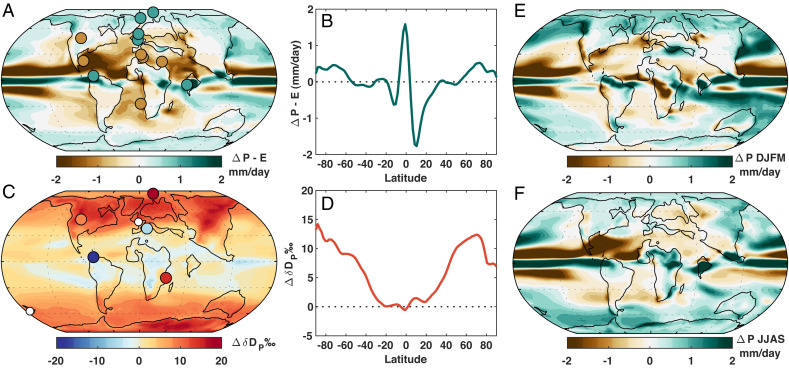
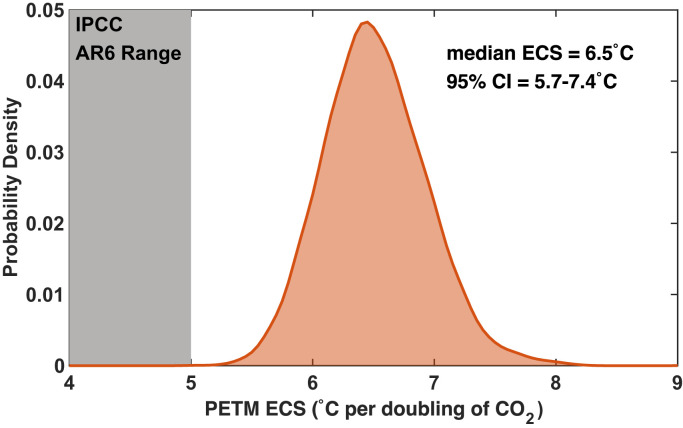
The Paleocene-Eocene Thermal Maximum (PETM; 56 Ma) is one of our best geological analogs for understanding climate dynamics in a "greenhouse" world. However, proxy data representing the event are only available from select marine and terrestrial sedimentary sequences that are unevenly distributed across Earth's surface, limiting our view of the spatial patterns of climate change. Here, we use paleoclimate data assimilation (DA) to combine climate model and proxy information and create a spatially complete reconstruction of the PETM and the climate state that precedes it ("PETM-DA"). Our data-constrained results support strong polar amplification, which in the absence of an extensive cryosphere, is related to temperature feedbacks and loss of seasonal snow on land. The response of the hydrological cycle to PETM warming consists of a narrowing of the Intertropical Convergence Zone, off-equatorial drying, and an intensification of seasonal monsoons and winter storm tracks. Many of these features are also seen in simulations of future climate change under increasing anthropogenic emissions. Since the PETM-DA yields a spatially complete estimate of surface air temperature, it yields a rigorous estimate of global mean temperature change (5.6 C; 5.4 C to 5.9 C, 95% CI) that can be used to calculate equilibrium climate sensitivity (ECS). We find that PETM ECS was 6.5 C (5.7 C to 7.4 C, 95% CI), which is much higher than the present-day range. This supports the view that climate sensitivity increases substantially when greenhouse gas concentrations are high.

Keywords: Paleocene–Eocene Thermal Maximum; climate sensitivity; data assimilation; greenhouse climates; hydrological cycle.


Conflict of interest statement

The authors declare no competing interests.

Figures

Fig. 1.
Fig. 1.
Location and types of temperature proxies that inform the PETM-DA. Data are plotted on the plate reconstruction of ref. , which is used in the deepMIP project boundary conditions (18) and for the climate simulations in this study. Squares indicate locations with pre-PETM data only, triangles indicate locations with PETM data only, and circles indicate locations with data for both the pre-PETM and PETM. δ18O, δ18O of planktic foraminifera; MBT, MBTMe5; Mg, Mg/Ca of planktic foraminifera; TEX, TEX86.
Fig. 2.
Fig. 2.
Temperature changes during the PETM event. (A) Mean annual surface air temperature anomalies during the PETM, relative to the pre-PETM state, overlain with the locations of the terrestrial temperature proxy data plotted in D. (B) Kernel density estimates of GMST in the model prior simulations (gray) and in the posterior DA solutions for the pre-PETM (orange) and PETM (red). Median ΔGMST for the PETM – pre-PETM and the 95% CI are also shown. (C) Zonal mean annual surface air temperature change. (D) Validation of PETM-DA surface air temperature (SAT) against independent terrestrial temperature proxies; error bars represent 95% CIs (Dataset S2 and SI Appendix).
Fig. 3.
Fig. 3.
Changes in the hydrological cycle during the PETM. All panels represent PETM – pre-PETM anomalies. (A) Change in mean annual precipitation minus evaporation (PE) in the PETM-DA overlain with proxy indicators for relatively wetter (green) or drier (brown) conditions relative to the pre-PETM. Proxy data are from the compilation of ref. with the addition of data from ref. (SI Appendix). Proxy colors are qualitative and indicate the sign of change only. (B) Zonal mean annual change in PE. (C) Change in the mean annual δD of precipitation (δDP) in the PETM-DA overlain with inferred changes from leaf wax δD (Dataset S2). Sites with significant changes during the PETM are colored on the same scale as the DA results; sites without significant changes are plotted as smaller white dots. (D) Zonal mean annual change in δDP. (E) The December to March (DJFM) change in precipitation (ΔP). (F) The June to September (JJAS) change in precipitation.
Fig. 4.
Fig. 4.
Probability density function estimate of ECS during the PETM. Median and 95% values are given in the upper right. The 90% range of values reported in the IPCC AR6 Working Group I report is indicated by the gray bar (57).

References

    1. McInerney F. A., Wing S. L., The Paleocene-Eocene Thermal Maximum: A perturbation of carbon cycle, climate, and biosphere with implications for the future. Annu. Rev. Earth Planet. Sci. 39, 489–516 (2011).
    1. Turner S. K., Constraints on the onset duration of the Paleocene–Eocene Thermal Maximum. Philos. Trans.- Royal Soc., Math. Phys. Eng. Sci. 376, 20170082 (2018). - PMC - PubMed
    1. Gutjahr M., et al. , Very large release of mostly volcanic carbon during the Palaeocene-Eocene Thermal Maximum. Nature 548, 573–577 (2017). - PMC - PubMed
    1. Haynes L. L., Hönisch B., The seawater carbon inventory at the Paleocene-Eocene Thermal Maximum. Proc. Natl. Acad. Sci. U.S.A. 117, 24088–24095 (2020). - PMC - PubMed
    1. Jones T. D., et al. , Climate model and proxy data constraints on ocean warming across the Paleocene–Eocene Thermal Maximum. Earth Sci. Rev. 125, 123–145 (2013).

Publication types

Substances