. 2022 Oct 18;119(42):e2122188119.
doi: 10.1073/pnas.2122188119. Epub 2022 Oct 10.

Tetraspanin-5-mediated MHC class I clustering is required for optimal CD8 T cell activation

Affiliations

Tetraspanin-5-mediated MHC class I clustering is required for optimal CD8 T cell activation

Jeff D Colbert et al. Proc Natl Acad Sci U S A. .

Abstract

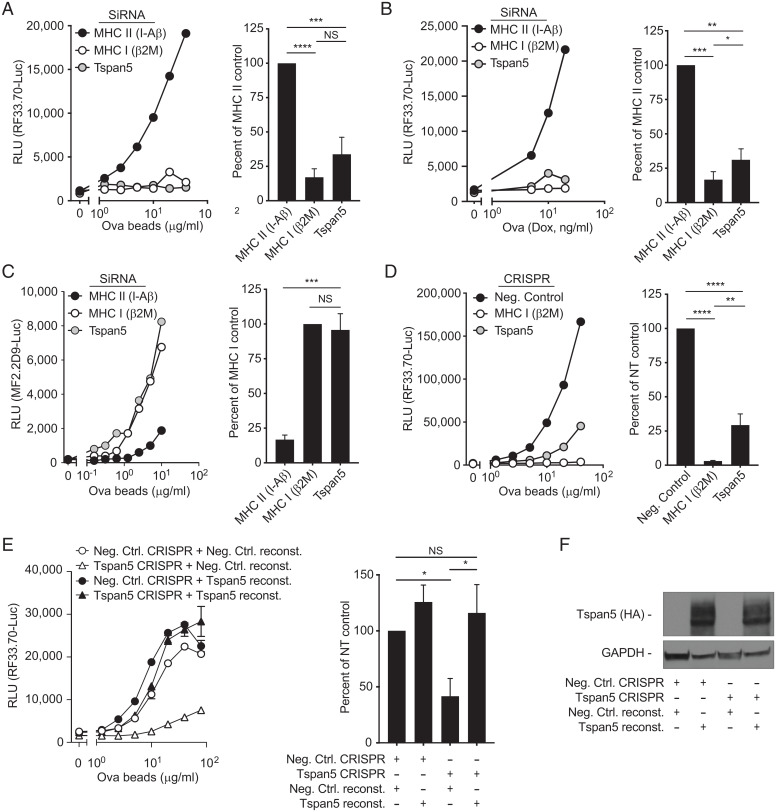
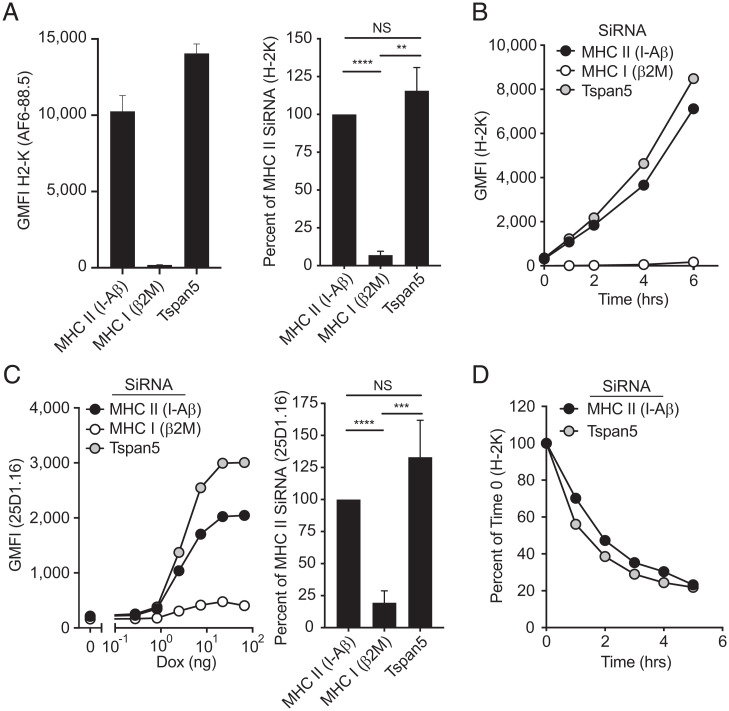
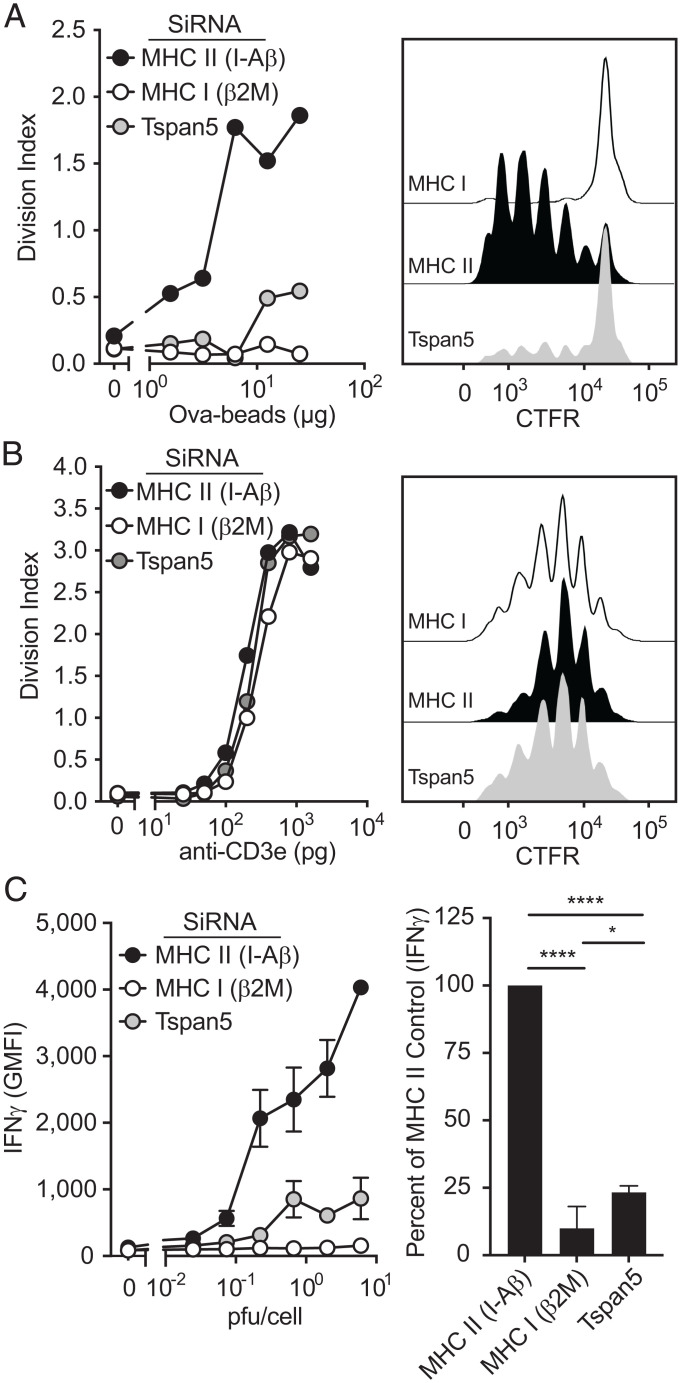
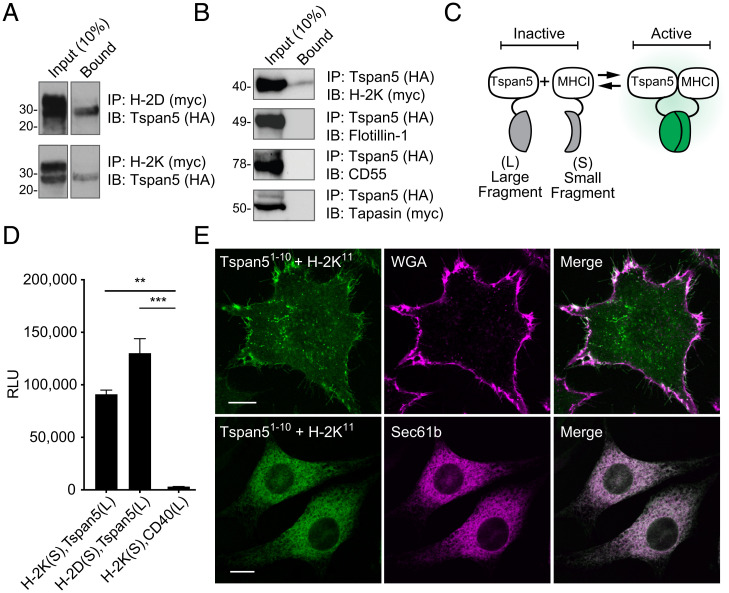
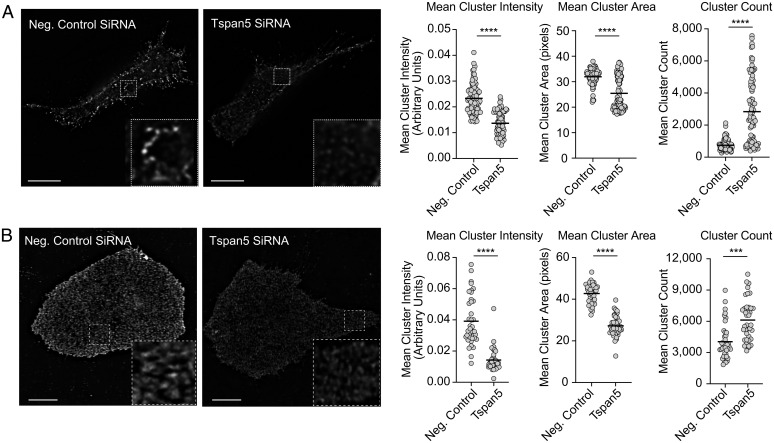
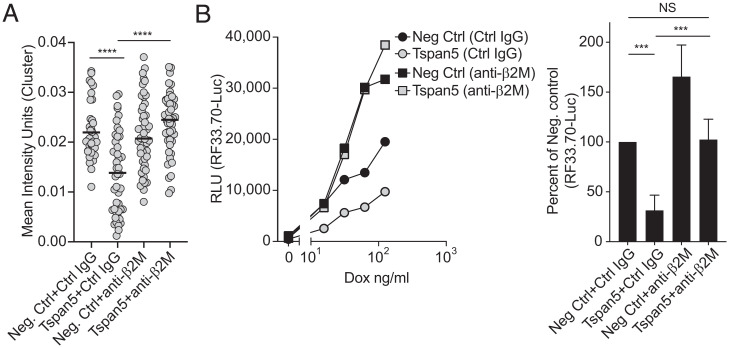
MHC molecules are not randomly distributed on the plasma membrane but instead are present in discrete nanoclusters. The mechanisms that control formation of MHC I nanoclusters and the importance of such structures are incompletely understood. Here, we report a molecular association between tetraspanin-5 (Tspan5) and MHC I molecules that started in the endoplasmic reticulum and was maintained on the plasma membrane. This association was observed both in mouse dendritic cells and in human cancer cell lines. Loss of Tspan5 reduced the size of MHC I clusters without affecting MHC I peptide loading, delivery of complexes to the plasma membrane, or overall surface MHC I levels. Functionally, CD8 T cell responses to antigen presented by Tspan5-deficient dendritic cells were impaired but were restored by antibody-induced reclustering of MHC I molecules. In contrast, Tspan5 did not associate with two other plasma membrane proteins, Flotillin1 and CD55, with or the endoplasmic reticulum proteins Tapasin and TAP. Thus, our findings identify a mechanism underlying the clustering of MHC I molecules that is important for optimal T cell responses.

Keywords: MHC I; Tspan5; antigen presentation; cluster; tetraspanin.


Conflict of interest statement

The authors declare no competing interest.

Figures

Fig. 1.
Fig. 1.
Loss of Tspan5 expression selectively inhibits MHC class I presentation. (A) DC3.2 cells were treated with siRNA for the MHC class II gene H-2 I-A β-chain (black), the MHC class I light chain β2M (white), or Tspan5 (gray). A titration of Ova-conjugated beads was cultured with these DCs and the CD8+ T cell hybridoma RF33.70-Luc and after 16 h, cross-presentation was assayed by measuring luciferase activity. The line graph shows an antigen titration for a representative experiment and the bar graph shows averages of greater than or equal to three experiments taken at a single antigen dose. (B) Similar to A, except instead of Ova-beads, endogenous cytosolic Ova (NS-Ova) expression was induced in DC2.4 cells using doxycycline for 4 h, at which time BFA (to block further egress of pMHC I complexes) and CD8 T cells were added for the remaining 16 h. (C) Similar to A, except instead of measuring MHC I presentation, MHC II presentation was measured with the CD4+ hybridoma MF2.2D9-Luc and siRNA for β2M (MHC I, white) was used as the negative control. (D) Cross-presentation was assessed in DC3.2 cells gene-edited with CRISPR/Cas9 transduction without a guide (Neg Control, black), with guides targeting β2M (MHC I (white), or with guides targeting Tspan5 (gray). Ova-beads were used as a source of antigen and assayed as described in A. (E) DCs were transfected with Cas9, without guide RNA (Neg Ctrl. CRISPR, circle) or with Tspan5 targeted guides (Tspan5 CRISPR, triangle) as shown. Neg Control or Tspan5 knockout DCs were then transfected with an empty plasmid (Neg. Ctrl. reconst.) or with a mutant form of Tspan5 that cannot be targeted by Tspan5 guide RNAs (Tspan5 reconst.) and presentation of Ova was assayed as in D. Left graph shows representative data over a dose range of Ova-conjugated beads, while the Right bar graph shows luciferase activity normalized to the nontargeting control with the mean + SD from three independent assays. (F) Western blot of lysates from DCs shown in D were probed for the Tspan5 expression (HA-tag). (GAPDH serves as the loading control). T cell activation was assessed by the production of luciferase under control of an NFAT promoter in all assays. RLU refers to luciferase activity expressed as relative light units. Data in AD are representative of greater than or equal to three independent experiments. Statistics were calculated from independent experiments using one-way ANOVA. P values were based on Tukey’s multiple comparison test; NS = not significant, *P < 0.05, **P < 0.01, ***P < 0.001, ****P < 0.0001.
Fig. 2.
Fig. 2.
Expression and peptide-loading of MHC class I molecules are not affected by the loss of Tspan5 expression. (A) DC2.4 cells were treated with siRNA for the MHC class II gene H-2 I-A β-chain (MHC II), the MHC class I light chain, β2M (MHC I), or Tspan5. H-2K expression at the PM was assessed by flow cytometry 48 h after silencing. Data shown are from a representative experiment (Left) or normalized data expressed as the percent MHC I expression compared to MHC II (I-Aβ) siRNA treated control with means + SD of six independent experiments (Right). (B) Similar to A, except surface MHC class I molecules were removed from silenced DCs by acid stripping and then allowed to recover over time (MHC II, black), the MHC class I light chain (MHC I, white) or Tspan5 (gray). Data are representative of n > 3 independent experiments. (C) DCs were silenced for 48 h and then antigen synthesis was induced with increasing concentrations of Dox. Production and egress of Ova-MHC I complexes was measured by analyzing surface Ova peptide-bound H-2K molecules by flow cytometry (25D1.16 antibody). The line graph is a representative experiment, and the bar graph shows means ± SD of greater than or equal to three experiments taken at a single dose of Dox (Right). (D) DCs were treated with siRNA targeting H-2 I-A β-chain (MHC II [I-Aβ], black) or Tspan5 (gray). Cells were treated with BFA to block egress of new MHC I molecules from the ER. Remaining surface MHC I molecules were analyzed over time by flow cytometry. Data are representative of three independent experiments. Statistics were calculated using one-way ANOVA. P values were based on Tukey’s multiple comparison test; NS = not significant, **P < 0.01, ***P < 0.001, ****P < 0.0001.
Fig. 3.
Fig. 3.
Loss of Tspan5 selectively reduces MHC class I antigen presentation. (A) DC3.2 cells were silenced for the indicated genes. After 48 h, DCs were γ-irradiated and cultured with increasing concentrations of Ova-conjugated beads as a source of antigen and CTFR-labeled naïve OT-1 T cells. Proliferation was assessed 72 h later by measuring dilution of CTFR in CD8 T cells by flow cytometry. (B) Similar to A, except a titration of anti-CD3 was used instead of Ova-conjugated beads. (A and B, Left) Average number of cell division (division index) over the full titration of Ova (A) or anti-CD3e (B). (Right) Histograms of OT.1 proliferation by dilution of CTFR label at 10 μg/mL Ova beads (A) and 1 ng/mL anti-CD3e (B). (C) DCs were silenced as indicated in A. Cells were then infected with a titration of LCMV, washed, and coincubated with effector p14 CD8 T cells from p14 TCR transgenic mice. T cell activation was assessed by intracellular staining for IFN-γ in cells gated for CD8 expression. The line graph shows an antigen titration for a representative experiment and the bar graph shows averages of greater than or equal to three experiments taken at a single antigen dose (∼0.6 to 2 pfu per cell) (Right). Statistics were calculated from independent experiments using one-way ANOVA. P values were based on Tukey’s multiple comparison test; *P ≤ 0.05, ****P < 0.0001.
Fig. 4.
Fig. 4.
Tspan5 associates with MHC class I molecules. (A) Myc epitope-tagged MHC I molecules, H-2D (Upper) or H-2K (Lower), were coexpressed with HA-tagged Tspan5 in 293T cells. Cells were lysed and association with Tspan5 was determined by immunoprecipitation (IP) and Western blotting (IB) as indicated. Input = 10% of lysate and Bound = eluted from myc antibody. (B) Same as A except that HA-tagged Tspan5 was immunoprecipitated and coprecipitated proteins were detected from the same lysate and eluate fractions by immunoblotting for myc-tagged H-2K, endogenous Flotillin-1, endogenous CD55 (DAF), or myc-tagged Tapasin. (C) Diagram of the complementation assay with either split luciferase or split GFP. (D) Constructs fused with the short (S) or long (L) NanoBit luciferase fragments were cotransfected in 3T3 cells as indicated. Protein–protein interaction was assessed by measuring luciferase activity. **P < 0.01, ***P < 0.001. (E) Split complementation was adapted for GFP to assess where protein–protein interaction occurs within L929 cells. GFP fluorescence indicates Tspan5 fused with GFP-exons 1 to 10 (Tspan51-10) complementing with the MHC class I fused with GFP-exon 11 (H-2K11, Left). Subcellular distribution was determined by staining the cell membrane with Alexa647-conjugated WGA (Upper) or by cotransfection with ER resident protein Sec61b-mCherry (Lower). The confocal images shown in the Upper panels were taken in an optical plane near the coverslip in order to visualize complementation in the plasma membrane and the ones in the Lower panels were taken through the center of the cell to visualize the ER. (Scale bar, 5 µm.) Data shown are representative of at least three independent experiments.
Fig. 5.
Fig. 5.
Tspan5 regulates MHC class I receptor organization. (A) DC2.4 cells were transfected with siRNA targeting Tspan5 or the MHC II IA beta chain (Neg. Control SiRNA). The distribution of H-2K molecules on the cell surface was assessed using fluorophore conjugated Fab-fragment (Y3-Fab). Fluorescent images were acquired from multiple 0.125-μm z-sections followed by deconvolution using the DV OMX V4 microscope, as described. Images shown are representative of membrane staining at the coverslip. (Scale bar, 10 µm.) Inset images (4.2x magnification) show representative differences in cluster intensity and size. Graphs show the mean intensity of MHC I clusters per cell from representative experiments (arbitrary units, Left graph), mean area of MHC I clusters (pixels, Center graph), or cluster count (Right graph). Data in the graphs are from >45 independent images and are representative of ≥3 independent assays. (B) Similar to A except using human U2OS cells instead of DC2.4 cells and a fluorophore conjugated Fab-fragment (W6/32-Fab) instead of Y3-Fab. Magnification shown in B is 3.3x. (Scale bar, 10 µm.) P values determined by two-tailed, unpaired t test; ***P < 0.001, ****P < 0.0001.
Fig. 6.
Fig. 6.
Antibody cross-linking of MHC I molecules restores MHC I clustering and T cell stimulation. (A) Tspan5 or negative control siRNA (Neg. Ctrl) were transfected into DC3.2 cells. After 48 h, cells were treated with a control antibody (Ctrl IgG) or with an antibody to the class I light chain (anti-β2M) for 4 h. Cells were fixed and stained with H-2K reactive Y3-Fab. Total internal reflection microscopy was used to image MHC I clusters at the PM. Graph shows the mean intensity of stained clusters/cell (gray circle) as assessed by Cell Profiler for >40 images per condition. Mean values per treatment are shown with a black horizontal line. P values were determined by an unpaired, two-tailed t test; *** P < 0.001, ****P < 0.0001. (B, Left) Ova expression was induced in DC2.4 cells by the addition of Dox for 2 h followed by the addition of BFA and RF33.70-Luc T cells plus control antibody (Control IgG) or MHC I-crosslinking antibody (anti-β2M). After 16 h of incubation, T cell activation was assessed by measuring luciferase activity. Graph shown is representative for antigen (Dox) titration. (Right) Same as the Left panel, except the percent of T cell activation was compared to the negative control siRNA + negative control antibody treated samples at 30 ng/mL Dox. Data are the means + SD from greater than three independent experiments. P values were determined by two-tailed, paired t test; NS = not significant, ***P < 0.001.

References

    1. Blum J. S., Wearsch P. A., Cresswell P., Pathways of antigen processing. Annu. Rev. Immunol. 31, 443–473 (2013). - PMC - PubMed
    1. Rock K. L., Farfán-Arribas D. J., Colbert J. D., Goldberg A. L., Re-examining class-I presentation and the DRiP hypothesis. Trends Immunol. 35, 144–152 (2014). - PMC - PubMed
    1. Colbert J. D., Cruz F. M., Rock K. L., Cross-presentation of exogenous antigens on MHC I molecules. Curr. Opin. Immunol. 64, 1–8 (2020). - PMC - PubMed
    1. Yachi P. P., Lotz C., Ampudia J., Gascoigne N. R. J., T cell activation enhancement by endogenous pMHC acts for both weak and strong agonists but varies with differentiation state. J. Exp. Med. 204, 2747–2757 (2007). - PMC - PubMed
    1. Krogsgaard M., Juang J., Davis M. M., A role for “self” in T-cell activation. Semin. Immunol. 19, 236–244 (2007). - PMC - PubMed

Publication types