

Bending the curve: Simple but massive conservation action leads to landscape-scale recovery of amphibians
- PMID: 36215493
- PMCID: PMC9586276
- DOI: 10.1073/pnas.2123070119
Bending the curve: Simple but massive conservation action leads to landscape-scale recovery of amphibians
Abstract
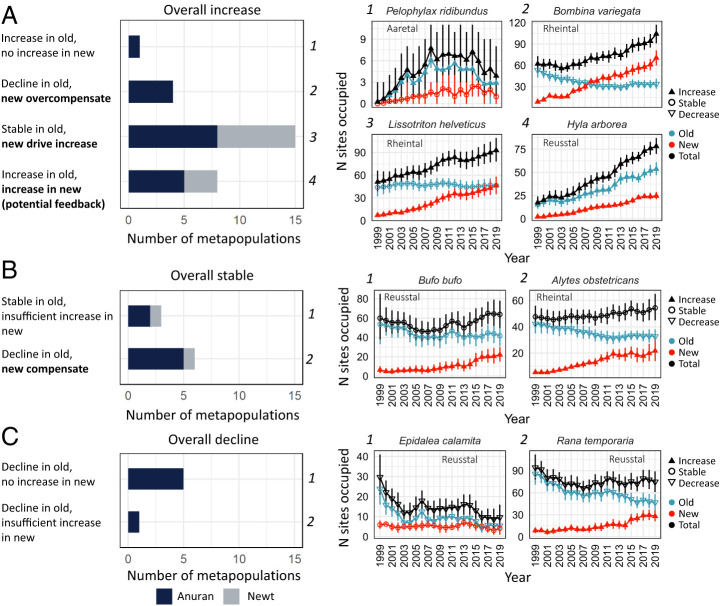
Success stories are rare in conservation science, hindered also by the research-implementation gap, where scientific insights rarely inform practice and practical implementation is rarely evaluated scientifically. Amphibian population declines, driven by multiple stressors, are emblematic of the freshwater biodiversity crisis. Habitat creation is a straightforward conservation action that has been shown to locally benefit amphibians, as well as other taxa, but does it benefit entire amphibian communities at large spatial scales? Here, we evaluate a landscape-scale pond-construction program by fitting dynamic occupancy models to 20 y of monitoring data for 12 pond-breeding amphibian species in the Swiss state Aargau, a densely populated area of the Swiss lowlands with intensive land use. After decades of population declines, the number of occupied ponds increased statewide for 10 out of 12 species, while one species remained stable and one species further declined between 1999 and 2019. Despite regional differences, in 77% of all 43 regional metapopulations, the colonization and subsequent occupation of new ponds stabilized (14%) or increased (63%) metapopulation size. Likely mechanisms include increased habitat availability, restoration of habitat dynamics, and increased connectivity between ponds. Colonization probabilities reflected species-specific preferences for characteristics of ponds and their surroundings, which provides evidence-based information for future pond construction targeting specific species. The relatively simple but landscape-scale and persistent conservation action of constructing hundreds of new ponds halted declines and stabilized or increased the state-wide population size of all but one species, despite ongoing pressures from other stressors in a human-dominated landscape.
Keywords: amphibian decline; conservation management; evidence-based conservation; freshwater biodiversity; recovery.
Conflict of interest statement
The authors declare no competing interest.
Figures


Similar articles
-
Building pondscapes for amphibian metapopulations.Conserv Biol. 2024 Dec;38(6):e14165. doi: 10.1111/cobi.14281. Epub 2024 May 7. Conserv Biol. 2024. PMID: 38711380 Free PMC article.
-
Patterns of Assemblage Structure Indicate a Broader Conservation Potential of Focal Amphibians for Pond Management.PLoS One. 2016 Jul 26;11(7):e0160012. doi: 10.1371/journal.pone.0160012. eCollection 2016. PLoS One. 2016. PMID: 27459303 Free PMC article.
-
Effectiveness of amphibians as biodiversity surrogates in pond conservation.Conserv Biol. 2017 Apr;31(2):437-445. doi: 10.1111/cobi.12802. Epub 2016 Nov 10. Conserv Biol. 2017. PMID: 27503782
-
Freshwater biodiversity: importance, threats, status and conservation challenges.Biol Rev Camb Philos Soc. 2006 May;81(2):163-82. doi: 10.1017/S1464793105006950. Epub 2005 Dec 12. Biol Rev Camb Philos Soc. 2006. PMID: 16336747 Review.
-
Emerging threats and persistent conservation challenges for freshwater biodiversity.Biol Rev Camb Philos Soc. 2019 Jun;94(3):849-873. doi: 10.1111/brv.12480. Epub 2018 Nov 22. Biol Rev Camb Philos Soc. 2019. PMID: 30467930 Review.
Cited by
-
Global monitoring for biodiversity: Uncertainty, risk, and power analyses to support trend change detection.Sci Adv. 2024 Feb 16;10(7):eadj1448. doi: 10.1126/sciadv.adj1448. Epub 2024 Feb 16. Sci Adv. 2024. PMID: 38363843 Free PMC article.
-
An Isolated and Deeply Divergent Hynobius Species from Fujian, China.Animals (Basel). 2023 May 17;13(10):1661. doi: 10.3390/ani13101661. Animals (Basel). 2023. PMID: 37238092 Free PMC article.
-
Amphibian richness, rarity, threats, and conservation prospects across the U.S. National Park System.NPJ Biodivers. 2024 Nov 21;3(1):35. doi: 10.1038/s44185-024-00067-1. NPJ Biodivers. 2024. PMID: 39572683 Free PMC article.
-
The conservation value of freshwater habitats for frog communities of lowland fynbos.PeerJ. 2023 Jun 5;11:e15516. doi: 10.7717/peerj.15516. eCollection 2023. PeerJ. 2023. PMID: 37304861 Free PMC article.
References
-
- Dirzo R., et al. , Defaunation in the Anthropocene. Science 345, 401–406 (2014). - PubMed
-
- Bradshaw C. J. A., et al. , Underestimating the challenges of avoiding a ghastly future. Front. Conserv. Sci. 1, 615419 (2021).
-
- Hoffmann M., et al. , The impact of conservation on the status of the world’s vertebrates. Science 330, 1503–1509 (2010). - PubMed
-
- Grant E. H. C., Muths E., Schmidt B. R., Petrovan S. O., Amphibian conservation in the Anthropocene. Biol. Conserv. 236, 543–547 (2019).
Publication types
MeSH terms
LinkOut - more resources
Full Text Sources
Miscellaneous
