. 2022 Oct 18;119(42):e2211178119.
doi: 10.1073/pnas.2211178119. Epub 2022 Oct 10.

Connecting sequence features within the disordered C-terminal linker of Bacillus subtilis FtsZ to functions and bacterial cell division

Affiliations

Connecting sequence features within the disordered C-terminal linker of Bacillus subtilis FtsZ to functions and bacterial cell division

Min Kyung Shinn et al. Proc Natl Acad Sci U S A. .

Abstract

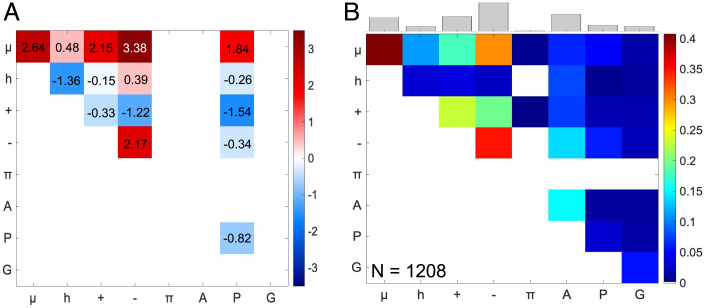
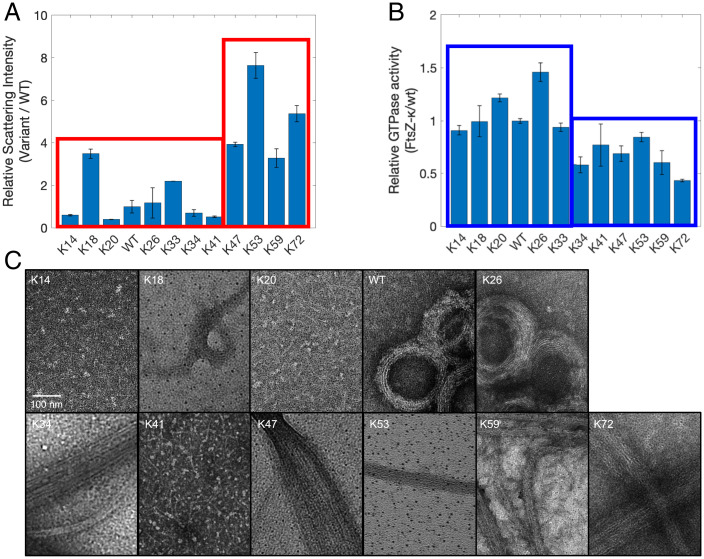
Intrinsically disordered regions (IDRs) can function as autoregulators of folded enzymes to which they are tethered. One example is the bacterial cell division protein FtsZ. This includes a folded core and a C-terminal tail (CTT) that encompasses a poorly conserved, disordered C-terminal linker (CTL) and a well-conserved 17-residue C-terminal peptide (CT17). Sites for GTPase activity of FtsZs are formed at the interface between GTP binding sites and T7 loops on cores of adjacent subunits within dimers. Here, we explore the basis of autoregulatory functions of the CTT in Bacillus subtilis FtsZ (Bs-FtsZ). Molecular simulations show that the CT17 of Bs-FtsZ makes statistically significant CTL-mediated contacts with the T7 loop. Statistical coupling analysis of more than 1,000 sequences from FtsZ orthologs reveals clear covariation of the T7 loop and the CT17 with most of the core domain, whereas the CTL is under independent selection. Despite this, we discover the conservation of nonrandom sequence patterns within CTLs across orthologs. To test how the nonrandom patterns of CTLs mediate CTT-core interactions and modulate FtsZ functionalities, we designed Bs-FtsZ variants by altering the patterning of oppositely charged residues within the CTL. Such alterations disrupt the core-CTT interactions, lead to anomalous assembly and inefficient GTP hydrolysis in vitro and protein degradation, aberrant assembly, and disruption of cell division in vivo. Our findings suggest that viable CTLs in FtsZs are likely to be IDRs that encompass nonrandom, functionally relevant sequence patterns that also preserve three-way covariation of the CT17, the T7 loop, and core domain.

Keywords: autoinhibition; autoregulation; covariation; intrinsically disordered proteins; polymerization.


Conflict of interest statement

The authors declare no competing interest.

Figures

Fig. 1.
Fig. 1.
Modular architecture of B. subtilis FtsZ includes a disordered CTT. (A) The electrostatic potential (103) is mapped onto the core domain in red and blue for regions of negative and positive potential, respectively. The T7 loop is highlighted in green. The CTT includes a CTL that connects the 17-residue C-terminal peptide (CT17) to the core domain. (B) The CTT is predicted to be disordered using IUPRED (60). The CTT sequence is shown with negatively and positively charged residues of the CTL in red and blue, respectively. The CT17 sequence is shown in gray. (C) Ensemble-averaged secondary structure contents of the CTT obtained from atomistic simulations. (D) UV-CD spectra of the four Bs-FtsZ constructs. See Materials and Methods for details on scaling of the [θ*].
Fig. 2.
Fig. 2.
The CT17 and the CTL interact with mutually exclusive sites on the surface of the core domain. Color bars show the contact frequency between the core and (A and B) CT17 (blue) or (C and D) CTL (red) in WT, ΔCTL, and ΔCT17 constructs. The T7 loop is shown in space-filling model. The C terminus of the core domain where the CTT emanates is noted.
Fig. 3.
Fig. 3.
Protein sectors identified within FtsZ show covariation of the CT17 and most of the core domain surface, including the T7 loop. (A) Structure of Bs-FtsZ is shown (Protein Data Bank ID: 2VAM) (48) with cartoon-like schematic of CTT emanating from the C terminus of the core domain as a reference for B and C. The T7 loop is highlighted in cyan and the CT17 in magenta. (B) Five protein sectors are identified from SCA of 1,208 FtsZ orthologs. Each of Sectors 1 through 5 is colored in red, orange, yellow, green, and blue, respectively. (C) Only Sector 1 is shown in red, which includes both the T7 loop and the CT17.
Fig. 4.
Fig. 4.
Uncovering nonrandom binary patterns in the Bs-FtsZ CTL and from CTLs across orthologs. (A) Z-score matrix for the CTL of Bs-FtsZ shows statistically significant nonrandom sequence patterns. Color bar indicates the z-scores. The axes describe the residue or residue types for which the z-scores were calculated: μ = polar, h = hydrophobic, + = positively charged, − = negatively charged, π = aromatic, A = alanine, P = proline, G = glycine. (B) Frequency of observing nonrandom segregation of different types of residue pairs (zxy > 1.5) in CTLs from 1,208 FtsZ orthologs. The histogram on top shows relative cumulative frequencies of nonrandom features for segregation of each residue/residue type.
Fig. 5.
Fig. 5.
Increased linear segregation of oppositely charged residues leads to compaction. (A) Computed Rg values from simulations and measured Rh values from FCS experiments as a function of κ+− values of the Kappa variants. (B) Calculated Shannon entropy (s′) values of the Kappa variants from computed bivariate distributions of Rg and asphericity (δ*) values. (C) Normalized Rg of the Kappa variants from simulations performed in two modes, isolated (open symbols) and tethered to the GTPase core (solid symbols). CTT sequences with lower κ+− values undergo compaction upon being tethered to the folded core. (D) DLS data, shown as a checkerboard plot, quantifies the percent likelihood of observing a scatterer of a specific size for each of the Kappa variants.
Fig. 6.
Fig. 6.
CTT–CTT and CTT–core interactions contribute to FtsZ assembly in the absence of GTP. Correlation between the mean apparent Dh measured using DLS and (A) εintra-CTT, (B) εcore-CTT, (C) εtot, and (D) κ+−. Here, the gray area is the 95% confidence region of the linear regression. (E) Fractional contributions of εinter-CTT (white bars) and εcore-CTT (blue bars) to εtot.
Fig. 7.
Fig. 7.
Changes to the linear mixing vs. segregation of oppositely charged residues within the CTL affects GTP-dependent FtsZ assembly and GTPase activity. (A) Scattering intensities of 5 µM of WT FtsZ and different variants were measured in the presence of 1 mM GTP. Values reported here were normalized to those of WT. The red outlines indicate two broad categories of the Kappa variants that show less than or more than threefold increase in scattering intensities compared to WT. (B) Rates of GTP hydrolysis of the Kappa variants are normalized to that of WT. Blue outlines indicate two broad categories of the Kappa variants that show faster or slower rates compared to the WT. (C) Negative-stain TEM micrographs show the diverse morphologies formed by the Kappa variants.
Fig. 8.
Fig. 8.
Changes to the extent of segregation vs. mixing of oppositely charged residues within the CTL affects protein stability, cell growth, and division. (A) Quantitative immunoblots of the Kappa variants. Intensities from the gel (Above) are quantified in the histogram (Below) and normalized to the WT. WT (−) and WT (+) indicate uninduced and induced conditions, respectively. (B) Cell growth profiles of the Kappa variants. (C) In the IFM images, FtsZ is artificially colored in green, and the cell wall is in red. (Scale bar: 2 µm.) (D) The extent of condensation of FtsZ Kappa variants in cells is quantified using cumulative distribution functions. (E) We quantified cell lengths, L/R ratios, and percentage of cells with spirals from the IFM images. Data for at least 200 cells were used for each of the Kappa variants. The L/R data for WT(−) and K72 were plotted at 0 since neither rings nor spirals were observed.

References

    1. Brodsky S., Jana T., Barkai N., Order through disorder: The role of intrinsically disordered regions in transcription factor binding specificity. Curr. Opin. Struct. Biol. 71, 110–115 (2021). - PubMed
    1. Morffy N., Strader L. C., Structural aspects of auxin signaling. Cold Spring Harb. Perspect. Biol. 14, a039883 (2022). - PMC - PubMed
    1. Dyson H. J., Wright P. E., NMR illuminates intrinsic disorder. Curr. Opin. Struct. Biol. 70, 44–52 (2021). - PMC - PubMed
    1. Bondos S. E., Dunker A. K., Uversky V. N., Intrinsically disordered proteins play diverse roles in cell signaling. Cell Commun. Signal. 20, 20 (2022). - PMC - PubMed
    1. Desjardins G., et al. , Synergy of aromatic residues and phosphoserines within the intrinsically disordered DNA-binding inhibitory elements of the Ets-1 transcription factor. Proc. Natl. Acad. Sci. U.S.A. 111, 11019–11024 (2014). - PMC - PubMed

Publication types

MeSH terms

LinkOut - more resources