

Lactate induces metabolic and epigenetic reprogramming of pro-inflammatory Th17 cells
- PMID: 36215678
- PMCID: PMC9724659
- DOI: 10.15252/embr.202254685
Lactate induces metabolic and epigenetic reprogramming of pro-inflammatory Th17 cells
Abstract
Increased lactate levels in the tissue microenvironment are a well-known feature of chronic inflammation. However, the role of lactate in regulating T cell function remains controversial. Here, we demonstrate that extracellular lactate predominantly induces deregulation of the Th17-specific gene expression program by modulating the metabolic and epigenetic status of Th17 cells. Following lactate treatment, Th17 cells significantly reduced their IL-17A production and upregulated Foxp3 expression through ROS-driven IL-2 secretion. Moreover, we observed increased levels of genome-wide histone H3K18 lactylation, a recently described marker for active chromatin in macrophages, in lactate-treated Th17 cells. In addition, we show that high lactate concentrations suppress Th17 pathogenicity during intestinal inflammation in mice. These results indicate that lactate is capable of reprogramming pro-inflammatory T cell phenotypes into regulatory T cells.
Keywords: Th17 cells; Tregs; histone lactylation; immunometabolism; lactate.
© 2022 The Authors.
Figures
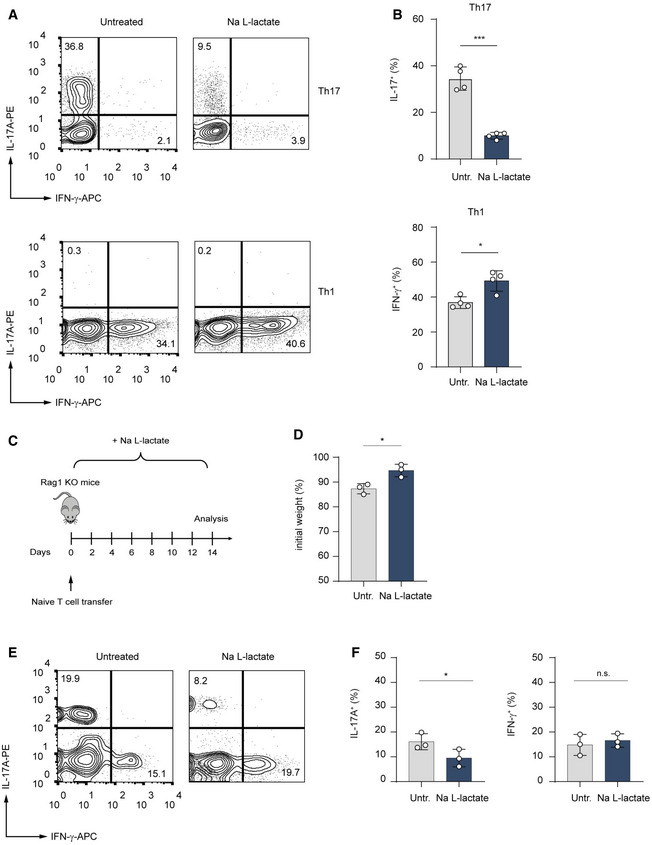
- A, B
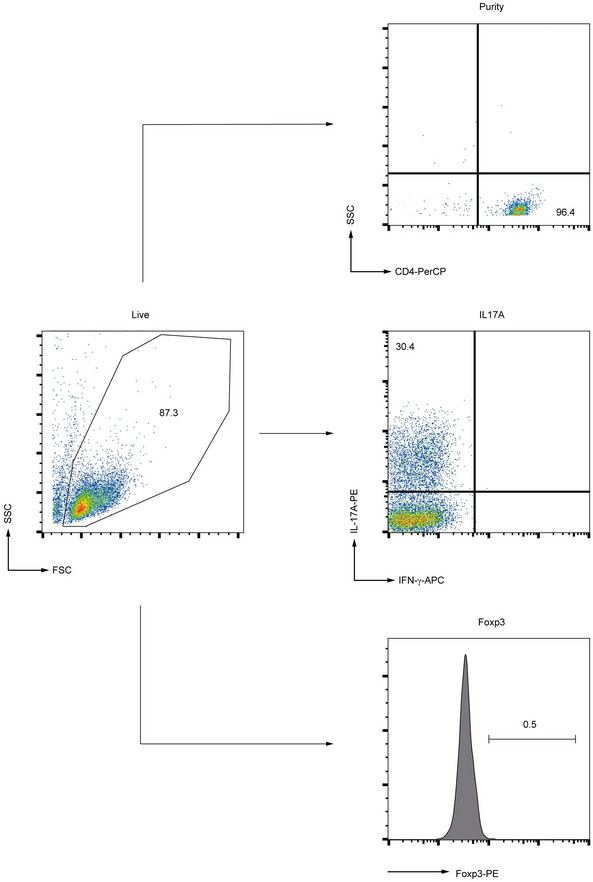
CD4+ T cells purified from spleens and LNs of WT mice were polarized under Th1‐ and Th17‐inducing conditions and treated with lactate (25 mM) for 3 days. Representative contour plots (A) and bar graphs (B) show the frequency of IL‐17+ and IFN‐γ+ cells (n = 4 biological replicates; *P = 0.01–0.05; ***P < 0.001; data (B) are shown as mean ± s.e.m.). Data are analyzed by the Student's t‐test.
- C
Schematic overview of the T cell transfer model of colitis in Rag1−/− mice.
- D–F
Rag1‐deficient mice were injected with 7.5 × 10⁵ naïve CD4+ T cells. One group of the recipient mice was orally treated with 200 mM lactate during the experiment. After 2 weeks, the body weight changes (D) and the frequency of IL‐17A+ and IFN‐γ+ T cells in the colon (E and F) were analyzed. Weight changes were normalized to the initial body weight of mice before the adoptive transfer of T cells. One of two experiments is displayed (n = 3 mice per group per experiment; n.s., not significant; *P = 0.01–0.05; results are expressed as mean ± s.e.m.). Data are analyzed by the Student's t‐test.
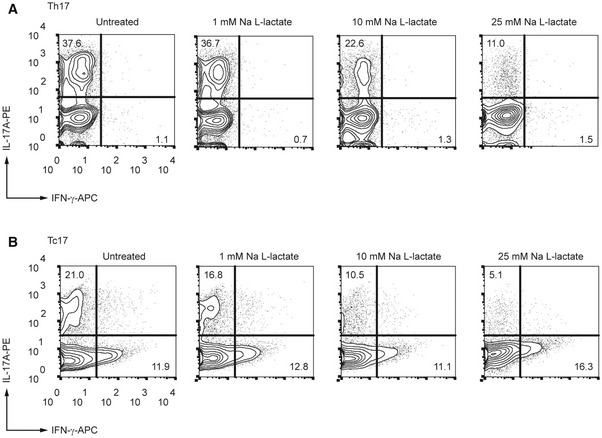
- A, B
CD4+ (A) and CD8+ (B) T lymphocytes were purified from spleens and LN of WT mice and differentiated under Th17‐polarizing conditions for 3 days in the presence of increasing lactate concentrations, respectively. Representative contour plots indicate the percentage of IL‐17A+ and IFN‐γ+ cells, detected by flow cytometry (n = 3 biological replicates).
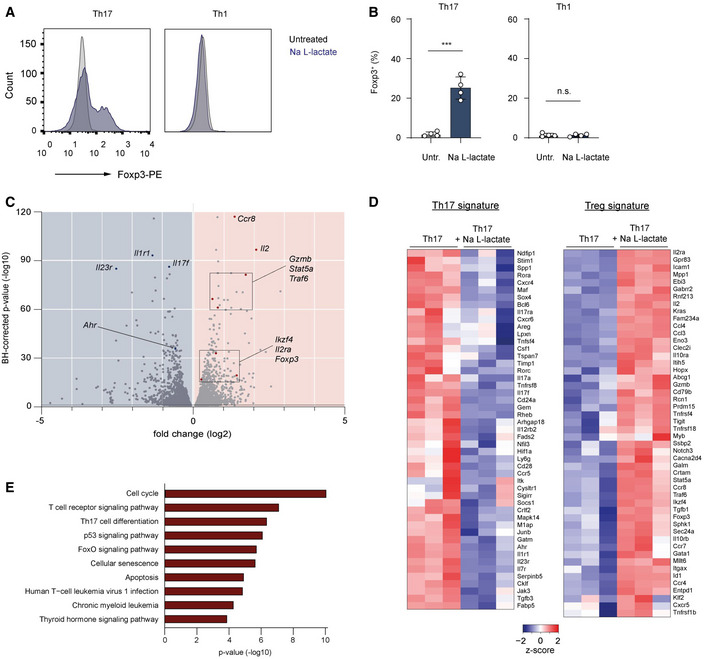
- A, B
The percentage of Foxp3+ cells in polarized Th1 and Th17 cells treated with lactate (25 mM) for 3 days. Representative flow cytometry histograms (A) and bar graphs (B) show the intracellular staining for the transcription factor Foxp3 (n = 4 mice per group; n.s., not significant; ***P < 0.001; data are shown as mean ± s.e.m.). Data are analyzed by the Student's t‐test.
- C–E
CD4+ T cells isolated from spleens and LNs of WT mice were polarized under Th17‐inducing conditions for 3 days following lactate treatment (25 mM) and subsequently analyzed by RNA‐sequencing (n = 3 biological replicates). Volcano plot (C), heatmaps for Th17 and Treg signature genes (D), and KEGG‐pathway analysis (E) of differentially expressed genes in Th17 cells are displayed. Heatmaps (D) with individual lines representing one of three replicates per group show the list of selected genes associated with Treg or Th17 cell genetic signatures that are specifically modified by lactate. Z‐scores were calculated on the basis of TPMs. The respective terms for “top ten” pathways that are modified by lactate are indicated on the left (E).
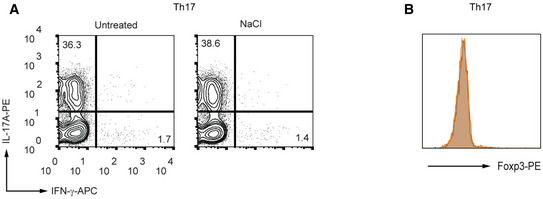
- A, B
Murine CD4+ T cells were cultured under Th17‐inducing conditions in the presence or absence of NaCl (25 mM) for 3 days. The percentages of IL‐17A+ cells (A) and Foxp3 expression (B) were determined by flow cytometry (n = 3 biological replicates).
- A, B
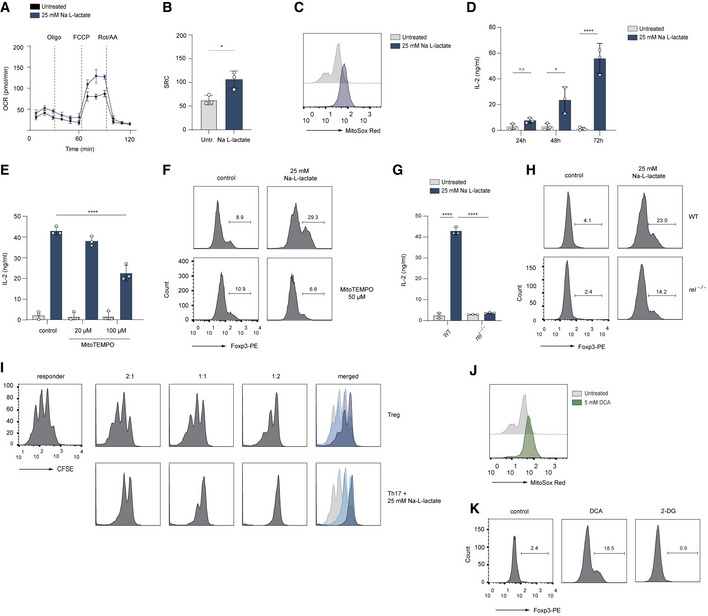
The Seahorse assay showing the oxygen consumption rate (OCR) and spare respiratory capacity (SRC, calculated as maximal OCR/basal OCR) in vitro‐cultured Th17 cells at baseline and in response to oligomycin (Oligo), FCCP, and rotenone plus antimycin A (Rot/AA). Data are analyzed by the Student's t‐test (n = 3 biological replicates, *P = 0.01–0.05; results are expressed as mean ± s.e.m.).
- C
The production of mitochondrial ROS in lactate‐treated Th17 cells was measured by FACS analysis using MitoSOX Red on day 3 of cell culture. A representative histogram is displayed (n = 3 biological replicates).
- D
The secretion of IL‐2 from untreated Th17 cells or Th17 cells treated with lactate was determined by ELISA on day 1, 2 and 3 of cell differentiation (n = 3 biological replicates, n.s., not significant; *P = 0.01–0.05; ****P < 0.0001; data are expressed as mean ± s.e.m.). Data are analyzed by the Student's t‐test.
- E, F
Lactate‐stimulated Th17 cells were treated with a mitochondria‐targeted antioxidant, (mitoTEMPO). On day 3 of cell culture, the secretion of IL‐2 was measured by ELISA (E), and Foxp3 expression (F) was analyzed by flow cytometry (n = 3 biological replicates, ****P < 0.0001; data are expressed as mean ± s.e.m.). Data are analyzed by the Student's t‐test.
- G, H
c‐Rel‐deficient Th17 cells were treated with sodium lactate for 3 days. Afterward, the IL‐2 secretion (G), and Foxp3 expression (H) were examined (n = 3 biological replicates, ****P < 0.0001; data are expressed as mean ± s.e.m.). Data are analyzed by the Student's t‐test.
- I
The cell proliferation of naïve CD4+ T cells (responder T cells) was analyzed on day 3 of co‐culture in the presence of Tregs or lactate‐treated Th17 cells as described in Material and Methods. The suppressive capacity of lactate‐treated Th17 cells was measured by dilution of CSFE within responder T cell fraction by flow cytometry. One representative experiment is depicted (n = 3 biological replicates).
- J, K
CD4+ T cells were isolated from spleens and LNs of WT mice. Purified T cells were polarized under Th17‐inducing conditions and treated with DCA (5 mM) or 2‐DG (1 mM) for 3 days. The flow cytometry results for mitochondrial ROS (MitoSOX Red, J) and Foxp3 expression (K) following treatment of cells are shown. One representative experiment is depicted (n = 3 biological replicates).
- A
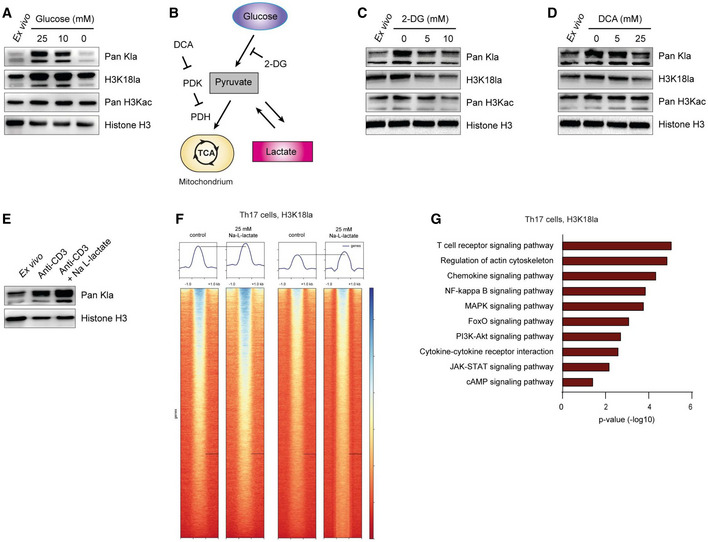
Western blots of acid‐extracted histones from activated CD4+ T cells showing global histone lactylation and H3K18 lactylation levels in the presence and absence of glucose at 24 h after stimulation of cells. One of three similar experiments is shown.
- B
Schematic diagram of glycolysis and inhibitory compounds used for inhibition of lactate production (E and F). While 2‐Deoxy‐D‐glucose (2‐DG) competitively inhibits glycolysis, dichloroacetate (DCA) is an inhibitor of pyruvate dehydrogenase kinase (PDK), which results in enhanced activity of pyruvate dehydrogenase (PDH) and elevated pyruvate oxidation.
- C, D
Western blots of acid‐extracted histones from activated CD4+ T cells in the presence of glycolysis inhibitor 2‐DG and PDK inhibitor DCA, respectively. Cells were analyzed for global lactylation and H3K18 lactylation 24 h after activation of TCR with anti‐CD3 (5 μg/ml).
- E
Immunoblotting of acid‐extracted lactylated histones from anti‐CD3‐activated CD4+ T cells in the presence of extracellular lactate (25 mM) at 24 h of cell culture. One representative out of three experiments is shown. For all immunoblotting experiments, ex vivo purified, nonactivated CD4+ T cells were used as control lymphocytes.
- F
ChIP‐sequencing showing H3K18 lactylation signals in control Th17 cells and lactate‐treated Th17 lymphocytes (25 mM). Biological duplicates are shown.
- G
KEGG‐pathway analysis (biological processes) of H3K18la‐specific genes in lactate‐treated Th17 cells. Statistical significance was determined using DAVID software.
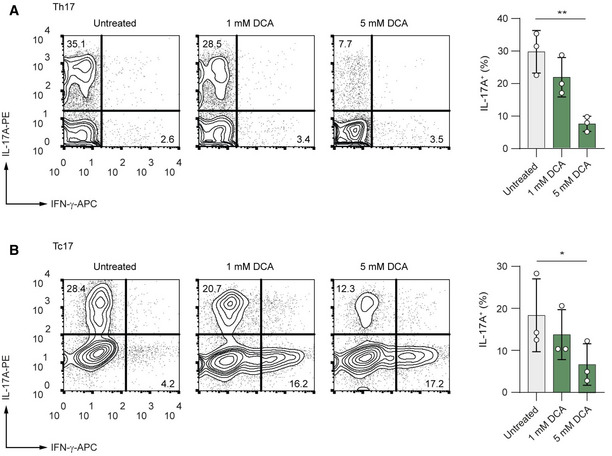
- A, B
CD4+ (A) and CD8+ (B) T cells were isolated from spleens and LNs of WT mice. Purified T cells were polarized under Th17‐inducing conditions and treated with increasing concentrations of DCA for 3 days. Representative contour plots show the frequencies of IL‐17A+ and IFN‐γ+ cells analyzed by flow cytometry (n = 3 biological replicates; n.s., not significant; *P = 0.01–0.05; **P = 0.001–0.01; data are analyzed by the two‐tailed unpaired Student's t‐test).
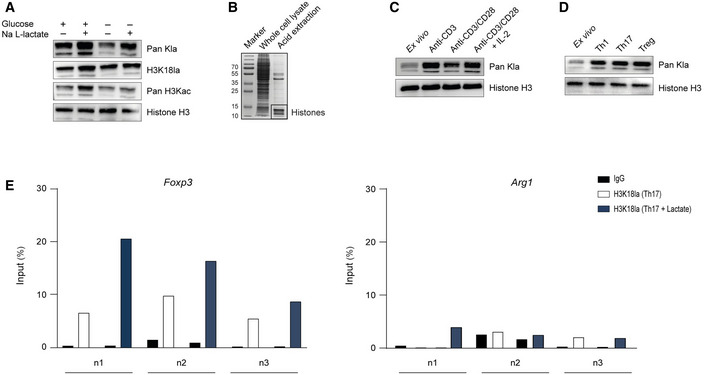
Global histone (Kla) and specific H3K18 lactylation were analyzed by immunoblotting 24 h after stimulation of nonpolarized macrophages. Bone marrow‐derived macrophages were cultured in the presence or absence of 25 mM glucose and 25 mM Na L‐lactate. Immunoblotting of representative whole‐cell extracts is shown (n = 3 biological replicates).
Histone preparation by acid extraction from the whole‐cell lysate of murine CD4+ T cells, visualized by Coomassie blue staining.
Western blots of acid‐extracted histones from activated CD4+ T cells showing global histone lactylation in the presence of glucose (25 mM) at 24 h after stimulation of cells. One of three similar experiments is shown.
Immunoblotting of acid‐extracted lactylated histones from differentiated Th1, Th17, and Treg cells on day 3 of differentiation. As control lymphocytes, ex vivo purified, nonactivated CD4+ T cells were used.
ChIP analysis of H3K18‐lactylated histones at the Arg1 and Foxp3 promoter regions in the absence or presence of extracellular lactate (25 mM) was performed after 24 h of the cell culture for Th17 cells. Three independent experiment (n = 3 biological replicates) are shown (n1, n2, n3).
References
-
- Certo M, Tsai CH, Pucino V, Ho PC, Mauro C (2021) Lactate modulation of immune responses in inflammatory versus tumour microenvironments. Nat Rev Immunol 21: 151–161 - PubMed
Publication types
MeSH terms
Substances
Associated data
- Actions
- Actions
LinkOut - more resources
Full Text Sources
Molecular Biology Databases
