. 2022 Sep 21;34(12):4877-4896.
doi: 10.1093/plcell/koac284. Online ahead of print.

Plant biomechanics and resilience to environmental changes are controlled by specific lignin chemistries in each vascular cell type and morphotype

Affiliations

Plant biomechanics and resilience to environmental changes are controlled by specific lignin chemistries in each vascular cell type and morphotype

Delphine Ménard et al. Plant Cell. .

Abstract

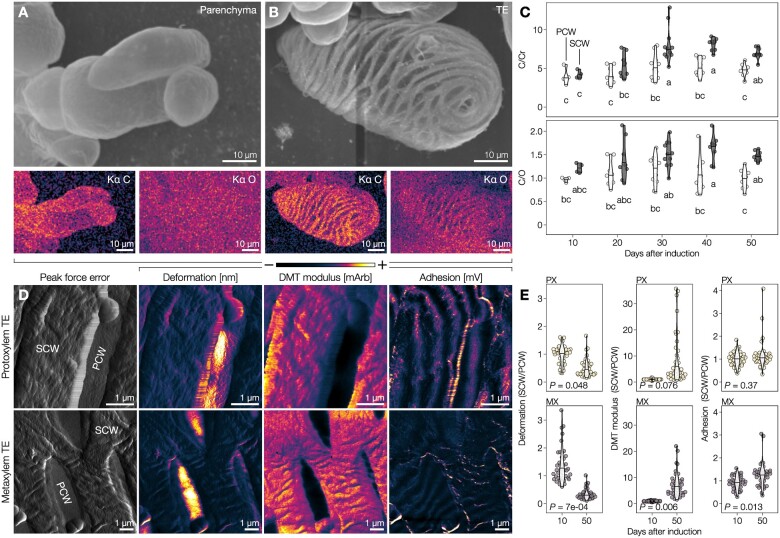
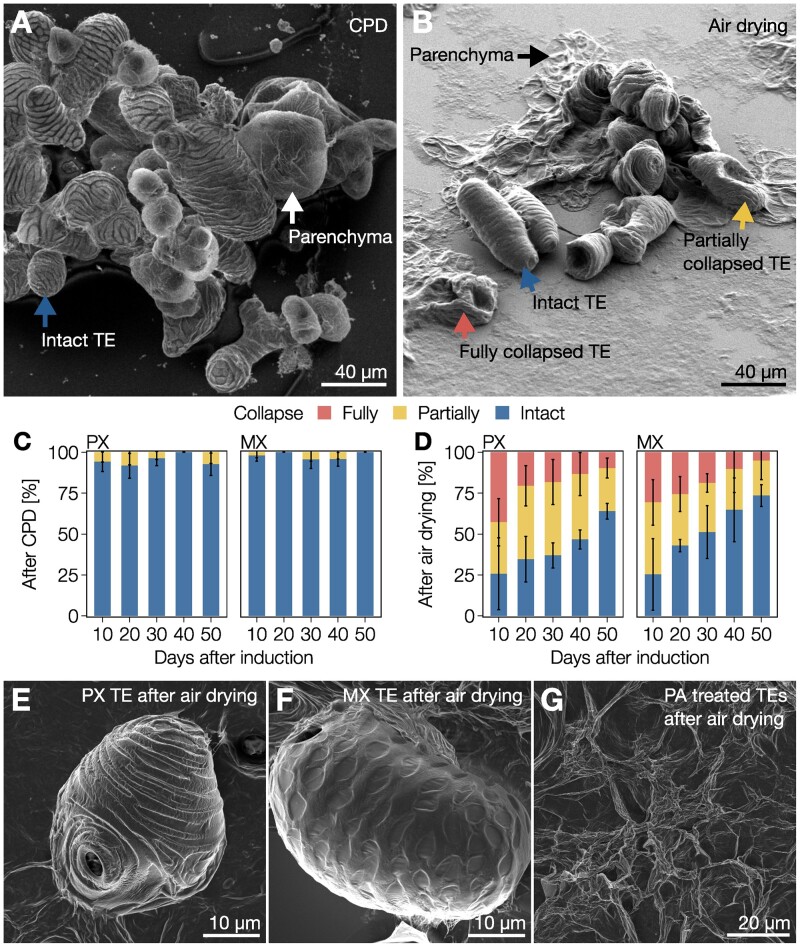
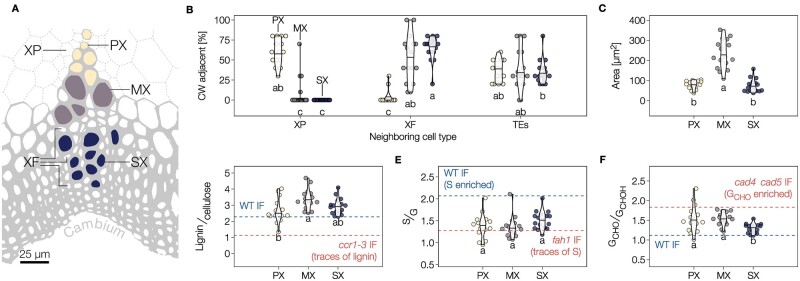
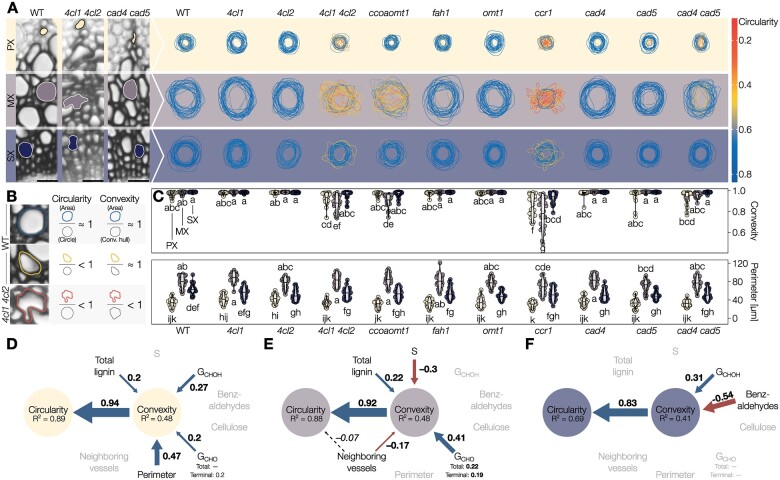
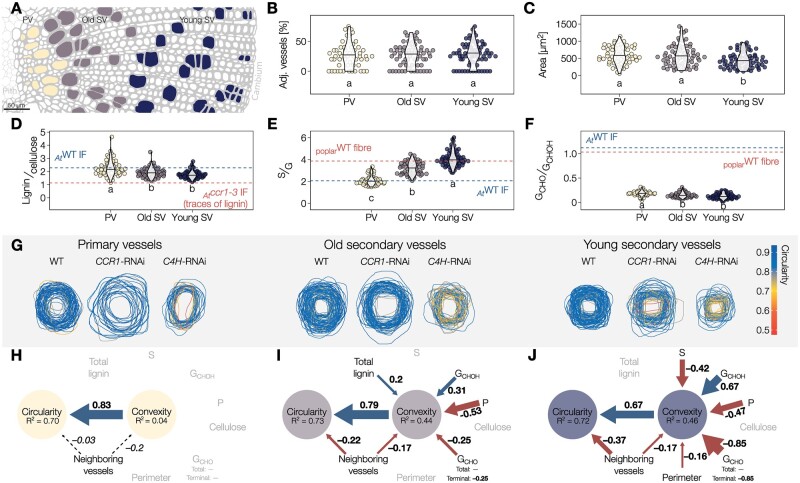
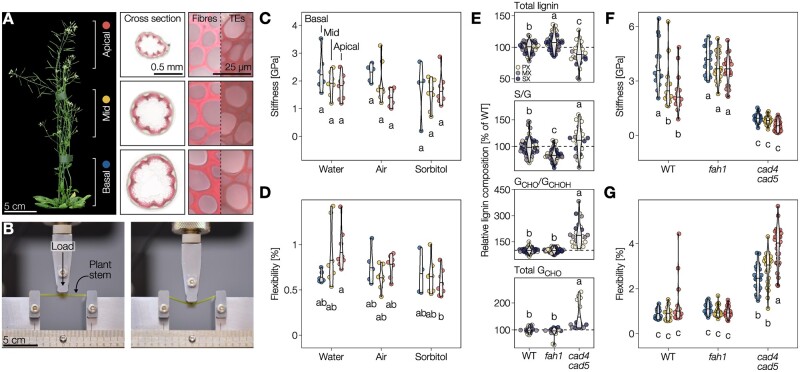
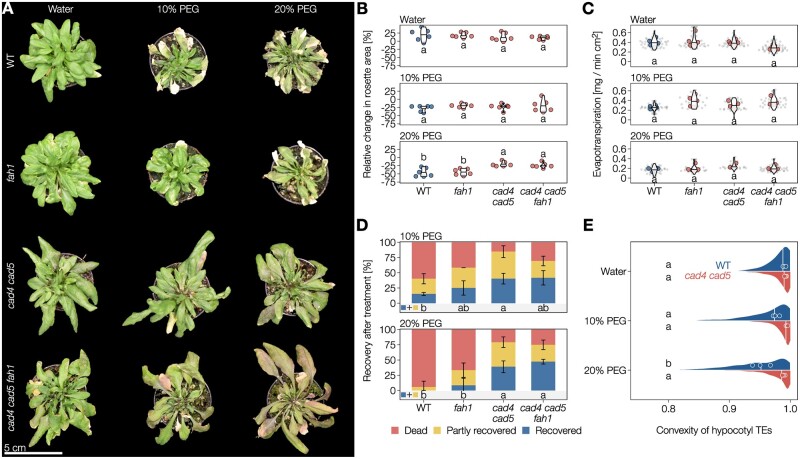
The biopolymer lignin is deposited in the cell walls of vascular cells and is essential for long-distance water conduction and structural support in plants. Different vascular cell types contain distinct and conserved lignin chemistries, each with specific aromatic and aliphatic substitutions. Yet, the biological role of this conserved and specific lignin chemistry in each cell type remains unclear. Here, we investigated the roles of this lignin biochemical specificity for cellular functions by producing single cell analyses for three cell morphotypes of tracheary elements, which all allow sap conduction but differ in their morphology. We determined that specific lignin chemistries accumulate in each cell type. Moreover, lignin accumulated dynamically, increasing in quantity and changing in composition, to alter the cell wall biomechanics during cell maturation. For similar aromatic substitutions, residues with alcohol aliphatic functions increased stiffness whereas aldehydes increased flexibility of the cell wall. Modifying this lignin biochemical specificity and the sequence of its formation impaired the cell wall biomechanics of each morphotype and consequently hindered sap conduction and drought recovery. Together, our results demonstrate that each sap-conducting vascular cell type distinctly controls their lignin biochemistry to adjust their biomechanics and hydraulic properties to face developmental and environmental constraints.


Figures

Figure 1
Figure 1
Postmortem lignification actively alters biomechanics of TE SCWs. A, Scanning electron micrograph of isolated parenchyma cells, prepared using critical-point drying (CPD), as well as their EDS carbon (C) and oxygen (O) signals in color-coded intensity. B, Scanning electron micrograph of an isolated TE 30 d after induction, prepared by CPD, with color-coded intensity EDS C and O signals. C, EDS ratios of C to coating chromium (Cr) and C to O ratios of 9 µm2 (300 nm × 300 nm) of the primary (PCW) and SCW from isolated 10- to 50-d-old TEs. Note that SCWs gradually increase their C/O ratio during postmortem maturation; n =4–11 individual cells per time point. Different lowercase letters indicate significant differences according to a Tukey-HSD test (per panel; α = 0.05). D, AFM peak force error and intensity color-coding of deformation, DMT modulus, and adhesion of 50-d-old isolated PX and MX TEs. We used mArb and mV as arbitrary units to report changes for stiffness and adhesion, respectively, to the cantilever between independent cells measured at different times. E, SCW to PCW ratios of deformation, DMT modulus, and adhesion of 10- and 50-d-old PX and MX TEs. The P-value of a two-tailed Welch’s t test is indicated; n =4 individual cells per time point and morphotype, 10 measurements per cell.
Figure 2
Figure 2
Gradual postmortem lignification enables all TE morphotypes to resist extreme Ψ differentials. A, Scanning electron micrograph of 30-d-old isolated TEs and parenchyma cells produced from iPSCs and prepared using CPD. Note that both TEs and parenchyma are intact, as indicated by the blue and white arrows, respectively. B, Scanning electron micrograph of 30-d-old isolated TEs and parenchyma cells produced from iPSCs and prepared using air drying. Note that parenchyma cells (black arrow) are completely flattened whereas TEs were either fully collapsed (red arrow), partially collapsed (yellow arrow), or intact (blue arrow). C and D, Relative proportion of 10- to 50-d-old TEs from iPSCs that were fully collapsed, partially collapsed, or intact after CPD (C) or air drying (D). Error bars represent ± SD of three independent experiments; n =27–159 individual cells per cell type and time point. E, Scanning electron micrograph of a 30-d-old PX TE after air drying. F, Scanning electron micrograph of a 30-d-old MX TE after air drying. G, Scanning electron micrograph of 30-d-old unlignified TEs treated with PA after air drying.
Figure 3
Figure 3
Different TE morphotypes in annual plants have specific morphological features and lignin chemistry. A, Schematic diagram of the localization of the three TE types in vascular bundles of Arabidopsis stems according to their distance to the cambium: PX in yellow, MX in purple and SX in blue. Each TE morphotype shares different proportions of XFs and XP surrounding each TE type. B, Relative proportion of adjacent cell types for each TE morphotype. Note that the proportion of neighboring TEs remains constant independently of the TE morphotype. Different lowercase letters indicate significant differences according to a Kruskal–Wallis test followed by Dunn’s multiple comparison (α = 0.05). C, Lumen area of each TE morphotype determined from cross-sections. D, Relative lignin to cellulose ratio measured by Raman microspectroscopy. E, Relative S to G ratio measured by Raman microspectroscopy. F, Relative GCHO to GCHOH ratio measured by Raman microspectroscopy. Because range and intercept of Raman band ratios differ from other biochemical analyses but still maintain a linear relationship (Agarwal, 2019; Blaschek et al., 2020b), references are presented for each lignin parameter using interfascicular fibers (IF) in WT and relevant mutants. Different lowercase letters in panels C–H indicate significant differences according to a Tukey-HSD test (per panel; α = 0.05); n =15–17 individual cells per TE type in three plants.
Figure 4
Figure 4
Lignin structure differently alters the resistance of specific TE morphotypes in annual plants. A, Traces of 25 representative perimeters for each TE type in transverse cross-sections from stems of Arabidopsis loss-of-function mutants altered in lignin structure. The outline color indicates the circularity of each respective TE. B, Schematic explanation of circularity and convexity of TEs. Any deviation from a perfect circle will decrease circularity, whereas only inward collapse of the perimeter will decrease convexity. C, Convexity and perimeter of PX, MX, and SX TEs in different phenylpropanoid biosynthesis mutants; n =50 TEs per morphotype and genotype. Different lowercase letters indicate significant differences according to a Tukey-HSD test (per panel; α = 0.05). D–F, Structural equation models of the factors influencing TE convexity and circularity in the PX (D), MX (E), and SX (F) of Arabidopsis. Blue arrows and positive standardized coefficients indicate significant positive effects, red arrows and negative standardized coefficients indicate significant negative effects. Dashed arrows indicate predictors that were included and improved the model, but whose specific effects were not statistically significant. Grayed out variables had no significant effect on TE convexity.
Figure 5
Figure 5
Different TE morphotypes in woody plants depend on specific postmortem accumulated lignins for their resistance against collapse. A, Schematic diagram of the three TE types in the xylem of poplar stems, oriented on the pith–cambium axis: primary vessels (PV) in yellow, old secondary vessels (old SV) in purple, and young secondary vessels (young SV) in blue. B, Relative proportion of adjacent TEs for each TE type. Note that the proportion of TEs neighboring other TEs is independent of TE type and very similar to the proportions in Arabidopsis. C, Lumen area of each TE type determined from cross-sections. D, Relative lignin to cellulose ratio measured by Raman microspectroscopy. E, Relative S to G ratio measured by Raman microspectroscopy. F, Relative GCHO to GCHOH ratio measured by Raman microspectroscopy. Because range and intercept of Raman band ratios differ from other biochemical analyses but still maintain a linear relationship (Agarwal, 2019; Blaschek et al., 2020b), references are presented for each lignin parameter using poplar fibers or the interfascicular fibers (IF) of Arabidopsis WT and relevant mutants. Different lowercase letters in panels B–F indicate significant differences according to a Tukey-HSD test (per panel; α = 0.05); n =56–72 individual cells from five plants per TE type. G, Representation of TE perimeter for each TE type in transverse cross-sections from stems of Populus tremula×tremuloides RNAi plants altering lignin biosynthesis. TE outline color indicates the circularity of each respective TE. H–J, Structural equation models of the factors influencing TE convexity and circularity in the PV (H), old SV (I), and young SV (J). Blue arrows and positive standardized coefficients indicate significant positive effects, red arrows and negative standardized coefficients indicate significant negative effects. Dashed arrows indicated predictors that were included and improved the model, but whose specific effects were not statistically significant. Grayed out variables had no significant effect on TE convexity.
Figure 6
Figure 6
Distinct lignin monomers nonredundantly control specific mechanical properties. A, Six-week-old Arabidopsis WT plant with basal, middle, and apical stem segments showing difference in TE developmental stages and marked with the colors representing them in subsequent panels. Wiesner stained cross-sections at the bottom of each segment with close-ups of interfascicular fibers and TEs are shown. B Arabidopsis stem segment undergoing three-point bending. Flexural behavior is presented in Supplemental Movie S1. C and D, Flexural stiffness (C) and sustained elastic deformation before irreversible breaking, i.e. flexibility, (D) of WT stem segments incubated in water, air, or sorbitol determined by three-point bending; n =4–8 stem segments per developmental stage and condition. E, Total lignin, S/G, and terminal GCHO/total GCHOH (measured by Raman microspectroscopy) and total GCHO (measured using the Wiesner test) in PX, MX, and SX TEs of the different genotypes, expressed relative to the WT TEs of the respective morphotype; n =15–50 TEs per genotype. F and G, Flexural stiffness (F) and sustained elastic deformation before irreversible breaking (G) of stem segments from WT, S-depleted fah1, and GCHO-over-accumulating cad4 cad5 mutant plants determined by three-point bending; n =14–30 stem segments per developmental stage and genotype. Different lowercase letters in panels (C–G) indicate significant differences according to a Tukey-HSD test (per panel; α = 0.05). Note that the plants for experiments shown in panels (C, D and F, G) were from different growth instances and slightly different age, explaining the slight differences in absolute stiffness.
Figure 7
Figure 7
Coniferaldehyde-induced flexibility of TE lignin improves plant resistance and/or recovery from extreme Ψ differentials. A Top view of 4- to 5-week-old Arabidopsis WT, S-depleted fah1, GCHO-overaccumulating cad4 cad5, and S-depleted and GCHO-overaccumulating cad4 cad5 fah1 mutant plants after being irrigated with water, 10% PEG6000 or 20% PEG6000 for 3 d. B, Relative change in projected rosette leaf area after 3 d of treatment with water, 10% PEG or 20% PEG, followed by 3 d recovery in water. Different lowercase letters indicate significant differences according to a Tukey-HSD test (per panel; α  =  0.05); n =6 plants per genotype and treatment. C, Evapotranspiration rates (normalized to the projected leaf area right before beginning of treatment) after irrigation with water, 10% PEG or 20% PEG for 3 d. Small gray dots represent individual measurements, larger colored dots represent the average per plant. Different lowercase letters indicate significant differences according to a Tukey-HSD test (per panel; α  =  0.05); n =3–6 plants per genotype and treatment. D, Proportion of plants that did not, partly or fully recover from treatment (with water, 10% PEG or 20% PEG for 3 d) after a 3-d recovery period in water-saturated soil. Different lowercase letters indicate significant differences in the proportions of plants that at least partly recovered according to a Tukey-HSD test (per panel; α  =  0.05); n =12–20 plants per genotype and treatment from two to three independent experiments. E, TE collapse in hypocotyls after PEG treatment and subsequent recovery in water. The distribution and median lines represent all measured TEs, median convexity for each individual plant is indicated by points. Different lowercase letters indicate significant differences between genotypes and treatments according to a Tukey-HSD test (α = 0.05); n = 3 individual plants per genotype and treatment.

Similar articles

Cited by

References

    1. Abraham MJ, Murtola T, Schulz R, Páll S, Smith JC, Hess B, Lindahl E (2015) GROMACS: high performance molecular simulations through multi-level parallelism from laptops to supercomputers. SoftwareX 1–2: 19–25
    1. Agarwal UP (2019) Analysis of cellulose and lignocellulose materials by Raman spectroscopy: a review of the current status. Molecules 24: 1659. - PMC - PubMed
    1. Amrhein N, Frank G, Lemm G, Luhmann HB (1983) Inhibition of lignin formation by L-alpha-aminooxy-beta-phenylpropionic acid, an inhibitor of phenylalanine ammonia-lyase. Eur J Cell Biol 29: 139–144 - PubMed
    1. Barros J, Serk H, Granlund I, Pesquet E (2015) The cell biology of lignification in higher plants. Ann Bot 115: 1053–1074 - PMC - PubMed
    1. Bentrup F-W (2017) Water ascent in trees and lianas: the cohesion-tension theory revisited in the wake of Otto Renner. Protoplasma 254: 627–633 - PMC - PubMed

Grants and funding