

Lipid and protein content profiling of isolated native autophagic vesicles
- PMID: 36215690
- PMCID: PMC9724672
- DOI: 10.15252/embr.202153065
Lipid and protein content profiling of isolated native autophagic vesicles
Abstract
Autophagy is responsible for clearance of an extensive portfolio of cargoes, which are sequestered into vesicles, called autophagosomes, and are delivered to lysosomes for degradation. The pathway is highly dynamic and responsive to several stress conditions. However, the phospholipid composition and protein contents of human autophagosomes under changing autophagy rates are elusive so far. Here, we introduce an antibody-based FACS-mediated approach for the isolation of native autophagic vesicles and ensured the quality of the preparations. Employing quantitative lipidomics, we analyze phospholipids present within human autophagic vesicles purified upon basal autophagy, starvation, and proteasome inhibition. Importantly, besides phosphoglycerides, we identify sphingomyelin within autophagic vesicles and show that the phospholipid composition is unaffected by the different conditions. Employing quantitative proteomics, we obtain cargo profiles of autophagic vesicles isolated upon the different treatment paradigms. Interestingly, starvation shows only subtle effects, while proteasome inhibition results in the enhanced presence of ubiquitin-proteasome pathway factors within autophagic vesicles. Thus, here we present a powerful method for the isolation of native autophagic vesicles, which enabled profound phospholipid and cargo analyses.
Keywords: autophagic vesicles; autophagy; cargo profiling; lipid profiling; vesicle isolation.
© 2022 The Authors. Published under the terms of the CC BY NC ND 4.0 license.
Figures
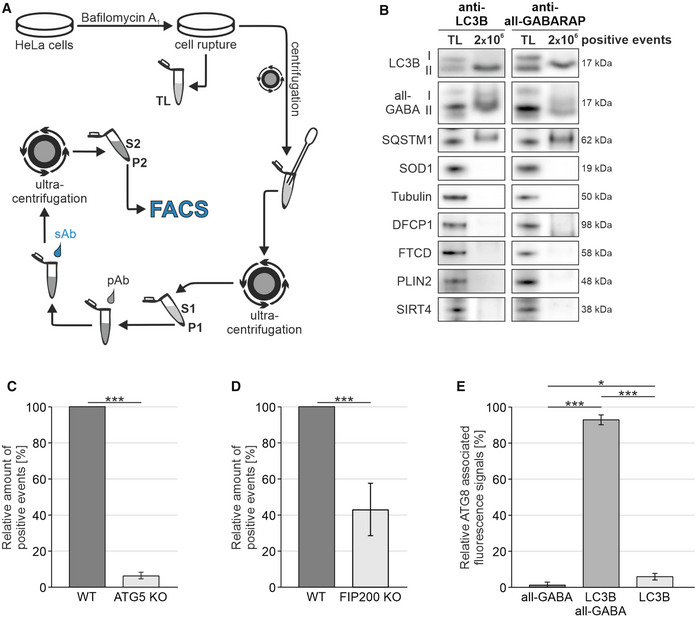
Schematic representation of the antibody‐based FACS‐mediated isolation method. TL, total lysate; P1‐2, pellet fractions; S1‐2, supernatants.
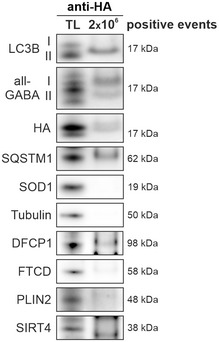
Western blot analysis of purified autophagic vesicles. Isolations were performed using antibodies directed against LC3B or all GABARAP isoforms, respectively, and are represented with total lysate (TL). Depicted are representative blots of 14 independent approaches.
Quantification of fluorophore‐labeled events in WT and ATG5 KO HeLa cells. Shown percentages represent the relative number of detected events in three independent experiments.
Quantification of fluorophore‐labeled events in WT and FIP200 KO MEFs. Shown percentages represent the relative number of detected events in three independent experiments.
Co‐localization of fluorescence signals linked to antibodies directed against LC3B and all GABARAP isoforms. Shown percentages represent the average distribution of three independent experiments, excluding double negative events.
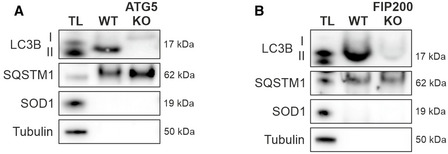
- A, B
Western blot analysis of purified structures from ATG5 KO HeLa cells (A) and FIP200 KO MEFs (B). Isolations were performed with an antibody directed against LC3B and are represented with total lysate (TL). Shown blots are representative for three independent experiments.

Differential interference contrast microscopy images of purified autophagic vesicles at high (I) or low (II) dilution. Images are representative of three independent approaches. Scale bar = 10 μm.
Negative stain electron microscopy images of isolated vesicles. Scale bar = 500 nm.
Size evaluation of isolated vesicles. The diameters of approx. 60 individual vesicles were determined using EM images. Statistics are depicted as mean ± SD.
Western blot analysis of isolated autophagic vesicles upon proteinase K digestion. Mechanically opened vesicles served as positive control. For negative control, isolates were incubated with BSA instead of proteinase K. Depicted are two different blots that are representative for five independent experiments.

Phospholipids identified in isolated autophagic vesicles in comparison with HeLa total lysates. Relative amounts were calculated based on total levels of detected phospholipids. PC, phosphatidylcholine; PE, phosphatidylethanolamine; PI, phosphatidylinositol; PS, phosphatidylserine; PG, phosphatidylglycerol; SM, sphingomyelin.
Distribution of SM within HeLa cells. BODIPY FL C5‐SM (green) was used to localize SM. Nuclei were stained by DAPI. Shown image is representative for 28 slices of three independent experiments. Scale bar = 20 μm.
Immunocytochemical analysis of SM (green) and LC3B (red). DAPI was used to stain nuclei. Shown image is representative for 33 slices from three independent experiments. Pearson's correlation coefficient for co‐localization: 0.44 ± 0.09. Single channels are presented in Appendix Fig S6A. Scale bars = 20 or 2 μm.
Immunocytochemical analysis of SM (green), LC3B (red), and LAMP2 (blue). Shown image is representative for 21 slices of three independent experiments. Single channels are presented in Appendix Fig S6B. Scale bars = 20 or 2 μm.
Phospholipids identified in autophagic vesicles isolated upon different conditions. Relative amounts were calculated based on total levels of detected phospholipids. Abbreviations are depicted in (A).

SM is localized at the trans‐Golgi network. Immunocytochemical analysis of SM (green) and TGN (red). DAPI was used to stain nuclei. Shown images are representative for 27 slices of three independent experiments. Pearson's correlation coefficient for co‐localization: 0.57 ± 0.08. Scale bars: 20 and 2 μm.
SM is localized at lysosomes. Immunocytochemical analysis of SM (green) and LAMP2 (red). Nuclei were stained by DAPI. Shown images are representative for 30 slices of three independent experiments. Pearson's correlation coefficient for co‐localization: 0.62 ± 0.1. Scale bars: 20 and 2 μm.

Western blot analysis of autophagic activity upon different treatments. Cells were treated with EBSS or MG132 for 2 or 8 h, respectively, and DMSO (control) or bafilomycin A1 was added for the last 2 h. LC3B‐II levels were corrected over the loading control tubulin. Shown blots are representative for three independent experiments. Statistics are depicted as mean ± SD; One‐Way ANOVA, *P ≤ 0.05; **P ≤ 0.01.
Immunocytochemical stainings of LC3B (red). Nuclei were stained with DAPI. Shown images are representative for 12 stacks of three independent experiments. Scale bar: 20 μm.

Volcano plot showing the differential appearance of proteins in autophagic vesicles of EBSS‐treated cells in comparison with vesicles isolated under basal autophagy. Log2‐transformed fold changes. For proteins that were excluded from autophagic vesicles upon EBSS treatment or which exclusively appeared within these vesicles, no fold changes could be calculated and they are indicated as not determinable (nd).
Volcano plot showing the differential appearance of proteins in autophagic vesicles of MG132‐treated cells in comparison with vesicles isolated upon basal autophagy. Log2‐transformed fold changes. For proteins that were excluded from autophagic vesicles upon MG132 treatment or which exclusively appeared within these vesicles, no fold changes could be calculated and they are indicated as not determinable (nd).
KEGG pathway analysis of proteins with enhanced localization in autophagic vesicles upon MG132 treatment. Pathways are presented with the number of proteins found in the data set and computed FDRs for enrichment.
KEGG pathway analysis of proteins with reduced appearance in autophagic vesicles upon MG132 treatment. Pathways are presented with the number of proteins found in the data set and computed FDRs for enrichment.

- A, B
String analysis of proteins with enhanced (A) or reduced (B) abundance in autophagic vesicles upon MG132 treatment.
References
-
- Bekbulat F, Schmitt D, Feldmann A, Huesmann H, Eimer S, Juretschke T, Beli P, Behl C, Kern A (2020) RAB18 loss interferes with lipid droplet catabolism and provokes autophagy network adaptations. J Mol Biol 432: 1216–1234 - PubMed
-
- Cox J, Mann M (2008) MaxQuant enables high peptide identification rates, individualized p.p.b.‐range mass accuracies and proteome‐wide protein quantification. Nat Biotechnol 26: 1367–1372 - PubMed
-
- Dengjel J, Hoyer‐Hansen M, Nielsen MO, Eisenberg T, Harder LM, Schandorff S, Farkas T, Kirkegaard T, Becker AC, Schroeder S et al (2012) Identification of autophagosome‐associated proteins and regulators by quantitative proteomic analysis and genetic screens. Mol Cell Proteomics 11: M111.014035 - PMC - PubMed
Publication types
MeSH terms
Substances
LinkOut - more resources
Full Text Sources
Other Literature Sources
