

CBP/p300 and HDAC activities regulate H3K27 acetylation dynamics and zygotic genome activation in mouse preimplantation embryos
- PMID: 36215692
- PMCID: PMC9670200
- DOI: 10.15252/embj.2022112012
CBP/p300 and HDAC activities regulate H3K27 acetylation dynamics and zygotic genome activation in mouse preimplantation embryos
Abstract
Epigenome reprogramming after fertilization enables transcriptionally quiescent maternal and paternal chromatin to acquire a permissive state for subsequent zygotic genome activation (ZGA). H3K27 acetylation (H3K27ac) is a well-established chromatin marker of active enhancers and promoters. However, reprogramming dynamics of H3K27ac during maternal-to-zygotic transition (MZT) in mammalian embryos are not well-studied. By profiling the allelic landscape of H3K27ac during mouse MZT, we show that H3K27ac undergoes three waves of rapid global transitions between oocyte stage and 2-cell stage. Notably, germinal vesicle oocyte and zygote chromatin are globally hyperacetylated, with noncanonical, broad H3K27ac domains that correlate with broad H3K4 trimethylation (H3K4me3) and open chromatin. H3K27ac marks genomic regions primed for activation including ZGA genes, retrotransposons, and active alleles of imprinted genes. We show that CBP/p300 and HDAC activities play important roles in regulating H3K27ac dynamics and are essential for preimplantation development. Specifically, CBP/p300 acetyltransferase broadly deposits H3K27ac in zygotes to induce the opening of condensed chromatin at putative enhancers and ensure proper ZGA. On the contrary, HDACs revert broad H3K27ac domains to canonical domains and safeguard ZGA by preventing premature expression of developmental genes. In conclusion, coordinated activities of CBP/p300 and HDACs during mouse MZT are essential for ZGA and preimplantation development.
Keywords: CBP/p300; H3K27ac; HDACs; MZT; ZGA.
© 2022 The Authors. Published under the terms of the CC BY 4.0 license.
Figures
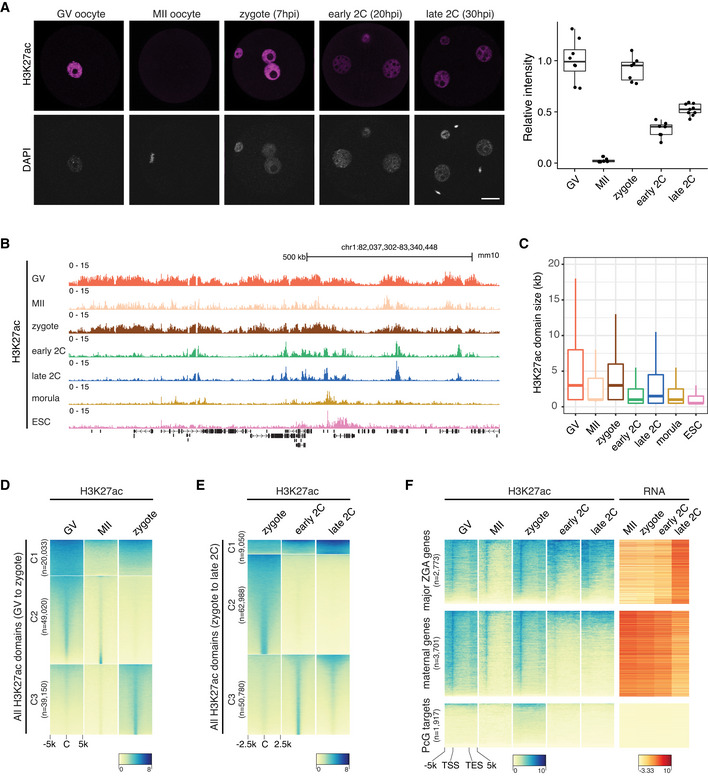
Immunostaining of H3K27ac in mouse germinal vesicle (GV) oocytes (n = 8), metaphase II (MII) oocytes (n = 7), zygotes (n = 7), early 2‐cell (2C; n = 7) and late 2C (n = 9) embryos. Right panel is the quantification of H3K27ac immunostaining relative signal intensities at different stages. Scale bar: 20 μm.
Genome browser view showing the landscape of H3K27ac in oocytes and early embryos.
H3K27ac domain size distribution at different stages.
Dynamic changes of H3K27ac from GV oocytes to zygotes. All the H3K27ac domains from GV to zygote were classified into three clusters (C1–C3) using k‐means clustering. C—domain center.
Dynamic changes of H3K27ac from zygotes (before ZGA) to late 2‐cell embryos (major ZGA). All the H3K27ac domains from zygotes to late 2‐cell embryos were classified into three clusters (C1–C3) using k‐means clustering.
Enrichment of H3K27ac at major ZGA genes, maternal decay genes and Polycomb group (PcG) targets at different stages. TSS—transcription start site; TES—transcription end site.
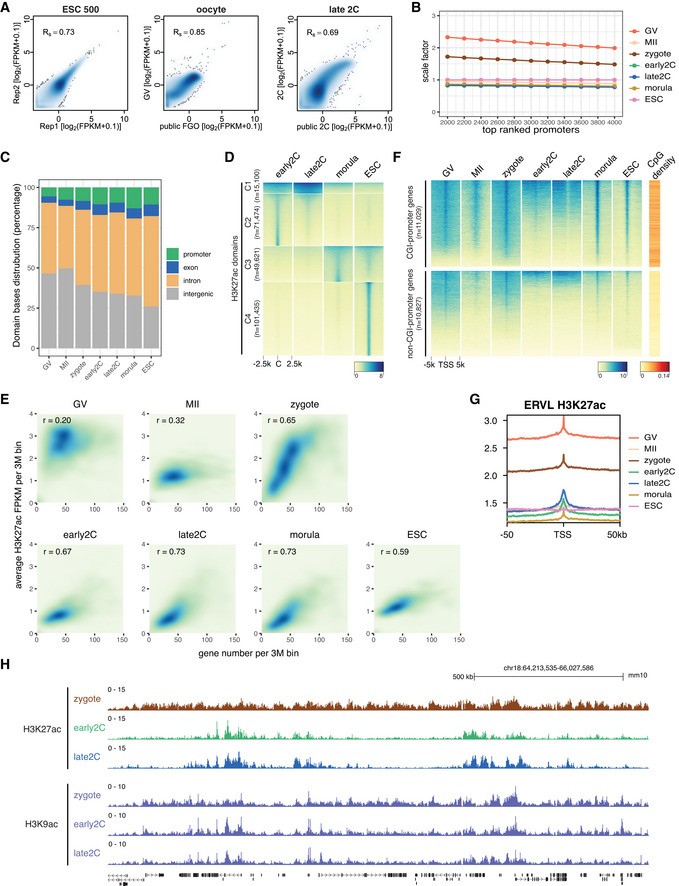
Spearman correlation of H3K27ac CUT&RUN replicates and correlation with available public data. The public H3K27ac data were generated using the μChIP–seq method (Dahl et al, 2016). GV—germinal vesicle oocyte; FGO—fully grown oocyte; 2C—2‐cell embryo.
Scale factors for H3K27ac FPKM at different stages. The scale factors at top 3,000 promoters were used.
H3K27ac domain bases distribution at promoter, exon, intron, and intergenic regions for each stage.
Dynamic changes of H3K27ac from early 2‐cell to morula stage and ESC. C: domain center.
Correlations between gene density and H3K27ac signals for each stage.
H3K27ac signal enrichment around TSS of genes with CGI or non‐CGI promoters. CGI: CpG island.
Enrichment of H3K27ac at ERVL retrotransposons at different stages.
Genome browser view showing different dynamics of H3K27ac and H3K9ac from zygotes to late 2‐cell embryos.
- A
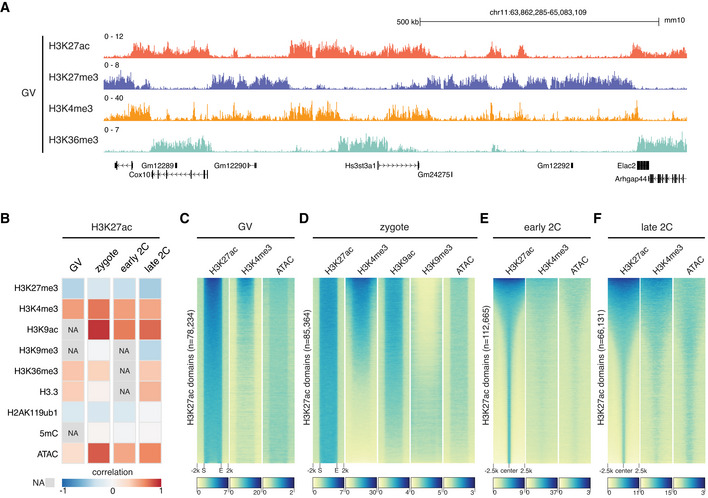
Genome browser view of H3K27ac and other histone modifications signals in GV oocytes.
- B
Global spearman correlations of H3K27ac with other epigenetic markers at different stages. NA—data not available. Bin size: 5 kb.
- C, D
Heatmap showing other epigenetic marker signals at H3K27ac domains in GV oocytes (C) and zygotes (D). S—domain start position; E—domain end position.
- E, F
Heatmap showing the enrichment of H3K4me3 and open chromatin (ATAC) around H3K27ac domain centers in early 2‐cell (E) and late 2‐cell embryos (F).
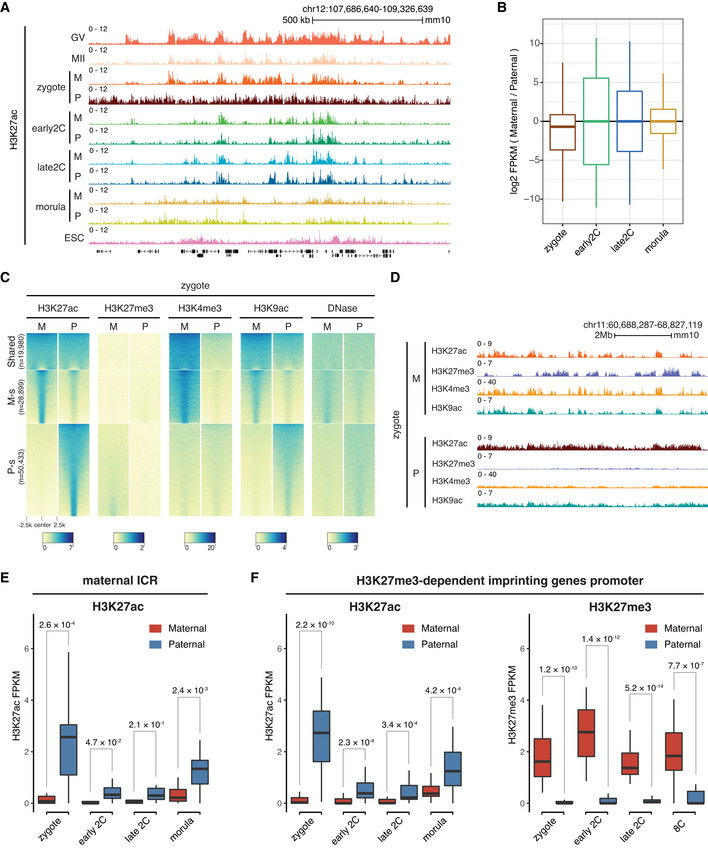
Genome browser snapshot showing the allele‐specific landscape of H3K27ac in early embryos. M—maternal allele; P—paternal allele.
Boxplot showing the allelic bias of H3K27ac between maternal allele and paternal allele at different stages. Bin size: 1 kb.
Allele‐specific distributions of H3K27ac and other epigenetic markers in zygotes. Each row is a zygotic H3K27ac domain. The H3K27ac domains were classified into three groups using k‐means clustering: Shared—common H3K27ac domains for both maternal and paternal alleles in zygotes; M‐s—maternal allele‐specific H3K27ac domains; P‐s—paternal allele‐specific H3K27ac domains.
Genome browser view showing the allelic landscape of H3K27ac and other histone modifications in zygotes.
Comparison of H3K27ac signals at maternal imprinting control regions (ICR, n = 17) between the maternal allele and paternal allele at different stages. The P‐values were derived from one‐sided t‐test. The list of maternal ICRs were retrieved from (Xie et al, 2012).
Comparison of H3K27ac signals at H3K27me3‐dependent imprinted gene promoters (n = 27, ± 2 kb of TSS) between the maternal allele and paternal allele at different stages. The P‐values were derived from one‐sided t‐test. The list of H3K27me3 imprinted genes were from Liu et al (2020).
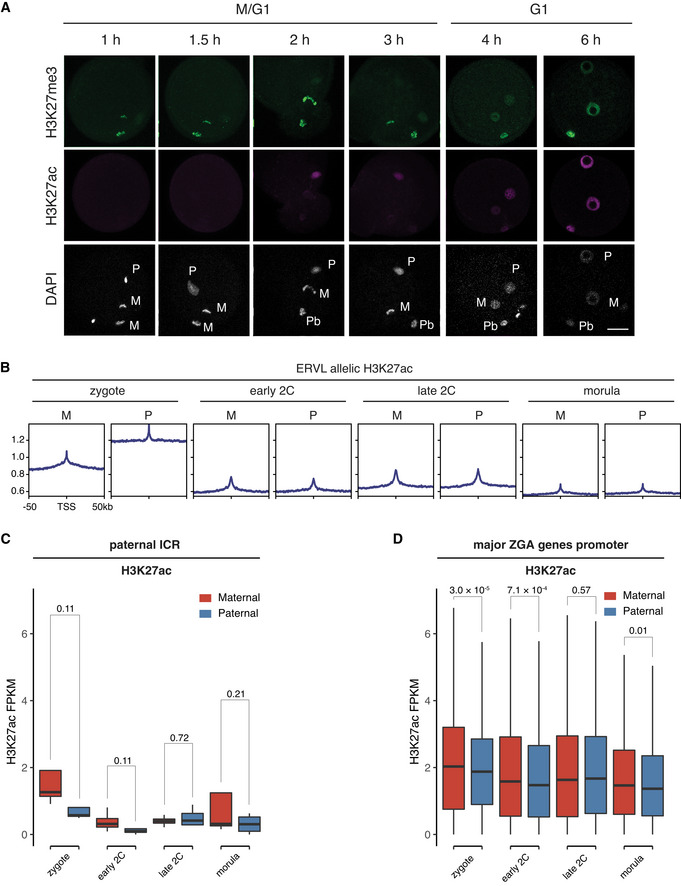
Immunostaining images of fertilized 1‐cell embryos stained with anti‐H3K27me3 and anti‐H3K27ac at indicated time points post fertilization. M—maternal DNA; P—paternal DNA; Pb—polar body. Scale bar: 20 μm.
Allele‐specific enrichment of H3K27ac signals at ERVL retrotransposons at different stages. M—maternal allele; P—paternal allele.
Comparison of H3K27ac signals at paternal imprinting control regions (ICR, n = 4) between the maternal allele and paternal allele at different stages. The P‐values were derived from one‐sided t‐test. The list of paternal ICRs were retrieved from (Xie et al, 2012).
Comparison of H3K27ac signals at major ZGA genes promoters (n = 2,773, ± 2 kb of TSS) between the maternal allele and paternal allele at different stages. The P‐values were derived from two‐sided t‐test.
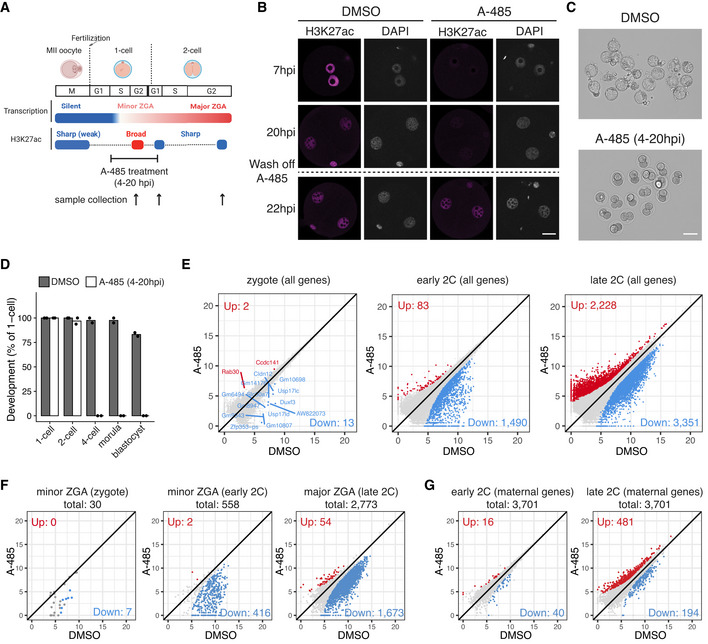
Schematic illustration of transient CBP/p300 inhibition from zygote to early 2‐cell with A‐485. The cell cycle stages were based on (Abe et al, 2018). The arrows indicate the time points of sample collection for RNA‐seq.
Immunostaining of H3K27ac in A‐485‐treated embryos versus control (DMSO‐treated) at different time points. Scale bar: 20 μm.
Images of embryos treated with DMSO (control) and A‐485 at 96 hpi. Scale bar: 80 μm.
Developmental rate of embryos treated with A‐485 versus control.
Scatter plots showing the whole transcriptome changes in zygotes, early 2‐cell, and late 2‐cell embryos after CBP/p300 inhibition.
Scatter plots showing the expression level changes of zygote minor ZGA genes (n = 30), early 2‐cell minor ZGA genes (n = 558), and major ZGA genes (n = 2,773) after CBP/p300 inhibition.
Scatter plot showing the expression level changes of maternal decay genes (n = 3,701) in early 2‐cell and late 2‐cell embryos after CBP/p300 inhibition.
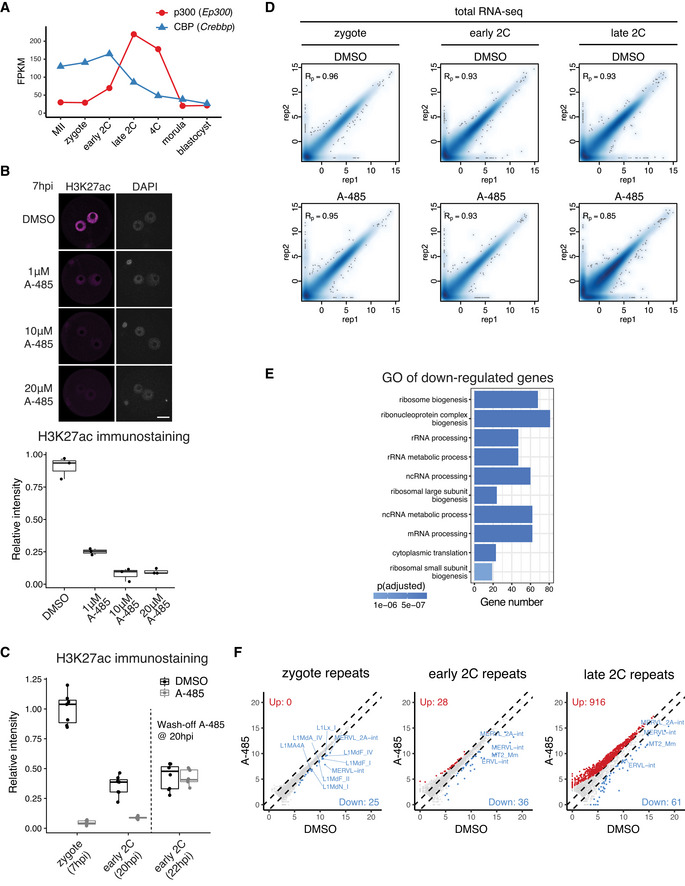
Expression level dynamics of Ep300 (p300) and Crebbp (CBP) in MII oocyte and preimplantation embryos.
Determination of optimal A‐485 concentration to inhibit CBP/p300 by H3K27ac immunostaining. The embryos (3 biological replicates in each condition) were treated with A‐485 starting at 4 hpi, and images were taken at 7 hpi. Scale bar: 20 μm.
Immunostaining quantification of H3K27ac relative intensities in Fig 4B (6–12 biological replicates in each condition).
Pearson correlation of RNA‐seq replicates at zygote, early 2‐cell, and late 2‐cell stage for control (DMSO‐treated) and CBP/p300 inhibition (A‐485‐treated).
Gene Ontology (GO) enrichment for the down‐regulated genes at early 2‐cell stage after A‐485 treatment.
Scatter plot showing the expression level changes of repeat elements after CBP/p300 inhibition.
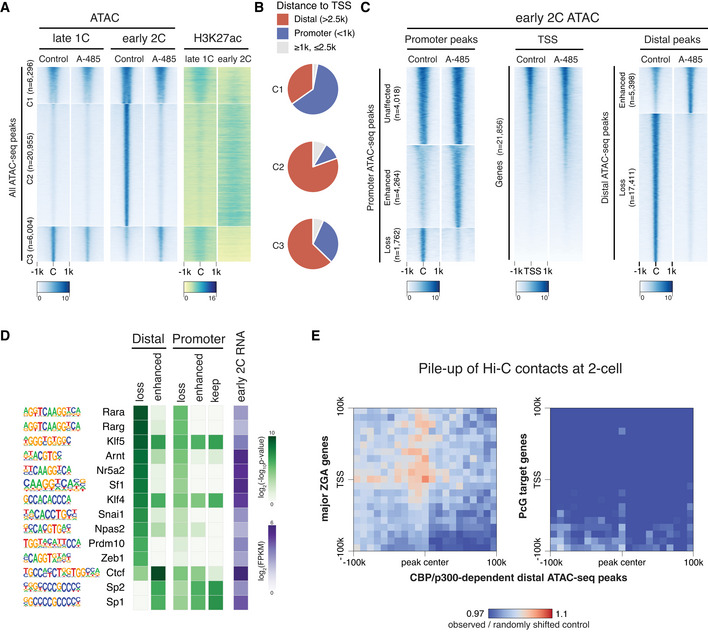
Heatmap showing ATAC‐seq signals at late 1‐cell and early 2‐cell under control and A‐485‐treated conditions, and the corresponding H3K27ac signals at these ATAC‐seq peaks. All the ATAC‐seq peaks were classified into three groups based on the changes from late 1‐cell to early 2‐cell in control condition. C1—keep open from late 1‐cell to early 2‐cell; C2—newly opened at early 2‐cell; C3—reduced opening at early 2‐cell.
Ratio of distal ATAC‐seq peaks (>2.5 kb to TSS) and promoter ATAC‐seq peaks (<1 kb to TSS) in group C1‐3 of panel A.
Heatmap showing the impact of CBP/p300 inhibition on chromatin openness of different regions (promoter, TSS and distal regions) at early 2‐cell stage.
Transcription factor (TF) motif enrichment at distal and promoter ATAC‐seq peaks with different responses to CBP/p300 inhibition. Only TFs with expression level of FPKM≥5 at early 2‐cell stage were considered.
Pile‐up of Hi‐C contacts at 2‐cell stage between CBP/p300‐dependent distal ATAC‐seq peaks (x‐axis) and major ZGA genes TSS regions (y‐axis, left panel). The same analysis was also performed between CBP/p300‐dependent distal ATAC‐seq peaks and PcG target genes TSS (right panel) as a control.
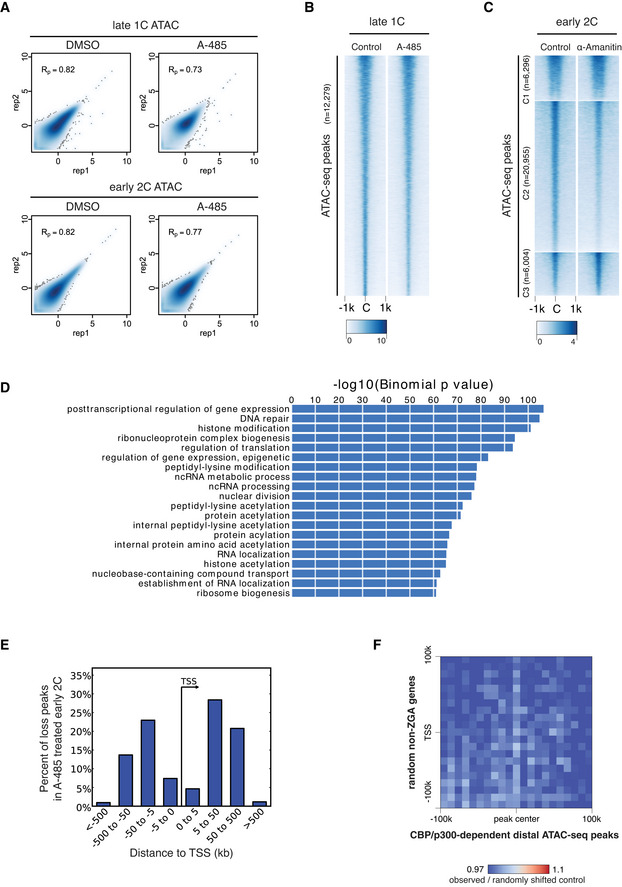
Pearson correlation of ATAC‐seq replicates for DMSO‐treated and A‐485‐treated late 1‐cell and early 2‐cell.
ATAC‐seq signal comparison for control and A‐485‐treated late 1‐cell. C—peak center.
ATAC‐seq signal comparison for control and minor ZGA inhibition (treated with α‐Amanitin) at early 2‐cell stage. The ATAC‐seq peaks were the same as in Fig 5A. The ATAC‐seq data of control early 2‐cell and α‐Amanitin‐treated early 2‐cell were from GEO with accession GSM1933921, GSM1933922, GSM1933923, and GSM2108702 (Wu et al, 2016).
Gene Ontology (GO) enrichment for the nearest genes of the ATAC‐seq peaks that were lost under A‐485 treatment in early 2‐cell, using GREAT analysis (McLean et al, 2010).
Distance to TSS for the ATAC‐seq peaks that were lost after A‐485 treatment in early 2‐cell embryos.
Pile‐up of Hi‐C contacts at 2‐cell stage between CBP/p300‐dependent distal ATAC‐seq peaks (x‐axis) and randomly selected non‐ZGA genes TSS regions (n = 2,773, matched chromosome distribution with major ZGA genes).
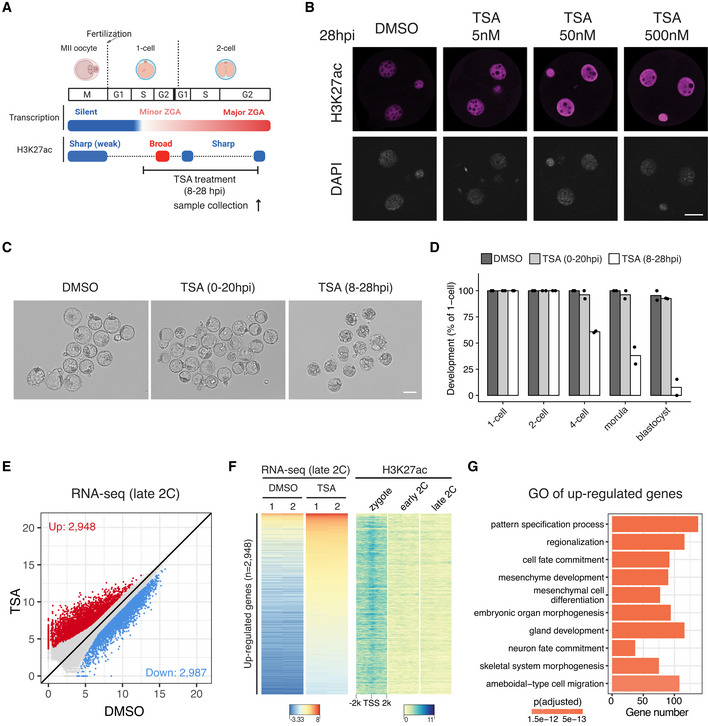
Schematic illustration of HDAC inhibition from zygotes to late 2‐cell embryos with TSA (Trichostatin A). The cell cycle stages were based on (Abe et al, 2018). The arrow indicates the time point of sample collection for RNA‐seq.
Immunostaining of H3K27ac in TSA‐treated embryos under different concentrations versus control (DMSO‐treated) at 28 hpi. Scale bar: 20 μm.
Images of embryos treated with DMSO (control) or TSA at 96 hpi. Scale bar: 80 μm.
Developmental rate of embryos treated with TSA at different time points (0–20 hpi and 8–28 hpi) versus control.
Late 2‐cell embryo whole transcriptome comparison between HDAC inhibition (TSA‐treated) and control (DMSO‐treated).
Heatmap showing the up‐regulated genes after TSA treatment at late 2‐cell stage and the corresponding H3K27ac dynamics at the promoter of these up‐regulated genes.
Gene Ontology (GO) enrichment analysis of the up‐regulated genes after HDAC inhibition.
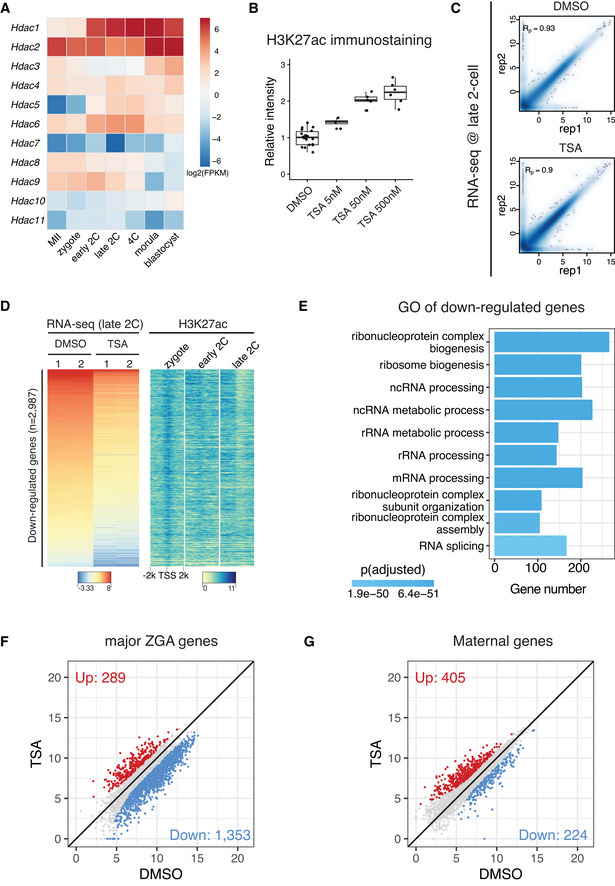
Expression dynamics of HDAC genes in mouse MII oocyte and preimplantation embryos.
Immunostaining quantification of H3K27ac relative intensities in Fig 6B (4–16 biological replicates in each condition).
Pearson correlation of RNA‐seq replicates at late 2‐cell stage for control (DMSO‐treated) and HDAC inhibition (TSA‐treated).
Heatmap showing the down‐regulated genes after TSA treatment in late 2‐cell embryos and the corresponding H3K27ac dynamics at the promoters of these down‐regulated genes.
Gene Ontology (GO) enrichment analysis of the down‐regulated genes after HDAC inhibition.
Scatter plot showing the impact of HDAC inhibition on expression levels of major ZGA genes.
Scatter plot showing the impact of HDAC inhibition on expression levels of maternal decay genes.
References
-
- Brind'Amour J, Liu S, Hudson M, Chen C, Karimi MM, Lorincz MC (2015) An ultra‐low‐input native ChIP‐seq protocol for genome‐wide profiling of rare cell populations. Nat Commun 6: 6033 - PubMed
Publication types
MeSH terms
Substances
Associated data
- Actions
Grants and funding
LinkOut - more resources
Full Text Sources
Molecular Biology Databases
Miscellaneous
