Erythropoietin signaling in peripheral macrophages is required for systemic β-amyloid clearance
- PMID: 36215698
- PMCID: PMC9670197
- DOI: 10.15252/embj.2022111038
Erythropoietin signaling in peripheral macrophages is required for systemic β-amyloid clearance
Abstract
Impaired clearance of beta-amyloid (Aβ) is a primary cause of sporadic Alzheimer's disease (AD). Aβ clearance in the periphery contributes to reducing brain Aβ levels and preventing Alzheimer's disease pathogenesis. We show here that erythropoietin (EPO) increases phagocytic activity, levels of Aβ-degrading enzymes, and Aβ clearance in peripheral macrophages via PPARγ. Erythropoietin is also shown to suppress Aβ-induced inflammatory responses. Deletion of EPO receptor in peripheral macrophages leads to increased peripheral and brain Aβ levels and exacerbates Alzheimer's-associated brain pathologies and behavioral deficits in AD-model mice. Moreover, erythropoietin signaling is impaired in peripheral macrophages of old AD-model mice. Exogenous erythropoietin normalizes impaired EPO signaling and dysregulated functions of peripheral macrophages in old AD-model mice, promotes systemic Aβ clearance, and alleviates disease progression. Erythropoietin treatment may represent a potential therapeutic approach for Alzheimer's disease.
Keywords: Alzheimer's disease; erythropoietin signaling; peripheral macrophages; systemic Aβ clearance.
© 2022 The Authors.
Figures

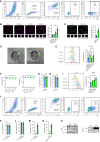
- A, B
Peritoneal macrophages (PMs) were treated with Aβ42 (0.5–5 μM) for 12 h, phagocytosis of Aβ42 (A) and Aβ40 (B) was measured by flow cytometry (n = 4). Vehicle (cold) was macrophage treated with Aβ resolution incubated at 4°C. It was used as a negative control to exclude Aβ bound with macrophage from Aβ engulfment. Vehicle was macrophage treated with Aβ resolution incubated at 37°C as control.
- C, D
WT mice (8 weeks) were treated with Aβ42 (0.2 μmol/kg/day, i.v., twice per day) for 24 h, splenic macrophages were purified for phagocytosis assay of Aβ42 (C) and Aβ40 (D) (n = 4).
- E
Splenic macrophages from young APP/PS1‐21 mice (6‐week‐old) were isolated for phagocytosis assay of Aβ42 (n = 4).
- F–H
Macrophages from (A–E) were detected by immunoblotting with the indicated antibodies (n = 3).
- I
PMs from Lyz2‐Cre +/+ /Epor loxp/loxp mice (EPOR‐MKO) or Lyz2‐Cre +/+ /Epor +/+ mice (EPOR‐C) were treated with Aβ42 (5 μM) or vehicle for 12 h. Phagocytosis of Aβ42 was measured by flow cytometry (n = 4).
- J
EPOR‐MKO mice (8 weeks) were treated with Aβ42 (0.2 μmol/kg/day, i.v.) for 24 h, splenic macrophages were used for phagocytosis assay of Aβ42 (n = 4).
- A
A series of figures show the gating strategy of flow cytometry analysis used to identify PMs that engulfed HiLyte‐488‐labeled Aβ42 in vitro.
- B, C
PMs were treated with Aβ42 of indicated concentration for 12 h, and then incubated with HiLyte‐488‐labeled Aβ42 (B) or HiLyte‐555‐labeled Aβ42 (C) for 1 h after being washed for three times. Phagocytosis of Aβ42 was detected by confocal microscopy (n = 6).
- D
A series of representative images from a live‐cell video microscopy experiment were showed. Phagocytosis of fluorescently labeled Aβ42 by primary macrophage was depicted using phase contrast images overlaid with fluorescence microscopy images. Yellow arrowheads indicate Aβ42 (n = 4).
- E
PMs were treated with Aβ42 (5 μM) for 12 h, then with LA (200 nM) (phagocytosis inhibitor) or Dynasore (0.1 μM) (endocytosis inhibitor) for another hour and were applied for Aβ phagocytosis assay by flow cytometry (n = 4).
- F
Number and viability of macrophages from Fig 1A were analyzed by CCK8 assay (n = 7).
- G, H
PMs were treated with Aβ40 (5 μM) for 12 h and then phagocytosis of HiLyte‐Aβ42 (G) or HiLyte‐Aβ40 (H) was measured by flow cytometry (n = 4).
- I
Bone marrow‐derived macrophages (BMDMs) were treated with Aβ42 (0.5–5 μM) for 12 h, and applied for HiLyte‐Aβ42 phagocytosis assay (n = 4).
- J
Gating of splenic macrophages was set, and macrophages were confirmed as F4/80+CD11b+.
- K, L
Splenic macrophages from WT mice (8 weeks) treated with Aβ40 (0.2 μmol/kg/day, i.v. for 1 day) were purified for phagocytosis assays of Aβ42 (K) and Aβ40 (L) (n = 4).
- M, N
Spleen levels of Aβ42 were measured by ELISA for following groups: WT mice (8 weeks) treated with Aβ40 (0.2 μmol/kg/day, i.v.) or vehicle for 24 h (M) (n = 4); APP/PS1‐21 mice or WT mice of 6‐week‐old age (N) (n = 7).
- O
Co‐immunoprecipitation of EPOR and Aβ shows no direct binding of Aβ to EPOR. IgG was used as negative control for this assay (n = 4).

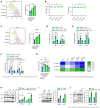
- A
PMs treated with EPO of indicated concentration were measured by flow cytometry (n = 4). Vehicle (cold) was macrophage treated with PBS incubated at 4°C. It was used as a negative control to exclude Aβ bound with macrophage from Aβ engulfment. Vehicle was macrophage treated with PBS incubated at 37°C as control.
- B
PMs from Lyz2‐Cre +/+ /Epor loxp/loxp mice (EPOR‐MKO) or Lyz2‐Cre +/+ /Epor +/+ mice (EPOR‐C) were treated with PBS (Vehicle) or rhEPO for 12 h and then applied for Aβ phagocytosis assay.
- C–F
F4/80+CD11b+ splenic macrophages from PBS (Vehicle) or rhEPO (10,000 IU/kg/day, i.p., twice per day for 1 day) treated EPOR‐C mice (C), or EPOR‐MKO mice (D), or from rhEPO (5,000 IU/kg, i.p., every second day for 5 days) treated APP/PS1‐21 mice (5 months) (E), or from APP/PS1‐21+EPOR‐MKO mice (APP/PS‐1‐21 +/+ /Lyz2‐Cre +/+ /Epor loxp/loxp , 5 months) (F) were purified for Aβ42 phagocytosis assay (n = 4).
- G, H
PMs from (A, B) were treated with PBS (Vehicle) or rhEPO for 12 h, then with Aβ42 (5 μM) for another 12 h and applied for detection of inflammatory factor expression by QPCR (n = 4).
- I–K
Macrophages from (C–F) were applied for detection of inflammatory factor expression by QPCR (n = 4). Vehicle (H, I) is Aβ resolution and Vehicle (J) is PBS.
- A
PMs were treated with rhEPO (10–100 IU) for 12 h, and applied for Aβ40 phagocytosis assay (n = 4).
- B
Number and viability of macrophages from (A) were analyzed by CCK8 assay (n = 7).
- C
BMDM was treated with rhEPO (10–100 IU) for 12 h and applied for Aβ42 phagocytosis assay (n = 4).
- D–F
The mRNA levels of IDE and NEP of indicated macrophages from Fig 2H–K were measured by QPCR (n = 4).
- G
Supernatants of macrophages from Fig 2G were collected. Levels of NO were normalized to supernatants of cell cultures treated with vehicle. Levels of inflammatory factors were measured by ELISA (n = 4).
- H
Macrophage lysate from Fig 1F were detected by immunoblotting with the antibodies against PPARγ or SRA (n = 3).
- I
Cell lysates from Fig 1G were detected by immunoblotting with the antibodies against PPARγ or SRA (n = 3).
- J
Cell lysates from Fig 1H were detected by immunoblotting with the antibodies against PPARγ or SRA (n = 3).
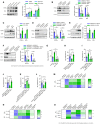
- A–F
Macrophages from Fig 2A–F were detected by immunoblotting with indicated antibodies (n = 3).
- G
PMs from Lyz2‐Cre +/+ /Epor +/+ mice (EPOR‐C) were pretreated with PPARγ antagonist GW9662 (10 μM, 12 h), then with rhEPO (100 IU, 12 h), and then applied for phagocytosis assay of Aβ42 (n = 3).
- H
PMs from Lyz2‐Cre +/+ /Epor loxp/loxp mice (EPOR‐MKO) or from EPOR‐C mice were pretreated with PPARγ agonist RSG (50 μM, 12 h), and then applied for phagocytosis of Aβ42 by flow cytometry (n = 4).
- I–L
Splenic macrophages from EPOR‐C mice treated with GW9662 (1 mg/kg/day, i.p.) or/and rhEPO (10,000 IU/kg/day, i.p.) twice per day for 1 day (I), from EPOR‐MKO mice treated with RSG (0.1 mg/kg/day, i.p.) for 24 h (J), from APP/PS1‐21 mice treated with GW9662 (1 mg/kg, i.p., every second day) and/or EPO (10,000 IU/kg, i.p., every second day) for 5 days (K), or from APP/PS1‐21 +/+ /Lyz2‐Cre +/+ /Epor loxp/loxp mice (APP/PS1‐21+EPOR‐MKO) treated with RSG (0.1 mg/kg, i.p., every second day) for 5 day (L), were purified for Aβ42 phagocytosis assay (n = 4).
- M–O
Macrophages from (G–L) were applied for detection of inflammatory factor expression by QPCR (n = 4).
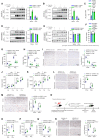
- A–F
Flag‐Aβ42 was injected into the lateral ventricles of Lyz2‐Cre +/+ /Epor loxp/loxp mice (EPOR‐MKO) or Lyz2‐Cre +/+ /Epor +/+ mice (EPOR‐C) (8 weeks) mice pretreated with rhEPO (10,000 IU/kg/day, i.p.) or ARA290 (0.03 mg/kg/day, i.p.) for 2 days (twice per day) (n = 3). One day later, Flag‐Aβ42 in spleens and brains was detected by immunoblotting (A, B, D, E). Aβ42 levels of spleen were measured by ELISA (C, F).
- G–I
Proteins were extracted from spleens and brains of APP/PS1‐21 mice (5 months) treated with rhEPO (10,000 IU/kg/day) or ARA290 (0.03 mg/kg/day) (i.p., once a day, for 14 days) (n = 10), and soluble Aβ levels were measured by ELISA (n = 5) (G, H). Aβ plaques in cortex and hippocampus (n = 5) were detected by IHC (I).
- J–M
Proteins were extracted from spleens and brains of 5‐ or 11‐month‐old APP/PS‐1‐21 +/+ /Lyz2‐Cre +/+ /Epor loxp/loxp mice (APP/PS1‐21+EPOR‐MKO) or APP/PS‐1‐21 +/+ /Lyz2‐Cre +/+ /Epor +/+ mice (APP/PS1‐21+EPOR‐C), and soluble Aβ levels were measured by ELISA (n = 5) (J, K). Aβ plaques in the cortex and hippocampus of mice of 5‐ (L) or 11‐month‐old (M) (n = 5) were detected by IHC.
- N
Timeline of bone marrow transplantation experiment.
- O
Splenic macrophages from APP/PS1‐21 mice transplanted with EPOR‐C or EPOR‐MKO bone marrow were purified for Aβ phagocytosis assay (n = 4).
- P, Q
Soluble Aβ levels of spleens and brains were measured by ELISA (n = 4).
- R
Aβ plaques in the cortex and hippocampus (n = 4) were detected by IHC.

Timeline of Flag‐Aβ42 injection (i.c.v.) of mice treated with EPO or ARA290.
Expression of Iba1 and Aβ in cortex and hippocampus was detected by IF staining and statistically quantified (n = 5).
Blood was taken from APP/PS1‐21 mice of Fig 4G and plasma Aβ levels were measured by ELISA (n = 5).
Genotype of APP/PS‐1‐21+/+/Lyz2‐Cre +/+/Epor loxp/loxp mice (APP/PS1‐21+EPOR‐MKO) was identified by genotyping assay. Mice with APP/PS1‐21 (yellow arrows), EPOR‐Flox (red arrows) and Cre (blue arrows) were APP/PS1‐21+EPOR‐MKO mice.
Splenic macrophages were isolated from mice of Fig 4L, and protein levels of EPOR were detected by immunoblotting (n = 3).
The expression of EPOR in splenic macrophages from mice of Fig 4L was measured by QPCR (n = 6).
The percentages of macrophage among splenic cells from mice of Fig 4L were measured by flow cytometry (n = 4).
Expression of EPOR or Iba1 in cortex and hippocampus from mice of Fig 4L was detected by IF staining (n = 5). The EPOR+Iba1+ microglia were pointed with white arrows.
Blood was taken from APP/PS1‐21 mice of Fig 4J and plasma Aβ levels were measured by ELISA (n = 5).
Macrophages from Fig 4N were detected by immunoblotting with indicated antibodies (n = 3).
Expression of EPOR or Iba1 in cortex and hippocampus taken from mice of Fig 4N was detected by IF staining (n = 4).
Blood was taken from mice of Fig 4N and plasma Aβ levels were determined by ELISA (n = 5).
Spleens were taken from mice of Fig 4N and protein levels of Aβ were detected by immunoblotting with indicated antibody (n = 3).
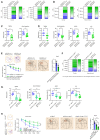
- A, B
Cortex and hippocampus taken from Fig 4L and M (n = 5) were applied for detection of inflammatory factor expression.
- C–E
Non‐cognitive behavioral impairments of APP/PS1‐21 mice (5 months) in Fig 4L were analyzed by nest construction assay and social interaction assay (C) (n = 10). Both non‐cognitive and cognitive behavioral impairments of APP/PS1‐21 mice (11 months) in Fig 4M were analyzed by nest construction assay, social interaction assay, NORT, FCT and Morris water maze test (D, E) (n = 10).
- F
Cortex and hippocampus were taken from APP/PS1‐21 mice in Fig 4N (n = 6) and applied for detection of inflammatory factor expression.
- G, H
Behavioral impairments APP/PS1‐21 of mice in Fig 4N and WT‐BMEPOR‐C mice (irradiated WT mice transplanted with EPOR‐C bone marrow cells) were analyzed by nest construction assay, social interaction assay, NORT, FCT and Morris water maze test (n = 8).
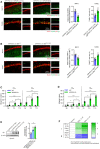
- A
Hippocampi were taken from mice of Fig 5B. Expression of MAP‐2 (in CA1 regions) and the apoptotic neurons were detected by IF staining and statistically quantified, respectively (n = 5).
- B
Hippocampi were taken from mice of Fig 5F. Expression of indicated proteins were detected by IF staining and statistically quantified (n = 5).
- C–E
Blood (C) and spleens (D, E) were taken from mice of Fig 6F (n = 6), and concentrations of Aβ in plasma and spleens were measured by ELISA (n = 6) (C and D). Spleen Aβ levels of APP/PS1‐21 mice at different ages were also detected by immunoblotting (n = 3) (E).
- F
PMs were treated with Aβ42 (0, 5 or 10 μM) for 12 h, and applied for detection of inflammatory factor levels by QPCR (n = 5).
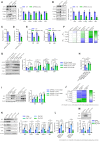
- A–E
Splenic macrophages from APP/PS1‐21 (5‐ or 11‐month‐old) or matched WT mice were detected by immunoblotting with the indicated antibodies (n = 3) (A, B). Their phagocytosis of Aβ42 (C, D) were measured by flow cytometry (n = 4). The mRNA levels of IDE and NEP were measured by QPCR (n = 4) (E).
- F
Splenic macrophages from APP/PS1‐21 mice at different ages were purified for detection of inflammatory factor expression (n = 6).
- G–J
Old APP/PS1‐21 mice (11 months) and WT mice at the same age were treated with rhEPO (10,000 IU/kg/day), ARA290 (0.03 mg/kg/day) or vehicle (i.p., once a day, for 14 days). Splenic macrophages were isolated for detection by immunoblotting with the indicated antibodies (n = 3) (G). Phagocytosis of Aβ42 by the splenic macrophages was measured by flow cytometry (n = 4) (H). Protein levels of IDE and NEP were detected by immunoblotting with indicated antibodies (n = 3) (I). The mRNA levels of inflammatory factors were measured by QPCR (n = 5) (J).
- K–M
PMs were treated with Aβ42 (0, 5, 7.5 or 10 μM) for 12 h, and cell lysates were detected by immunoblotting with the indicated antibodies (n = 3) (K). Phagocytosis of Aβ42 and Aβ40 was measured by flow cytometry (n = 4) (L). Protein levels of IDE and NEP were detected by immunoblotting with indicated antibodies (n = 3) (M).

- A
Timeline of rhEPO (10,000 IU/kg/day) or ARA290 (0.03 mg/kg/day) treatments of old APP/PS1‐21 mice (11 months) (n = 5).
- B
Plasma Aβ levels were measured by ELISA (n = 5).
- C, D
Soluble Aβ levels in spleens (C) and brains (D) were measured by ELISA (n = 5).
- E
Aβ plaques in the cortex and hippocampus (n = 5) were detected by IHC.
- F
Cortex and hippocampus were taken, and the mRNA levels of inflammatory factors were measured by QPCR (n = 5).
- G
Expression of MAP‐2 or the apoptotic neurons of hippocampus were detected by IF staining and then statistically quantified (n = 5).
- H, I
Both non‐cognitive and cognitive behavioral impairments were analyzed by nest construction assay, social interaction assay, NORT, FCT and Morris water maze test (n = 10).
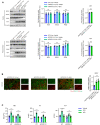
Levels of indicated protein from mice of Fig 7G were detected by immunoblotting and statistically quantified (n = 3).
Expression of MAP‐2 or NeuN in cortex from mice of Fig 7G was detected by IF staining and statistically quantified (n = 5).
APP/PS1‐21 (11 months) and WT mice at the same age were treated with rhEPO (10,000 IU/kg/day, i.p.) or ARA290 (0.03 mg/kg/day, i.p.) (once daily for 14 days). Blood was taken and hematopoietic function were analyzed by RBC, Hb and HCT assays (n = 8).
References
-
- Baik SH, Kang S, Lee W, Choi H, Chung S, Kim JI, Mook‐Jung I (2019) A breakdown in metabolic reprogramming causes microglia dysfunction in Alzheimer's disease. Cell Metab 30: 493–507 - PubMed
Publication types
MeSH terms
Substances
LinkOut - more resources
Full Text Sources
Medical
Research Materials

