. 2022 Nov:290:121828.
doi: 10.1016/j.biomaterials.2022.121828. Epub 2022 Oct 3.

Extended longevity geometrically-inverted proximal tubule organoids

Affiliations

Extended longevity geometrically-inverted proximal tubule organoids

Eric Parigoris et al. Biomaterials. 2022 Nov.

Abstract

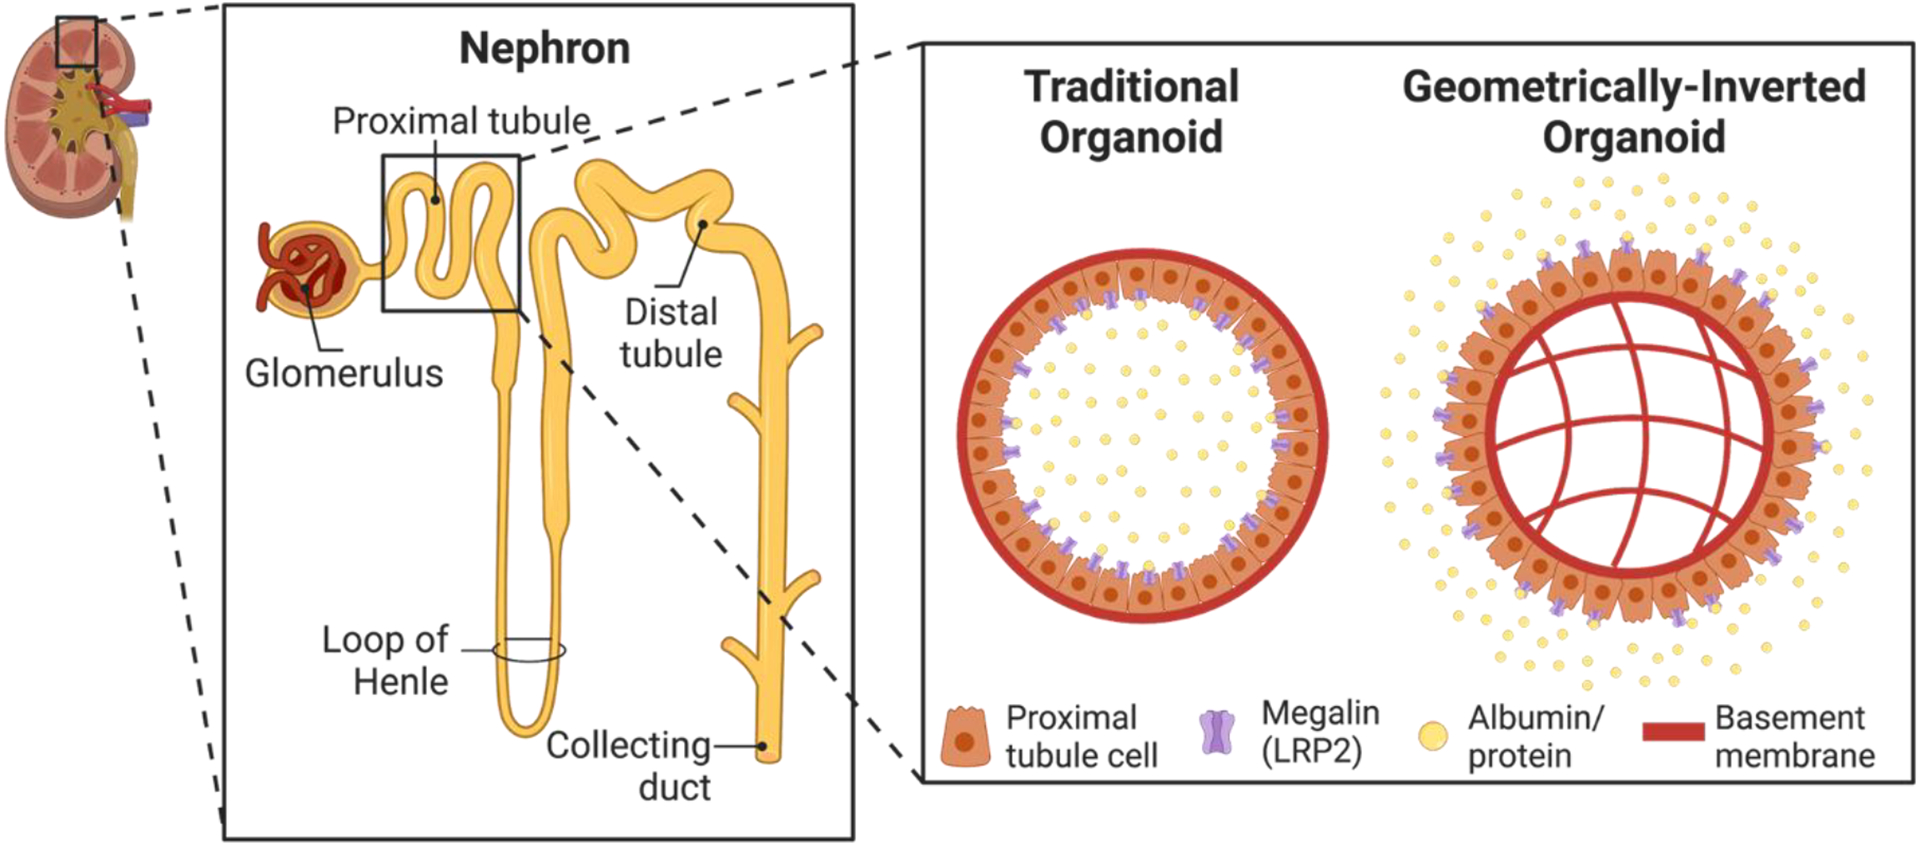
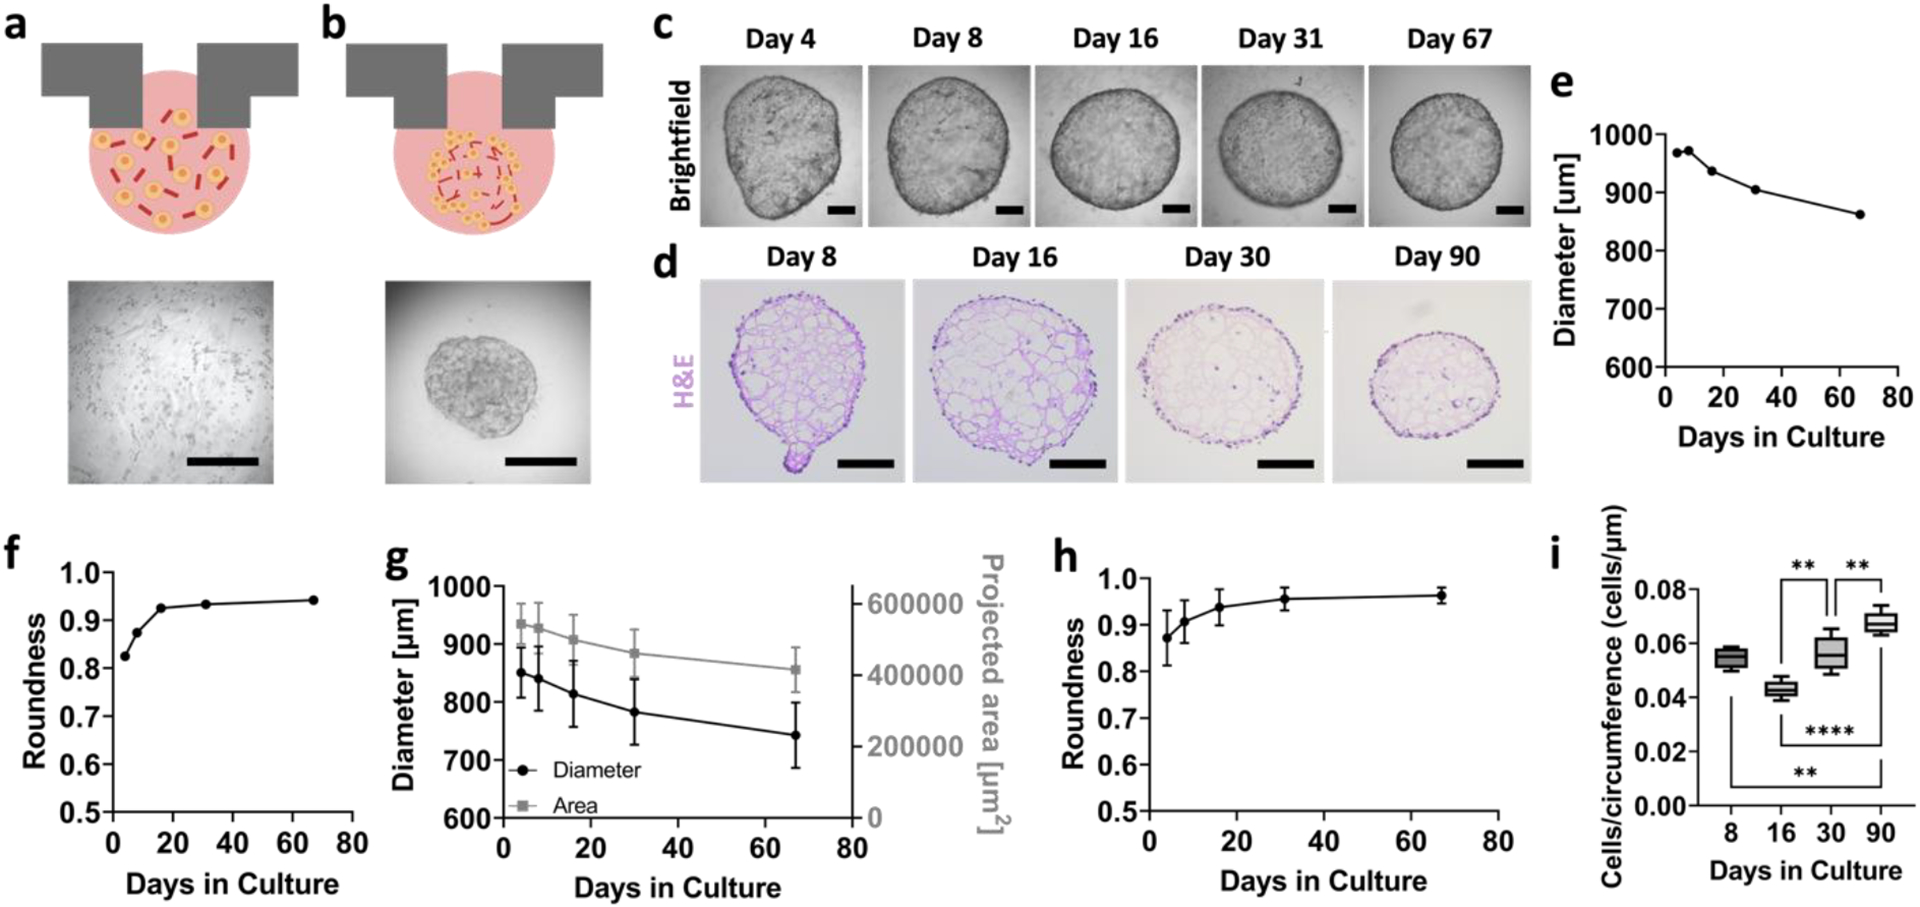
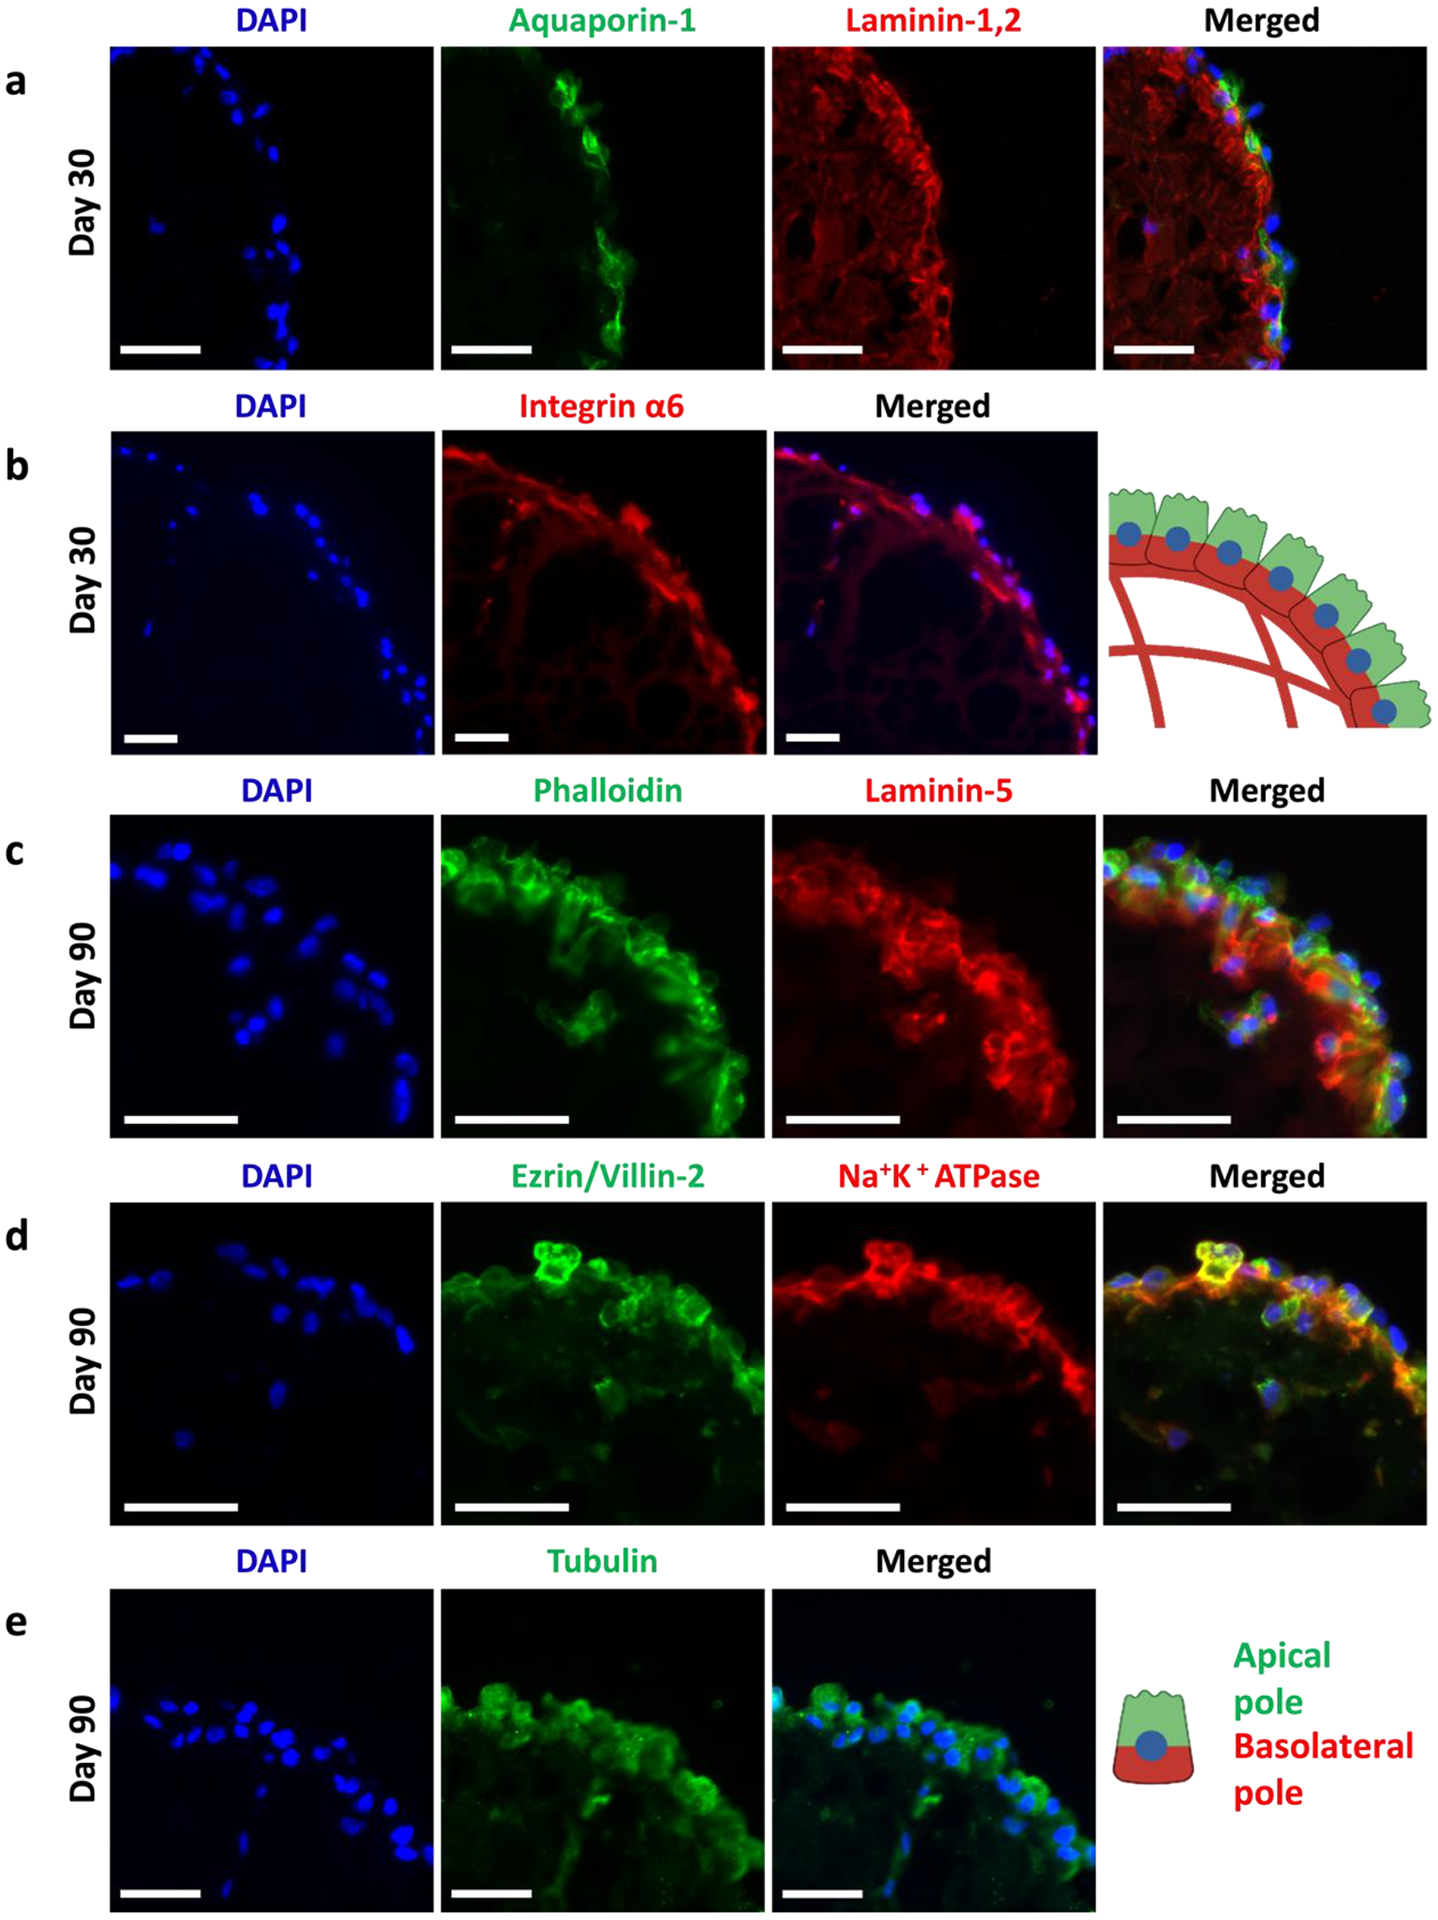
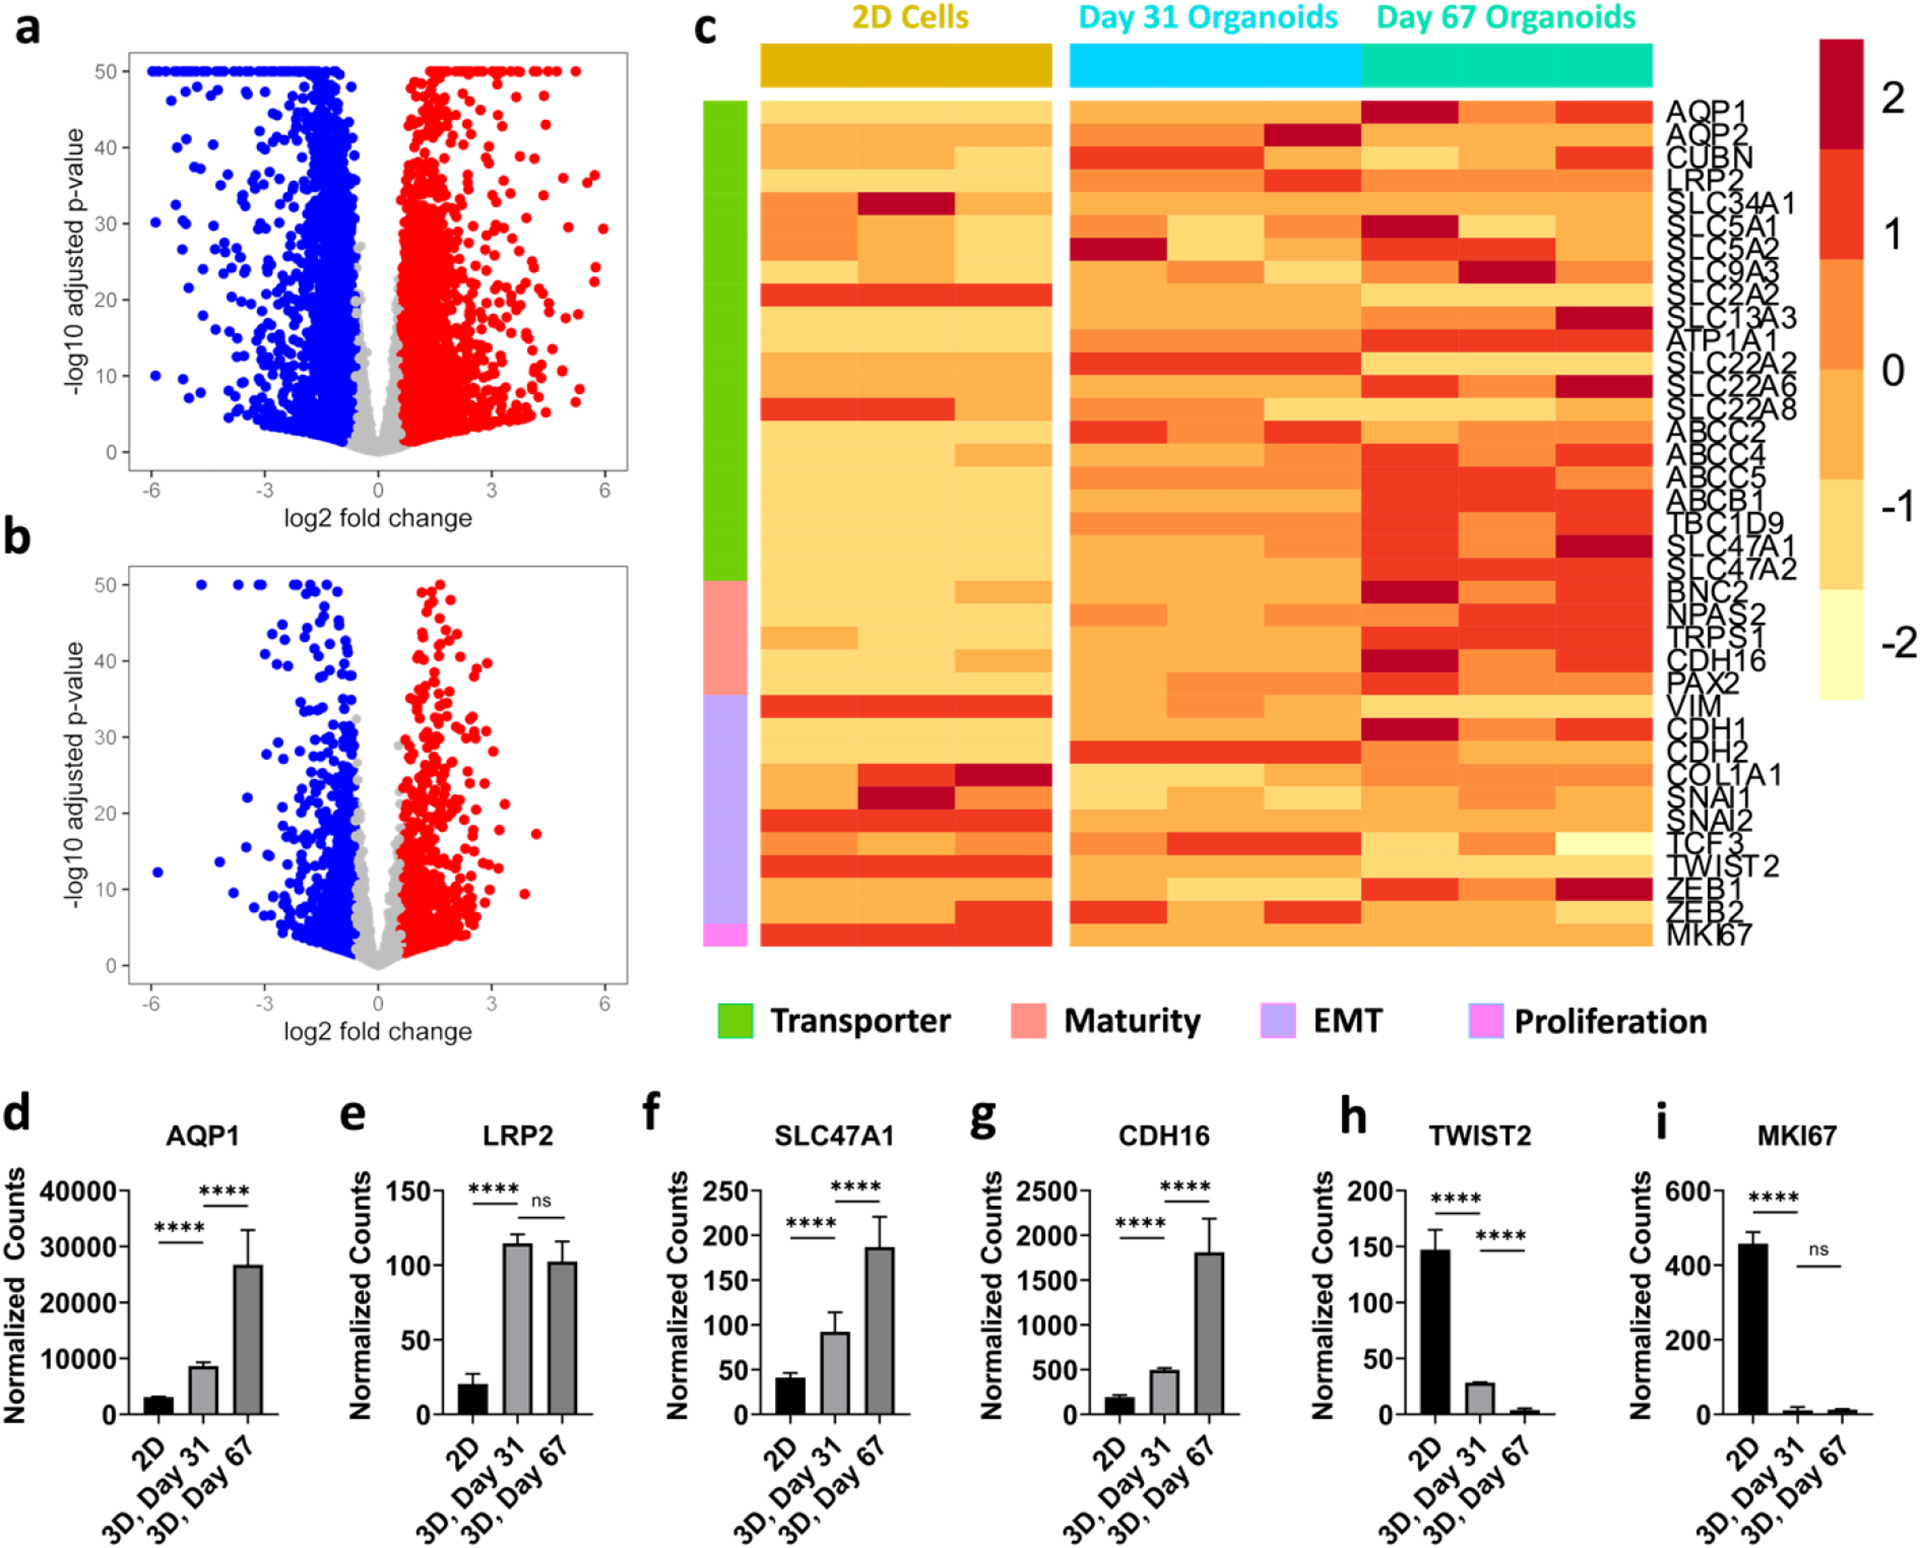
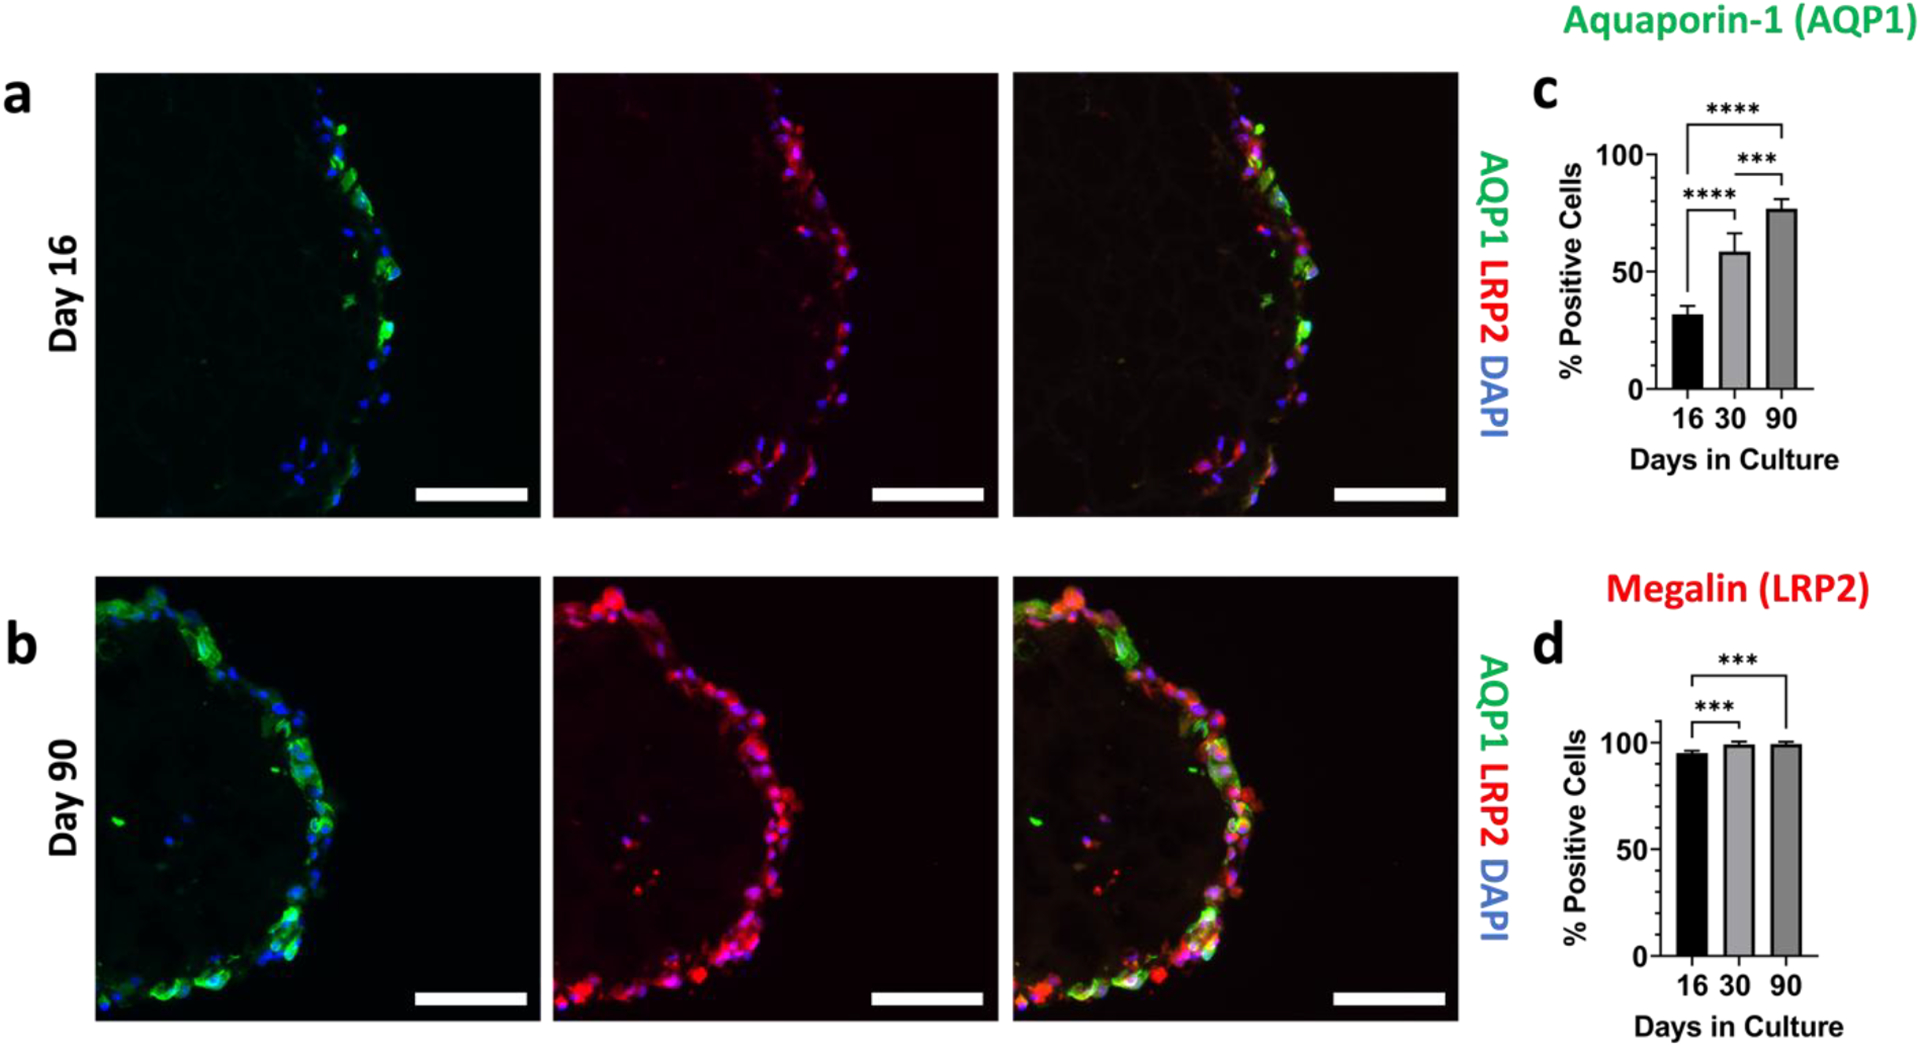
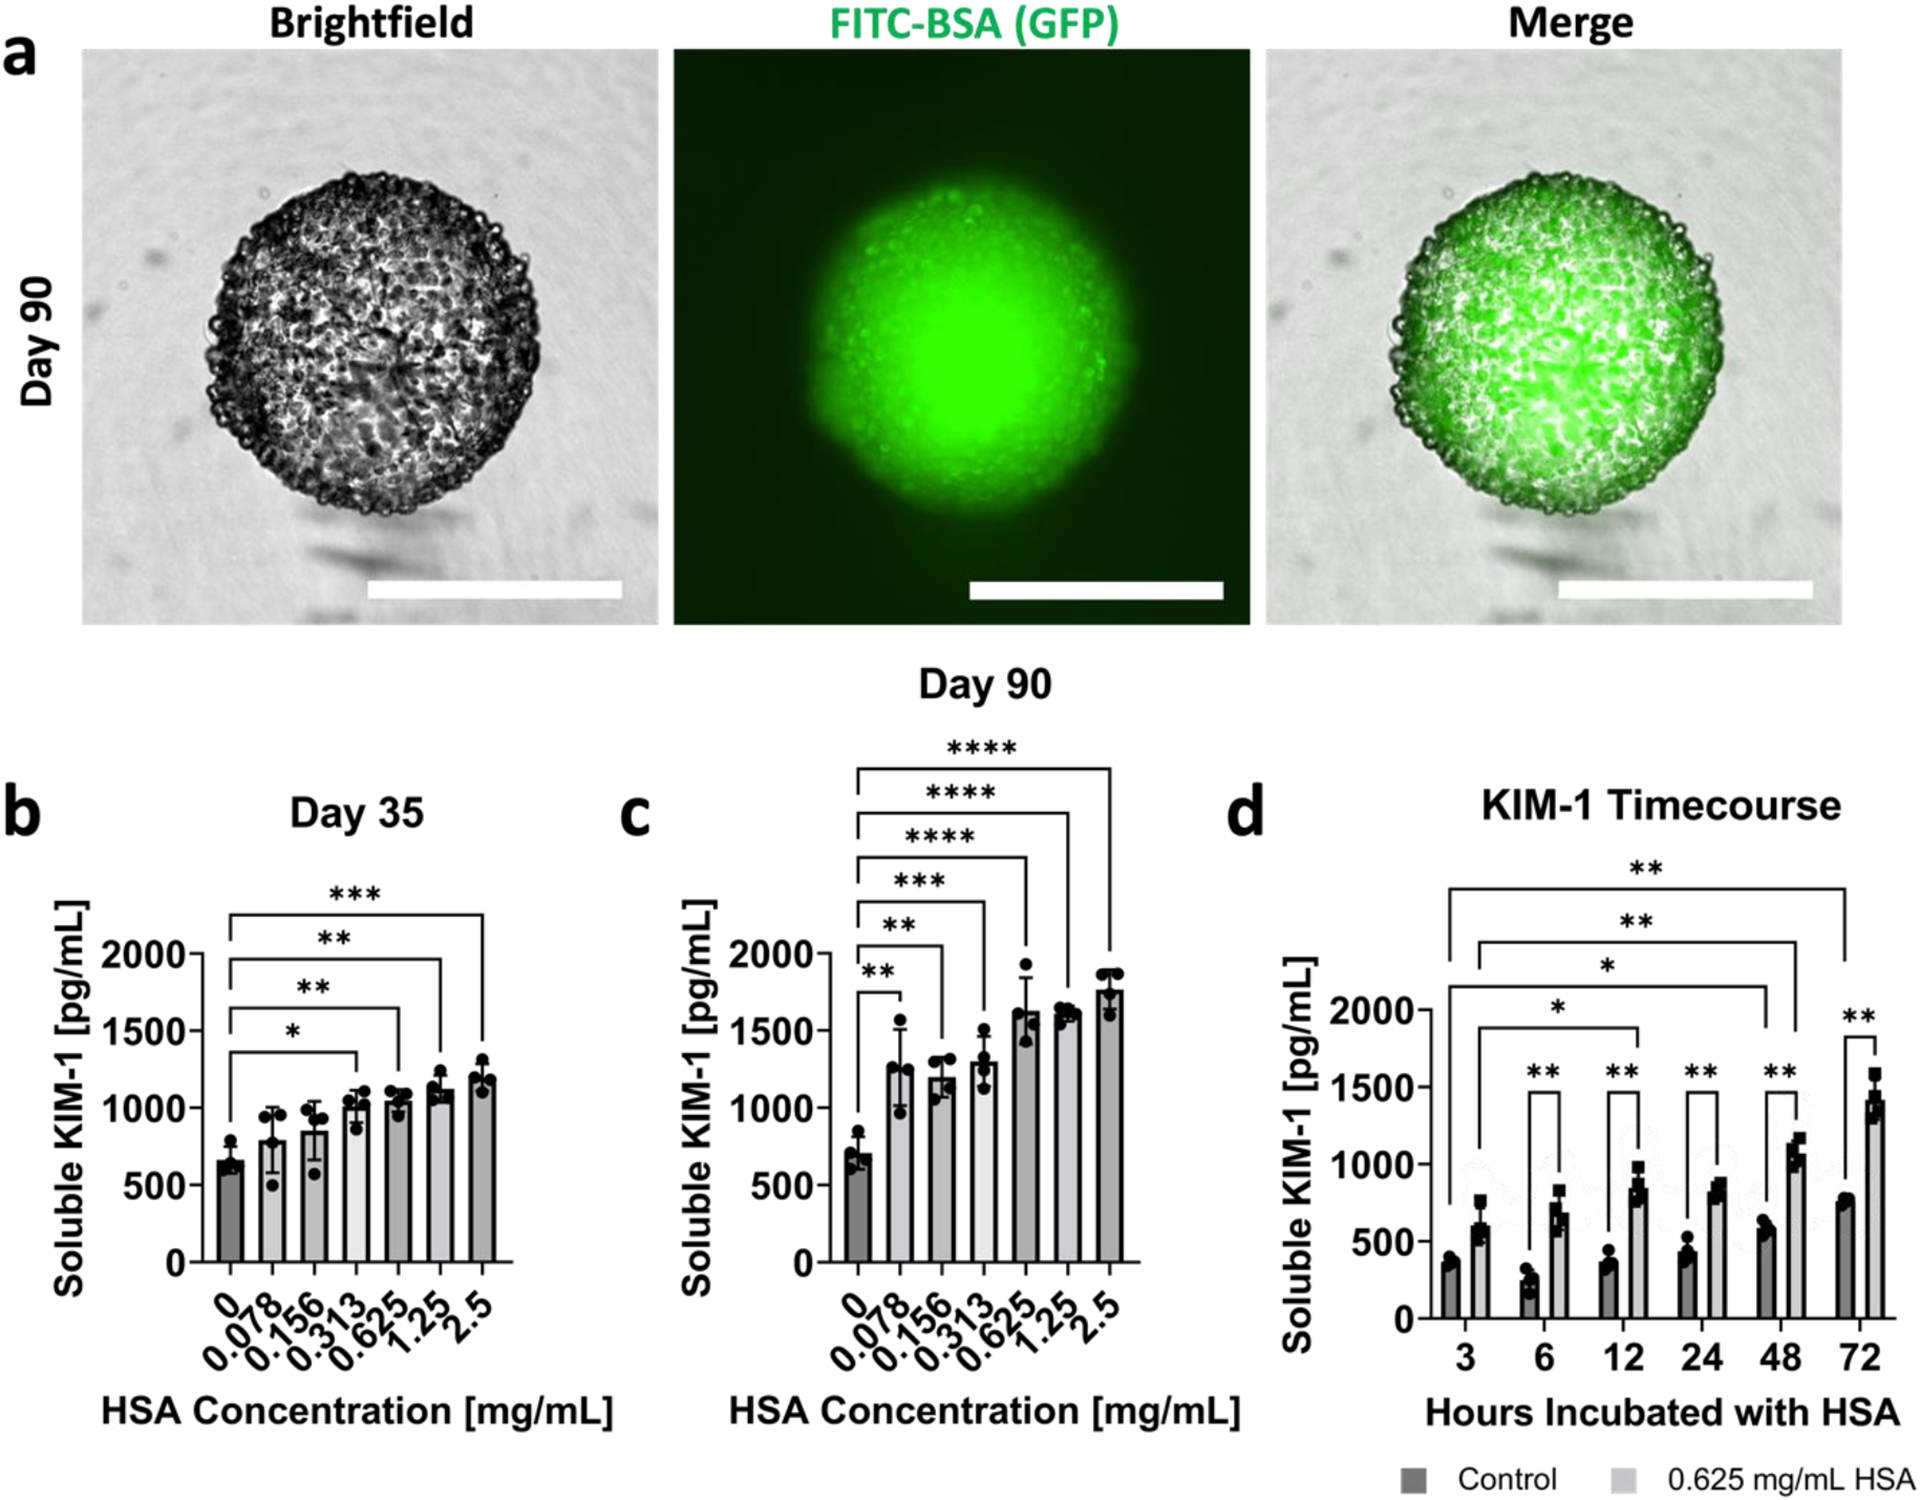
This study reports the cellular self-organization of primary human renal proximal tubule epithelial cells (RPTECs) around a minimal Matrigel scaffold to produce basal-in and apical-out proximal tubule organoids (tubuloids). These tubuloids are produced and maintained in hanging drop cultures for 90+ days, the longest such culture of any kind reported to date. The tubuloids upregulate maturity markers, such as aquaporin-1 (AQP1) and megalin (LRP2), and exhibit less mesenchymal and proliferation markers, such as vimentin and Ki67, compared to 2D cultures. They also experience changes over time as revealed by a comparison of gene expression patterns of cells in 2D culture and in day 31 and day 67 tubuloids. Gene expression analysis and immunohistochemistry reveal an increase in the expression of megalin, an endocytic receptor that can directly bind and uptake protein or potentially assist protein uptake. The tubuloids, including day 90 tubuloids, uptake fluorescent albumin and reveal punctate fluorescent patterns, suggesting functional endocytic uptake through these receptors. Furthermore, the tubuloids release kidney injury molecule-1 (KIM-1), a common biomarker for kidney injury, when exposed to albumin in both dose- and time-dependent manners. While this study focuses on potential applications for modeling proteinuric kidney disease, the tubuloids may have broad utility for studies where apical proximal tubule cell access is required.

Keywords: Basal-in organoid; Kidney; Proteinuria; Tubuloid.


Conflict of interest statement

Declaration of competing interest The authors declare that they have no known competing financial interests or personal relationships that could have appeared to influence the work reported in this paper.

Figures

Figure 1.
Figure 1.. Establishment of geometrically-inverted organoids.
Schematic of a nephron, the functional unit of the kidney. Inset shows a comparison of typical organoids, and geometrically-inverted organoids. Since megalin is located on the apical surface of proximal tubule cells, apical-out organoids allow for more ease of access of megalin and therefore proteinuria studies.
Figure 2.
Figure 2.. Optimization of geometrically-inverted proximal tubule organoid formation.
(a) Schematic and brightfield image of RPTECs at time of seeding, where cells are homogeneously mixed among partially gelled Matrigel. (b) Schematic and brightfield image of organoid formation within 24–48 hours. Scalebars represent 500 μm. (c) Time course brightfield of whole organoids, with the same organoid tracked over time. Scalebars represent 200 μm. (d) H&E images of representative organoid sections at days 8, 16, 30, and 90 of their growth. Scalebars represent 200 μm. (e) Diameter and (f) roundness values for the particular organoid shown in panel (c). (g) Area, diameter, and (h) roundness values for organoids for days 4–67 of their growth. (i) Quantification of cell coverage per circumference length of RPTEC organoids at days 8, 16, 30, and 90 of their growth. For panels (g) and (h), n = 16 per timepoint. For panel (i), n=5 per timepoint. One-way ANOVA was performed using Tukey’s multiple comparisons. ** denotes p ≤ 0.01 and **** denotes p ≤ 0.0001.
Figure 3.
Figure 3.. RPTEC organoids exhibit basal-in and apical-out phenotype.
(a) Immunofluorescence staining images of: (a) DAPI (blue), aquaporin-1 (green), laminin-1,2 (red), and merged; (c) DAPI (blue), phalloidin (green), laminin-5 (red), and merged; (d) DAPI (blue), ezrin/villin-2 (green), and Na+K+ATPase (red), and merged; (e) DAPI (blue), tubulin (green), and merged. Schematic shows basal-in (red) and apical-out (green) phenotype. All scalebars represent 50 μm.
Figure 4.
Figure 4.. RPTEC organoid transcriptomics.
(a) Volcano plot from bulk RNAseq comparing day 31 organoids with 2D RPTECs, and (b) day 67 with day 31 organoids. (c) Heatmap from bulk RNAseq comparing day 67 organoids, day 31 organoids, and 2D RPTECs. The colors in the heatmaps represent Z-scores computed from normalized gene counts. Normalized counts of genes of day 67 organoids, day 31 organoids, and 2D RPTECs for (d) AQP1, (e) LRP2, (f) SLC47A1, (g) CDH16, (h) TWIST2, and (i) MKI67. n = 3 for both 2D and organoid samples. These genes were significantly different based on the LRT with the Benjamini-Hochberg correction. **** denotes p ≤ 0.0001.
Figure 5.
Figure 5.. Organoids show maturity over 90 day growth period.
Immunofluorescence images of aquaporin-1 (green), megalin (red), DAPI (blue), and the channels merged at (a) day 16, and (b) day 90 of their culture. All scalebars represent 100 μm. (c) Quantification of the percentage of cells that were positive for aquaporin-1. (d) Quantification of the percentage of cells that were positive for megalin. For panels (c) and (d), n=5 per timepoint. One-way ANOVA was performed using Tukey’s multiple comparisons. *** denotes p ≤ 0.001 and **** denotes p ≤ 0.0001.
Figure 6.
Figure 6.. RPTEC organoids uptake albumin, and show dose- and time-dependent KIM-1 production to HSA stimulus.
(a) Brightfield, GFP, and merged images of FITC-BSA uptake in day 90 RPTEC organoids. All scalebars represent 500 μm. Dose dependent KIM-1 production for organoids exposed to HSA at (b) day 35 and (c) day 90 of their culture. (d) Time-dependent KIM-1 production for control organoids and organoids exposed to 0.625 mg/mL HSA. For all plots, n = 4 was used for each dose or time point. One-way ANOVA with Tukey’s multiple comparisons was used for panels (b) and (c). Two-way ANOVA with Šīdák’s multiple comparison tests was utilized for panel (d). For all statistical tests, * indicates p ≤ 0.05, ** indicates p ≤ 0.01, *** indicates p ≤ 0.001, and **** indicates p ≤ 0.0001.

References

    1. Soo JYC, Jansen J, Masereeuw R, Little MH, Advances in predictive in vitro models of drug-induced nephrotoxicity, Nat. Rev. Nephrol 14 (2018) 378–393. 10.1038/s41581-018-0003-9. - DOI - PMC - PubMed
    1. Knight A, Systematic Reviews of Animal Experiments Demonstrate Poor Contributions Toward Human Healthcare, Rev. Recent Clin. Trials 3 (2008) 89–96. 10.2174/157488708784223844. - DOI - PubMed
    1. Nieskens TTG, Wilmer MJ, Kidney-on-a-chip technology for renal proximal tubule tissue reconstruction, Eur. J. Pharmacol 790 (2016) 46–56. 10.1016/j.ejphar.2016.07.018. - DOI - PubMed
    1. Wilmer MJ, Ng CP, Lanz HL, Vulto P, Suter-Dick L, Masereeuw R, Kidney-on-a-Chip Technology for Drug-Induced Nephrotoxicity Screening, Trends Biotechnol. 34 (2016) 156–170. 10.1016/j.tibtech.2015.11.001. - DOI - PubMed
    1. King SM, Higgins JW, Nino CR, Smith TR, Paffenroth EH, Fairbairn CE, Docuyanan A, Shah VD, Chen AE, Presnell SC, Nguyen DG, 3D proximal tubule tissues recapitulate key aspects of renal physiology to enable nephrotoxicity testing, Front. Physiol 8 (2017) 1–18. 10.3389/fphys.2017.00123. - DOI - PMC - PubMed

Publication types

MeSH terms

Substances