. 2022 Oct 10;13(1):5983.
doi: 10.1038/s41467-022-33365-y.

The spatial transcriptomic landscape of non-small cell lung cancer brain metastasis

Affiliations

The spatial transcriptomic landscape of non-small cell lung cancer brain metastasis

Qi Zhang et al. Nat Commun. .

Abstract

Brain metastases (BrMs) are a common occurrence in lung cancer with a dismal outcome. To understand the mechanism of metastasis to inform prognosis and treatment, here we analyze primary and metastasized tumor specimens from 44 non-small cell lung cancer patients by spatial RNA sequencing, affording a whole transcriptome map of metastasis resolved with morphological markers for the tumor core, tumor immune microenvironment (TIME), and tumor brain microenvironment (TBME). Our data indicate that the tumor microenvironment (TME) in the brain, including the TIME and TBME, undergoes extensive remodeling to create an immunosuppressive and fibrogenic niche for the BrMs. Specifically, the brain TME is characterized with reduced antigen presentation and B/T cell function, increased neutrophils and M2-type macrophages, immature microglia, and reactive astrocytes. Differential gene expression and network analysis identify fibrosis and immune regulation as the major functional modules disrupted in both the lung and brain TME. Besides providing systems-level insights into the mechanism of lung cancer brain metastasis, our study uncovers potential prognostic biomarkers and suggests that therapeutic strategies should be tailored to the immune and fibrosis status of the BrMs.


Conflict of interest statement

The authors declare no competing interests.

Figures
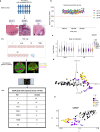
Fig. 1
Fig. 1. Digital spatial profiling of primary NSCLC and metastasized tumor tissues.
a Schematic of study design and workflow. NSCLC patients with metastases to the brain (n = 44) were represented in four tissue microarray (TMA) blocks (LB-D1 to D4) for digital spatial profiling (DSP) of the whole transcriptome (18,694 genes). Regions-of-interest (ROI) for DSP were annotated based on histology by a pathologist and immunofluorescence staining with the morphological markers PanCK (for epithelial cells), CD45 (for hematopoietic cells), and GFAP (for brain cells). A total of 119 ROIs (average 0.2 mm2 each) were analyzed. The figure was created with BioRender. The scale bar is 100 μm. b RNA-sequencing saturation graph showing that none of the ROIs sequenced had counts below 50%. c Normalization of the RNA sequencing data using the third (Q3) quartile count. The limits of the violin plots represent the upper and lower quartiles, whereas the dots indicate the median. (L) = 30 samples, (LB) = 27 samples, TBME = 19 samples, TIME-L = 15 samples, TIME-B = 8 samples, mLN = 13 samples, BC = 7 samples. d Principal component analysis (PCA) of the DSP data. e Uniform Manifold Approximation and Projection (UMAP) analysis. Source data are provided as a Source Data file.
Fig. 2
Fig. 2. Spatial specificity of cellular composition and gene expression in the primary tumor and metastases.
a ROI-specific deconvolution of cell populations based on the corresponding bulk RNA-Seq data by SpatialDecon. Related ROIs are grouped together and identified on the x axis. b Deconvolution of cell populations by Qlucore Omics Explorer based on average gene expression in the indicated groups. c Cell deconvolution of the TME by MCP-Counter. d Violin plots showing the differences in the indicated cell types between the TIME-L, TIME-B, and TBME. The P values were based on nonparametric test (Kruskal–Wallis) followed by the Dunn test for pairwise comparisons. The dashed and solid lines within the plots indicate upper and lower quartiles and medians, respectively, n = 19, 15, and 8 samples in TBME, TIME-L, and TIME-B, respectively. Heatmaps colored from blue to red according to Z-score scale −2 to 2. Source data are provided as a Source Data file.
Fig. 3
Fig. 3. Spatially resolved functional gene signatures of lung cancer metastasis.
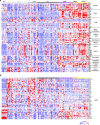
a Heatmap of functional gene signatures (Fges) to show changes in the cellular or extracellular components in the different regions of the primary and metastasized tumors. ROIs from the same region are grouped together and distinguished by different color codes at the top of graph. The boxes with broken lines highlight gene clusters with significant differences in expression between the TIME-L and the TIME-B or TBME. The boxes with dotted lines denote gene clusters with significant differences between the TBME and BC groups. b Heatmap of pEMT signature genes across the ROIs. The box with broken lines highlights a gene cluster with significant difference between the tumor cores (L, LB) and the tumor microenvironment (TIME-L/B and TBME). The box with dotted lines denotes a gene cluster with similar expression patterns between the TBME and BC. Heatmaps colored from blue to red according to Z-score scale −2 to 2. Source data are provided as a Source Data file.
Fig. 4
Fig. 4. The tumor brain microenvironment is fibrotic and immunosuppressed.
a Volcano plot of differentially expressed genes between the TBME and BC. P values were obtained from the Student t test (two-sided). b Estimated changes in cell populations between the TBME and BC based on expression of cell-specific genes, n = 19, 7 samples in TBME, and BC, respectively. c Representative images of H&E and Masson trichrome staining to differentiate TBME samples based on fibrosis status. F(−) no detectable fibrosis, F(i) intermediately fibrotic TBME, F(h) highly fibrotic TBME. The scale bar is 100 μm. d Violin plot depicting the expression of representative CAF-ECM genes. P values shown were based on nonparametric Mann–Whitney test (two-sided). The dotted lines indicate upper and lower quartiles, whereas the dashed lines represent medians. e Cytokine/chemokine expression across the TMBE and BC. Dot size indicates relative gene expression, n = 8, 6, 5, and 7 samples in F(−), F(h), F(I), and BC, respectively. f Heatmap of expression of regulatory genes for T-cell activation and inhibition. g Heatmap of significantly altered T-cell regulatory genes between the F(h) and F(−) TBME. h Violin plots showing significantly different gene expression in the fibrous vs. non-fibrous TBME for a selection of immune checkpoint genes. P values are based on Mann–Whitney test (two-sided). The dotted and dashed lines within the plots indicate upper & lower quartiles and medians, respectively. b, c n = 26, whereas n = 21 in (f). Heatmaps colored from blue to red according to Z-score scale −2 to 2. Source data are provided as a Source Data file.
Fig. 5
Fig. 5. Microglia–macrophage reprogramming in the TBME.
a Heatmap of differential expression of specific genes for the M1 and M2 macrophages in the F(h) vs. F(−) TBME. b Violin plots showing the significant differences in expression of CD163, TGFB1, CXCL10, and SPI1 between the F(h) vs. F(−) TBME. The dashed and solid lines within the plots indicate upper and lower quartiles and medians, respectively. c Heatmap of differentially expressed myeloid signature gene in the TBME and BC ROIs, n = 8, 6, 5, and 7 samples in F(−), F(h), F(I), and BC, respectively. d Heatmap of differential microglia signature gene expression in the F(h) vs. F(−) TBME. e. Violin plots showing the significant differences in expression of selective microglia markers, n = 8 and 6 samples in F(−) and F(h), respectively. The dotted lines indicate upper and lower quartiles, whereas the solid lines represent medians. a, c, d P < 0.05, Student’s t test (two-sided). The P values in (b, e) were based on Mann–Whitney test (two-sided). Heatmaps colored from blue to red according to Z-score scale −2 to 2. Source data are provided as a Source Data file.
Fig. 6
Fig. 6. Reprogramming of astrocytes in the TBME.
a Heatmap of differential expression of astrocyte signature genes in the TBME and BC ROIs. P < 0.05, Student’s t test (two-sided). b Mature astrocyte markers were significantly downregulated in the TBME. P < 0.05, Student’s t test (two-sided). c Violin plots showing significantly different expression of a selection of mature astrocyte markers between the fibrotic vs. nonfibrotic TBME. The P values were based on nonparametric test (Kruskal–Wallis) followed by Dunn test for pairwise comparisons. The dashed and solid lines within the plots indicate upper & lower quartiles and medians, respectively. d Heatmap of expression of reactive astrocyte markers in the TBME and BC. P < 0.05, Student’s t test. e Violin plots showing significantly different gene expression in the fibrotic vs. nonfibrotic TBME for a selection of reactive astrocyte markers. The dashed and solid lines within the plots indicate upper & lower quartiles and medians, respectively. a, b, d P < 0.05, Student’s t test. The P values in (c, e) were based on nonparametric test (Kruskal–Wallis) followed by the Dunn test for pairwise comparisons. Heatmaps colored from blue to red according to Z-score scale −2 to 2. Source data are provided as a Source Data file.
Fig. 7
Fig. 7. Gene association network analysis reveals TME modules for therapeutic targeting.
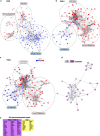
ac Snapshots of the gene association networks in the TBME (a), TIME-B (b), and TIME-L (c) based on the corresponding DEGs. Functional modules are identified by broken circles. Network DEGs colored from blue to red according to Log2FC scale −3 to 3. FC, fold change. d A ligand–receptor interaction network between LB and TBME. e A list of FDA-approved drug targets identified from the DEG and network analysis.
Fig. 8
Fig. 8. Signature genes of metastasis predict patient outcomes.
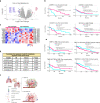
a Volcano plot of DEGs between the L groups with fast and slow metastasis. P values were obtained from the Student t test (two-sided). b Selective examples of Kaplan–Meier survival analysis and Cox proportional hazards of the current cohort (n = 30) and the TCGA LAUD cohort (n = 501) using individual metastasis signature genes. c Heatmap of significantly up- or downregulated genes in the fast vs. slow metastasis L ROI groups. P values were based on Student’s t test. d A set of genes within the metastasis gene signature identified by multivariate Cox regression analysis and their performances in predicting patient survival of the patient cohort in the current study. P values were obtained from the Wald test (two-sided). e Selective examples of Kaplan–Meier survival analysis and the associated hazard ratios of the current cohort (n = 23) and the TCGA LGG cohort (n = 515) using the brain TME network genes. f A graphical summary depicting the major changes in the tumor core and microenvironment that underlie NSCLC brain metastasis. Source data are provided as a Source Data file.

References

    1. Boire A, Brastianos PK, Garzia L, Valiente M. Brain metastasis. Nat. Rev. Cancer. 2020;20:4–11. doi: 10.1038/s41568-019-0220-y. - DOI - PubMed
    1. Hu H, et al. Brain metastases status and immunotherapy efficacy in advanced lung cancer: a systematic review and meta-analysis. Front. Immunol. 2021;12:669398. doi: 10.3389/fimmu.2021.669398. - DOI - PMC - PubMed
    1. Horn L, et al. Ensartinib vs crizotinib for patients with anaplastic lymphoma kinase-positive non-small cell lung cancer: a randomized clinical trial. JAMA Oncol. 2021;7:1617–1625. doi: 10.1001/jamaoncol.2021.3523. - DOI - PMC - PubMed
    1. Goldberg SB, et al. Pembrolizumab for management of patients with NSCLC and brain metastases: long-term results and biomarker analysis from a non-randomised, open-label, phase 2 trial. Lancet Oncol. 2020;21:655–663. doi: 10.1016/S1470-2045(20)30111-X. - DOI - PMC - PubMed
    1. Gadgeel SM, et al. Atezolizumab in patients with advanced non-small cell lung cancer and history of asymptomatic, treated brain metastases: exploratory analyses of the phase III OAK study. Lung Cancer. 2019;128:105–112. doi: 10.1016/j.lungcan.2018.12.017. - DOI - PubMed

Publication types

Substances

Grants and funding