. 2022 Oct 10;13(1):5971.
doi: 10.1038/s41467-022-33535-y.

ISG15 conjugation to proteins on nascent DNA mitigates DNA replication stress

Affiliations

ISG15 conjugation to proteins on nascent DNA mitigates DNA replication stress

Christopher P Wardlaw et al. Nat Commun. .

Abstract

The pathways involved in suppressing DNA replication stress and the associated DNA damage are critical to maintaining genome integrity. The Mre11 complex is unique among double strand break (DSB) repair proteins for its association with the DNA replication fork. Here we show that Mre11 complex inactivation causes DNA replication stress and changes in the abundance of proteins associated with nascent DNA. One of the most highly enriched proteins at the DNA replication fork upon Mre11 complex inactivation was the ubiquitin like protein ISG15. Mre11 complex deficiency and drug induced replication stress both led to the accumulation of cytoplasmic DNA and the subsequent activation of innate immune signaling via cGAS-STING-Tbk1. This led to ISG15 induction and protein ISGylation, including constituents of the replication fork. ISG15 plays a direct role in preventing replication stress. Deletion of ISG15 was associated with replication fork stalling, tonic ATR activation, genomic aberrations, and sensitivity to aphidicolin. These data reveal a previously unrecognized role for ISG15 in mitigating DNA replication stress and promoting genomic stability.


Conflict of interest statement

The authors declare no competing interests.

Figures

Fig. 1
Fig. 1. Deletion of Nbs1 Impacts DNA Replication.
a Nbs1f/f MEFs treated with 4-OHT for 48 h. Whole cell extracts were taken at the indicated time points post 4-OHT addition for western blotting. Extracts from 2 mM HU and 2 μM CPT (2 h) treated cells served as controls for antibody specificity. b DNA combing analysis of Nbs1f/f at the indicated timepoints post 4-OHT addition. IdU = green fiber, CldU = Red fiber. CldU fiber length was measured, and fork speed calculated. Combined data from three independent experiments (No 4-OHT n = 207, 3 days n = 250, 4 days n = 329). Median velocity shown. Two Tailed Mann–Whitney test ****= p < 0.0001. c As in b. except Left-Right ratios of CldU fibers initiating from the same origin were measured. Combined data from three independent experiments. (No 4-OHT n = 82, 3 days n = 106, 4 days n = 122). Pearson coefficient (r) shown. d Pulse-Chase iPOND-SILAC-MS showing mean Log2 ratio of pulse vs. chase protein intensities from three independent experiments. Proteins with a Log2 ratio of at least 0.5 plotted in order of ascending ratio. e iPOND-SILAC-MS from Nbs1f/f cells 3 days post 4-OHT addition vs. no 4-OHT. Proteins identified in at least two out of three experiments were ranked by mean Log2 ratio. Boundaries for enriched and depleted proteins represented by dotted lines at inflection points within the data. Source data are provided with this paper.
Fig. 2
Fig. 2. Loss of Mre11 Complex Function Induces ISG15 and ISGylation.
a Western blot of whole cell extracts taken three days post 4-OHT addition or from untreated control. b ISG15 expression measured by qPCR. Nbs1−/− is three days post 4-OHT addition. Mean of three independent experiments shown with SD. Two-tailed unpaired t-test, ns= not significant, **= p 0.0034. c Western blot of whole cell extracts from cells with or without induction of Nbs1 or Mre11 deletion (3- and 7-days post 4-OHT, respectively). d Cellular fractionation and western blot from Nbs1f/f MEFs taken three days post 4-OHT addition or from untreated control. e Western blot analysis of whole cell extracts taken 16 h after aphidicolin (Aph) addition at the indicated concentrations. f Western blot analysis of whole cell extracts taken at the indicated timepoints after 0.25 μM Camptothecin (CPT) addition. Source data are provided with this paper.
Fig. 3
Fig. 3. Cytoplasmic DNA underlies ISG15 induction Upon Nbs1 Deletion.
a DAPI stained DNA bridges per nucleus for Nbs1f/f MEFs three days post 4-OHT addition. Mean of three independent experiments with SEM. Two-tailed unpaired t-test was used. * = p 0.0270. b The percentage of Nbs1f/f MEFs 3 days post 4-OHT addition cells with micronuclei. Mean of three independent experiments with SEM. Two-tailed unpaired t-test was used. *** = p 0.0005 c Example images for the data shown in a and b. Between 105 and 152 cells were counted per condition per biological repeat (−4-OHT n = 371, +4-OHT n = 416). d Western blot of whole cell extracts from Nbs1f/f and Nbs1-/f with or without 4-OHT induced Nbs1 deletion. e Western blot of whole cell extracts with or without 4-OHT induced Nbs1 deletion, in the presence or absence of 5 μM MRT67307 Tbk1 inhibitor. f Western blot of whole cell extracts taken from Nbs1f/f or Nbs1f/f cGAS−/− with or without 4-OHT induced Nbs1 deletion. Two independent Nbs1f/f cGAS−/− clones shown. g Western blot of whole cell extracts from the indicated MEFs, with or without 24 h of 1 μM aphidicolin (Aph) or 0.25 μM camptothecin (CPT) treatment. Source data are provided with this paper.
Fig. 4
Fig. 4. Protein ISGylation occurs at replication forks.
a Western blot analysis of whole cell extracts taken from Nbs1f/f and Nbs1f/f 3FLAG-6HIS-ISG15 with or without 4-OHT induced Nbs1 deletion. b Diagrammatic representation of the approach used to identify ISGylated proteins in c and d. c Mass-spectrometry hits from Nbs1−/− vs. Nbs1−/− 3FLAG-6HIS-ISG15 MEFs. Mean Log2 ratio and Log10 abundance of two independent experiments shown. d Mass-spectrometry hits from 3FLAG-6His-ISG15 vs. Nbs1−/− 3FLAg-6HIS-ISG15 MEFs. Mean Log2 ratio and Log10 abundance of two independent experiments shown. e Western blot analysis of nickel pulldowns from the chromatin fraction of Nbs1−/− and Nbs1−/− 3FLAG-6HIS-ISG15 MEFs. Soluble inputs and pulldowns from chromatin were extracted from the same cells and run concurrently. f Western blot analysis of nickel pulldowns from the chromatin fraction of Usp18−/− Nbs1−/− and Usp18−/− Nbs1−/− with or without expression of an inducible exogenous 6HIS-ISG15. Soluble and pulldown samples were extracted from the same cells and run concurrently. g IPOND-SILAC-MS from Nbs1−/− vs. Nbs1−/− ISG15−/− cells. Proteins identified in at least two out of three independent experiments ranked by mean Log2 ratio. Boundaries for enriched/depleted proteins represented by dotted lines at Log2 abundances of ≥0.6 and ≤ −0.6. Source data are provided with this paper.
Fig. 5
Fig. 5. ISG15−/− MEFs exhibit replication stress and genomic instability.
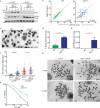
a Western blot of whole cell extracts in Nbs1f/f and Nbs1f/f ISG15−/− MEFs with or without Nbs1 deletion. Lanes labelled 1-4 represent independent Nbs1f/f ISG15−/− clones. b DNA combing analysis of the indicated cell lines. Left-Right ratios of CldU tracts initiating from the same origin were calculated. Combined data from three independent experiments plotted. WT n = 107, ISG15−/− n = 99. Pearson’s co-efficient (r) shown. c Example images for the data shown in d and e. Between 118 and 162 cells were counted per genotype per biological repeat (WT n = 643, ISG15−/− n = 592). d Percentage of nuclei with micronuclei in the indicated cell lines. Mean of four independent experiments with SEM. Two-tailed unpaired t-test, *** = p 0.0004. e Quantification of DAPI stained DNA bridges in the indicated cell lines. Mean of four independent experiments with SEM. Two tailed unpaired t-test, * = p 0.0240. f Quantification of metaphase spreads with or without induction of Nbs1 deletion. Combined data from three independent experiments. Between 45 and 52 metaphases were counted per condition per biological repeat (Nbs1f/f −4OHT n = 152; Nbs1f/f ISG15−/− −4-OHT n = 148; Nbs1f/f + 4-OHT n = 144; Nbs1f/f ISG15−/− + 4-OHT n = 146). Mean with SD shown. Two-tailed Mann–Whitney test ****= p < 0.0001, *= p 0.0207. g Example images for data shown in f. h Viability ten days after 16 h aphidicolin (Aph) treatment as seen via colony forming assay. Mean of three independent experiments with SEM. Source data are provided with this paper.
Fig. 6
Fig. 6. Model.
Diagram predicting how ISG15 may be functioning at replication forks to maintain genomic stability. ISG15 proficient cells: ISGylation stabilizes protein interactions and regulates protein functions at stalled replication forks, thus promoting faithful DNA replication. ISG15 deficient cells: No ISGylation of replication fork associated proteins upon fork stalling. Depletion of proteins required for fork stability and/or loss of protein regulation results in replication stress phenotypes. Red cross represents loss of protein activity. See main text for details. Source data are provided with this paper.

Similar articles

Cited by

References

    1. Ciccia A, Elledge SJ. The DNA damage response: making it safe to play with knives. Mol. Cell. 2010;40:179–204. doi: 10.1016/j.molcel.2010.09.019. - DOI - PMC - PubMed
    1. Lee JH, Paull TT. Activation and regulation of ATM kinase activity in response to DNA double-strand breaks. Oncogene. 2007;26:7741–7748. doi: 10.1038/sj.onc.1210872. - DOI - PubMed
    1. Stracker TH, Petrini JH. The MRE11 complex: starting from the ends. Nat. Rev. Mol. Cell Biol. 2011;12:90–103. doi: 10.1038/nrm3047. - DOI - PMC - PubMed
    1. Cerami E, et al. The cBio cancer genomics portal: an open platform for exploring multidimensional cancer genomics data. Cancer Disco. 2012;2:401–404. doi: 10.1158/2159-8290.CD-12-0095. - DOI - PMC - PubMed
    1. Hohl M, et al. Modeling cancer genomic data in yeast reveals selection against ATM function during tumorigenesis. PLoS Genet. 2020;16:e1008422. doi: 10.1371/journal.pgen.1008422. - DOI - PMC - PubMed

Publication types