. 2022 Nov;7(11):1791-1804.
doi: 10.1038/s41564-022-01238-1. Epub 2022 Oct 10.

Pneumococcal within-host diversity during colonization, transmission and treatment

Affiliations

Pneumococcal within-host diversity during colonization, transmission and treatment

Gerry Tonkin-Hill et al. Nat Microbiol. 2022 Nov.

Abstract

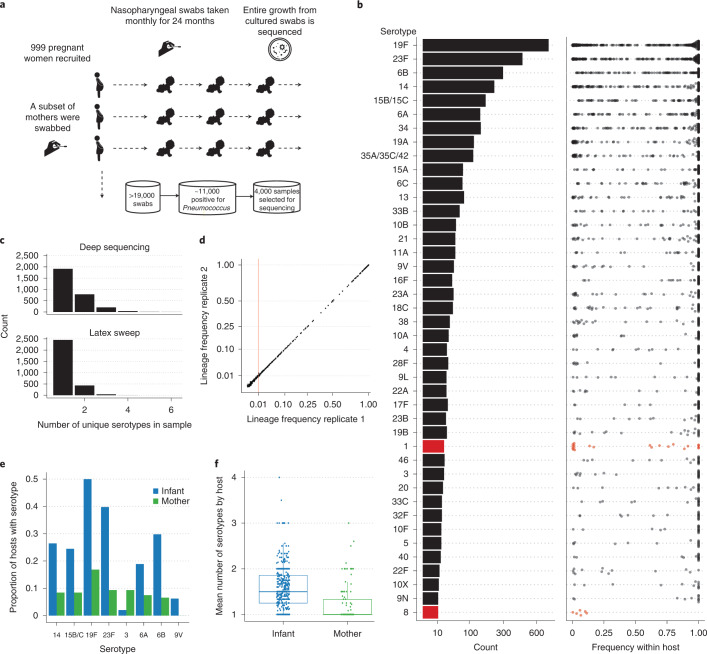
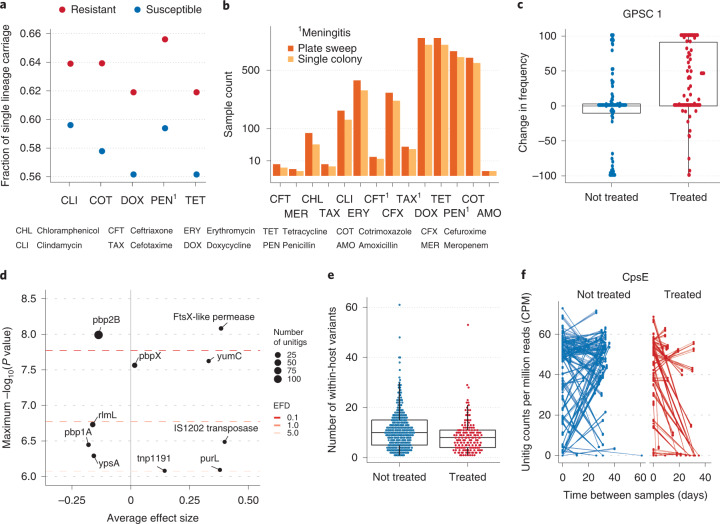
Characterizing the genetic diversity of pathogens within the host promises to greatly improve surveillance and reconstruction of transmission chains. For bacteria, it also informs our understanding of inter-strain competition and how this shapes the distribution of resistant and sensitive bacteria. Here we study the genetic diversity of Streptococcus pneumoniae within 468 infants and 145 of their mothers by deep sequencing whole pneumococcal populations from 3,761 longitudinal nasopharyngeal samples. We demonstrate that deep sequencing has unsurpassed sensitivity for detecting multiple colonization, doubling the rate at which highly invasive serotype 1 bacteria were detected in carriage compared with gold-standard methods. The greater resolution identified an elevated rate of transmission from mothers to their children in the first year of the child's life. Comprehensive treatment data demonstrated that infants were at an elevated risk of both the acquisition and persistent colonization of a multidrug-resistant bacterium following antimicrobial treatment. Some alleles were enriched after antimicrobial treatment, suggesting that they aided persistence, but generally purifying selection dominated within-host evolution. Rates of co-colonization imply that in the absence of treatment, susceptible lineages outcompeted resistant lineages within the host. These results demonstrate the many benefits of deep sequencing for the genomic surveillance of bacterial pathogens.


Conflict of interest statement

N.J.C. was a consultant for Antigen Discovery, Inc., involved in the design of a proteome array for S. pneumoniae. All other authors declare no competing interests.

Figures

Fig. 1
Fig. 1. Study design and the frequency of pneumococcal serotypes within the host.
a, A schematic of the study sampling design. b, A barplot indicating the number of times each serotype was observed across all deep-sequenced samples. The distribution of the corresponding within-host frequencies of these serotypes is given in the adjacent plot, with overlapping points separated to indicate the density at each position along the x axis. Lineages with ambiguous serotype calls were excluded from this plot. Serotypes found at significantly lower frequencies using the Kolgomorov-Smirnov test are coloured red. c, Histograms indicating the distribution of the number of unique serotypes observed using either PDS or latex sweeps. d, Comparisons between the estimated GPSC lineage frequencies in 192 samples that were sequenced in replicate. The vertical red line indicates the minimum frequency required for consideration in the mSWEEP pipeline. e, Barplots indicating the differences in the representation of serotypes between mothers and infants. f, Boxplots indicating the distribution in the mean number of serotypes (excluding non-typables) observed in 107 mothers and 450 of their infants. The median and interquartile range are given by the horizontal lines, with the whiskers indicating the largest and smallest values excluding those outside 1.5 times the interquartile range.
Fig. 2
Fig. 2. Transmission dynamics within the Maela refugee camp.
a, Top: the distribution of pairwise geographic distances between 411 different households versus the number of intermediate transmission events as inferred using the modified TransCluster algorithm. The median and interquartile range are given by the horizontal lines, with the whiskers indicating the largest and smallest values excluding those outside 1.5 times the interquartile range. Bottom: the distribution of estimated intermediate transmission events within households. b, A map of the Maela refugee camp, with inferred direct transmission links overlaid. Roads are shown in white. The direction of transmission is not estimated. Blue lines indicate transmission links that would typically be inferred using a representative genome per sample, while red lines indicate additional links that were found using PDS. c, A representative mother-child pair indicating how transmission direction was inferred. Coloured circles indicate the serotypes present, with PDS data available for those coloured in darker shade. Black lines indicate close transmission links inferred using the TransCluster algorithm, with the vertical red line indicating the time the child was one-year old. d, The distribution of the direction of transmission between mother and child split by whether the transmission event occurred before or after the child turned one. e, A schematic demonstrating that we would expect to see an elevated rate of polymorphic sites (represented by blue and red variants) among close transmission pairs. f, The distribution of the number of shared polymorphic sites in 3,663 potential transmission pairs involving an estimated 0, 1 or ≥2 intermediate hosts. The elevated number of variants involving 0 intermediates hosts indicates a mean bottleneck size ≥1. The median and interquartile range are given by the horizontal lines, with the whiskers indicating the largest and smallest values excluding those outside 1.5 times the interquartile range.
Fig. 3
Fig. 3. Mutational spectra and selection within the host.
a, The relative fraction of different single-nucleotide base changes found within the host in 1,627 samples involving only a single pneumococcal lineage compared to those changes observed between hosts inferred using ancestral state reconstruction. b, dN/dS ratios for genes found to be under significant selection (adjusted P < 0.05) within the host in 1,592 samples using the Poisson individual gene model in the dNdScv R package. Error bars indicate the 95% confidence intervals of the coefficient in the regression. The grey line indicates a dN/dS ratio of one, indicating the separation of positive and negative selection. c, An example of the within-host variant allele frequencies over five consecutive samples, taken from a single infant colonized with a single pneumococcal lineage (GPSC 47), which is not a common ‘epidemic’ lineage. Each coloured line indicates the frequency of a different within-host variant.
Fig. 4
Fig. 4. Within-host dynamics of antimicrobial resistance and the impact of antibiotic treatment.
a, The fraction of carriage events consisting of a single lineage found to be resistant to each antibiotic class. Only those classes found to be less likely to occur in instances of multiple colonization than expected given the background prevalence in the population are shown. b, The number of resistance calls for each antibiotic class in 1,158 samples for which both single colony picks and PDS had been performed. c, The distribution of the change in frequency of the GPSC1 lineage in 182 pairs of consecutive samples that have and have not received antimicrobial treatment. The median and interquartile range are given by the horizontal lines, with the whiskers indicating the largest and smallest values excluding those outside 1.5 times the interquartile range. d, A dot plot indicating the significance and effect size of unitigs found to be associated with antimicrobial treatment using a linear mixed model in Pyseer. e, The number of within-host SNV in 1,192 samples taken from distinct carriage episodes involving only a single pneumococcal lineage split by recently received antimicrobial treatment. f, The normalized count of unitigs found in CpsE in pairs of samples where a subset had received treatment between sampling events.
Extended Data Fig. 1
Extended Data Fig. 1. Verification of lineage and serotype calling pipelines.
(a) The number of true positive and false negative GPSC lineage calls in 44 artificial laboratory mixtures from Knight et al., 2021. (b) Recall of GPSC lineage calls in 1158 samples which also had WGS performed on single colony pick in Chewapreecha et al., 2014. (c) The recall of resistance calls in the same 1158 samples. (d) The number of mismatches between latex sweeps and either mGEMS/seroba or the serocall algorithms at the subgroup serotype level. As mGEMs/seroba was found to better agree with latex sweeps in cases of conflict between the two algorithms, the mGEMs/seroba result was chosen. (e) Intersection between the serotype calls of latex sweeps and the combined mGEMs/seroba and serocall pipeline for all typable isolates and (f) same as in e. but for non-typable.
Extended Data Fig. 2
Extended Data Fig. 2. Verification of resistance calling pipeline as well as the distribution of resistance calls in mothers and infants.
(a) The number of resistance calls identified in 584 samples which consisted of only a single pneumococcal lineage and were sequenced using PDS and via single colony picks in Chewapreecha et al., 2014. The high correspondence between the two methods suggests PDS has a low false positive rate. (b) The number of samples found to be either resistant or susceptible to each antibiotic class for both mothers and infants. Resistance was determined by running the CDC pneumococcal resistance pipeline on the deconvoluted lineages output by the mGEMS pipeline. The individual lineage calls were collapsed to the sample level so that a sample was called as ‘resistant’ if resistance was observed in any of its lineage.
Extended Data Fig. 3
Extended Data Fig. 3. Distribution of SNV found in regions with elevated rates of polymorphisms.
Boxplots indicating the distribution of the number of SNV found in regions with elevated rates of polymorphism from 1592 samples classified by the spatial scan statistic (see Methods). The median and interquartile range is given by the horizontal lines with the whiskers indicating the largest and smallest values excluding those outside 1.5 times the interquartile range. The high rate of polymorphisms in these region indicates that these SNVs are unlikely to be the result of denovo mutation within the host and are instead likely to be driven by recombination, gene duplication, homology with phages and co-colonising bacterial species and hard to align regions.
Extended Data Fig. 4
Extended Data Fig. 4. Within and between host mutational spectra for each of 96 tri nucleotide substitution classes.
Each spectra is displayed according to the 96 substitution classification defined by the substitution class (colour in the graph) and sequence context immediately 3′ and 5′ to the mutated base. The mutation types are given on the horizontal axes, while vertical axes depict the frequency of each type. Mutations observed using ancestral state reconstruction from genomes observed in different hosts are given above while mutations observed within a host are given in the bottom panels.
Extended Data Fig. 5
Extended Data Fig. 5. Distribution of multiple carriage duration.
The distribution of the length of time multiple lineages colonised the same host in one of 59 multiple carriage events where the same lineages were observed in consecutive samples. Multiple colonisation events that were only observed at a single time point are excluded from this analysis. The median and interquartile range is given by the horizontal lines with the whiskers indicating the largest and smallest values excluding those outside 1.5 times the interquartile range.
Extended Data Fig. 6
Extended Data Fig. 6. Impact of antimicrobial treatment on GPSCs and lineages classified by PBP gene type of Li et al., 2016.
(a) The proportion of lineages made up of each GPSC after treatment (red) and in the absence of treatment (blue). Only those GPSCs that are present at a prevalence of at least 1% in the full data set are included. (b) The log odds ratio of clearance following treatment for 1,848 lineages containing previously classified PBP genes in Li et al., 2016 (left). Those in red are significantly more likely to persist following antimicrobial treatment whilst those in blue are likely to be eliminated. Error bars indicate the standard deviation of the coefficient point estimate in the GLM. The corresponding distribution of MIC profiles for lineages found to contain these PBP genes in Li et al. is given to the right. The median and interquartile range is given by the horizontal lines with the whiskers indicating the largest and smallest values excluding those outside 1.5 times the interquartile range.
Extended Data Fig. 7
Extended Data Fig. 7. GWAS study design and results of paired sample analysis.
(a) A schematic indicating the design of the two GWAS analyses conducted in this study with red and blue points indicating within-host polymorphisms. A linear model on the log of the unitig counts per million similar to that commonly used in RNA-seq analyses was used in the paired design while the Pyseer algorithm was used in the standard design. (b) The proportion of resistant isolates following antimicrobial treatment. Those samples within a threshold of 4 weeks (28 days) of a treatment event were classified into the ‘treated’ class. (c) A dot plot indicating the significance and average effect size of unitigs found to be associated with treatment in the analysis of paired samples taken from the same host where a subset have received antimicrobial treatment in between sampling events. Regressions were performed using a linear model with the frequency of the unitig within the host taken as the dependent variable (Methods). The horizontal red lines indicate the expected number of false discoveries (EFD) providing different significance levels to interpret the resulting variant calls.
Extended Data Fig. 8
Extended Data Fig. 8. Distribution of sequencing coverage and contamination used to determine quality control cut-offs.
The distribution of the depth of sequencing coverage (a) and fraction of reads (b) that aligned to S. pneumoniae using the Kraken2 metagenomics read classification algorithm. The vertical red lines indicate the minimum thresholds chosen for samples to be included in the main analysis. (c) Boxplots indicating the distribution of the fraction of reads assigned to each species in each of the 3761 samples by the Kraken2 metagenomics read classification algorithm. Due to the large sequence diversity within, and similarity between, S. pneumoniae and S. pseudopneumoniae, a large fraction of reads assigned as ‘unclassified’ and as S. pseudopneumoniae may actually belong to S. pneumoniae genomes. The median and interquartile range is given by the horizontal lines with the whiskers indicating the largest and smallest values excluding those outside 1.5 times the interquartile range.
Extended Data Fig. 9
Extended Data Fig. 9. Schematics indicating the bioinformatics pipelines used to call serotypes, resistance elements and genetic distance in transmission calculations.
(a) A schematic indicating the bioinformatics pipeline used to call both serotypes and resistance elements from the PDS data. (b) A schematic indicating how the pairwise SNP distance is calculated to account for within-host diversity and polymorphisms. Here, the red and blue indicate distinct nucleotides. A mismatch is only called if no alleles match at that location between the two samples. Variable sequencing coverage is accounted for using an empirical Bayes approach that made use of the multinomial Dirichlet distribution (methods).
Extended Data Fig. 10
Extended Data Fig. 10. Reproducibility of single nucleotide (SNV) variant calls and the distribution of variable site among different coding positions used to assess the reliability of SNVs.
(a) The fraction of minority single nucleotide variant calls replicated in 95 samples which involve only a single pneumococcal lineage and were sequenced in replicate with separate reverse transcription, PCR amplification, and library preparation steps. The median and interquartile range is given by the horizontal lines with the whiskers indicating the largest and smallest values excluding those outside 1.5 times the interquartile range (b). The distribution of the number of variable sites among different coding positions. Variable sites are dominated by those seen at the third codon position similar to that observed in Dyrdak et al., 2019. The stability of the fractions at lower frequencies suggests that the variant calling pipeline has successfully filtered out erroneous variant calls. At higher frequencies, the reduction in the total number of variants leads to increased variability.

References

    1. Wahl B, et al. Burden of Streptococcus pneumoniae and Haemophilus influenzae type b disease in children in the era of conjugate vaccines: global, regional, and national estimates for 2000–15. Lancet Glob. Health. 2018;6:e744–e757. - PMC - PubMed
    1. GBD 2016 Lower Respiratory Infections Collaborators. Estimates of the global, regional, and national morbidity, mortality, and aetiologies of lower respiratory infections in 195 countries, 1990–2016: a systematic analysis for the Global Burden of Disease Study 2016. Lancet Infect. Dis. 2018;18:1191–1210. - PMC - PubMed
    1. Wymant C, et al. PHYLOSCANNER: inferring transmission from within- and between-host pathogen genetic diversity. Mol. Biol. Evol. 2017;35:719–733. - PMC - PubMed
    1. Campbell F, Strang C, Ferguson N, Cori A, Jombart T. When are pathogen genome sequences informative of transmission events? PLoS Pathog. 2018;14:e1006885. - PMC - PubMed
    1. Corander J, et al. Frequency-dependent selection in vaccine-associated pneumococcal population dynamics. Nat. Ecol. Evol. 2017;1:1950–1960. - PMC - PubMed

Publication types

Substances