. 2022 Nov;28(11):2333-2343.
doi: 10.1038/s41591-022-02014-8. Epub 2022 Oct 10.

Influence of the microbiome, diet and genetics on inter-individual variation in the human plasma metabolome

Affiliations

Influence of the microbiome, diet and genetics on inter-individual variation in the human plasma metabolome

Lianmin Chen et al. Nat Med. 2022 Nov.

Abstract

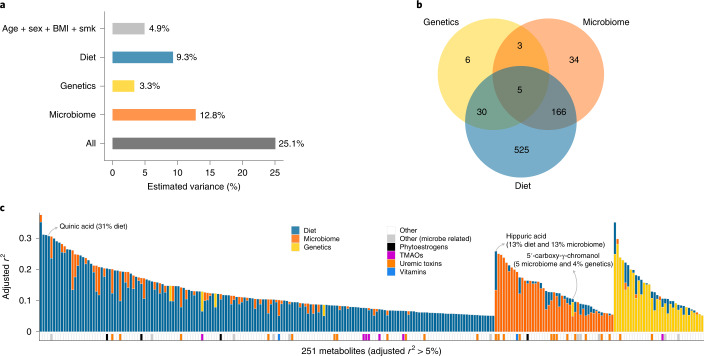
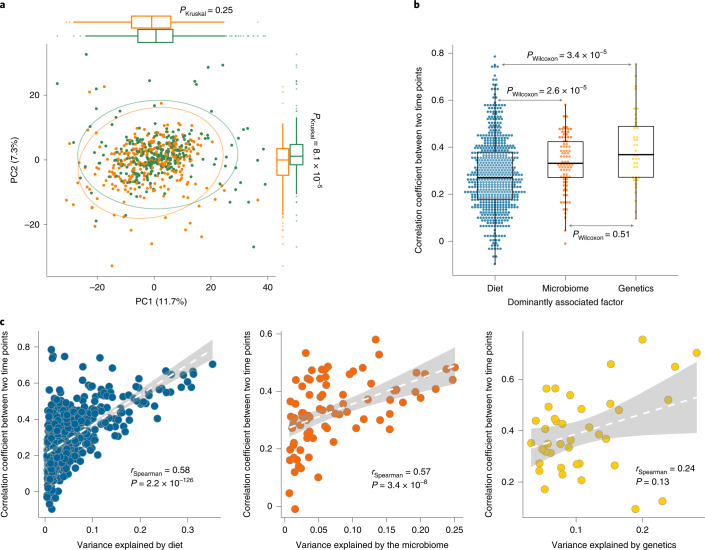
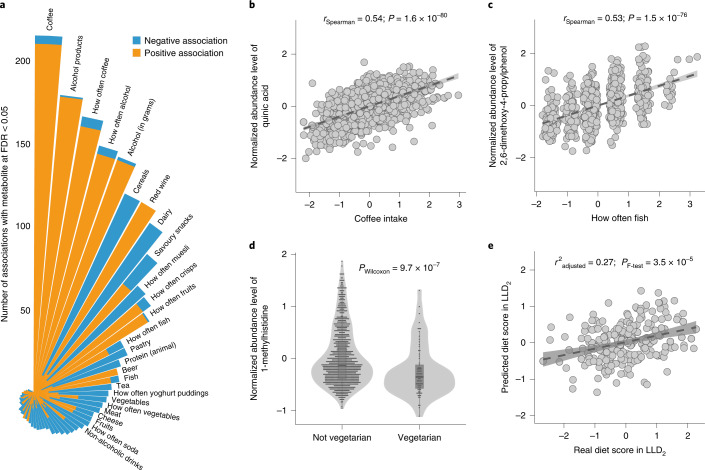
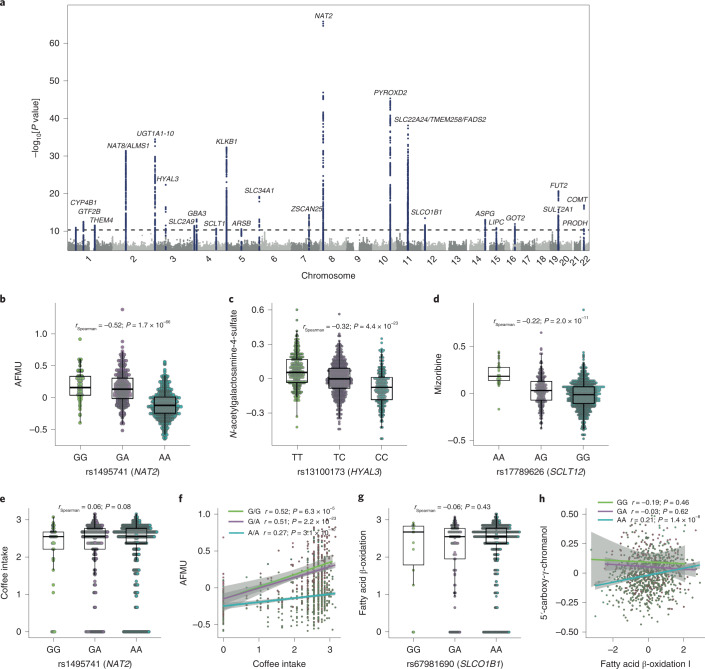
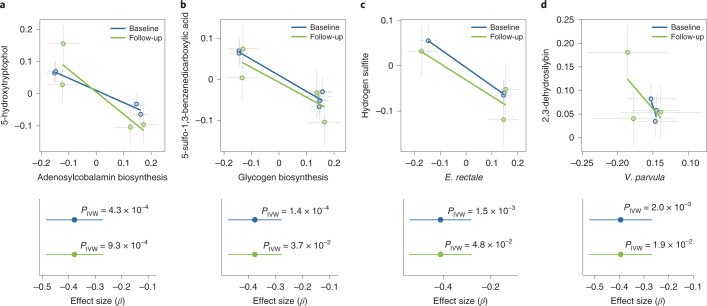
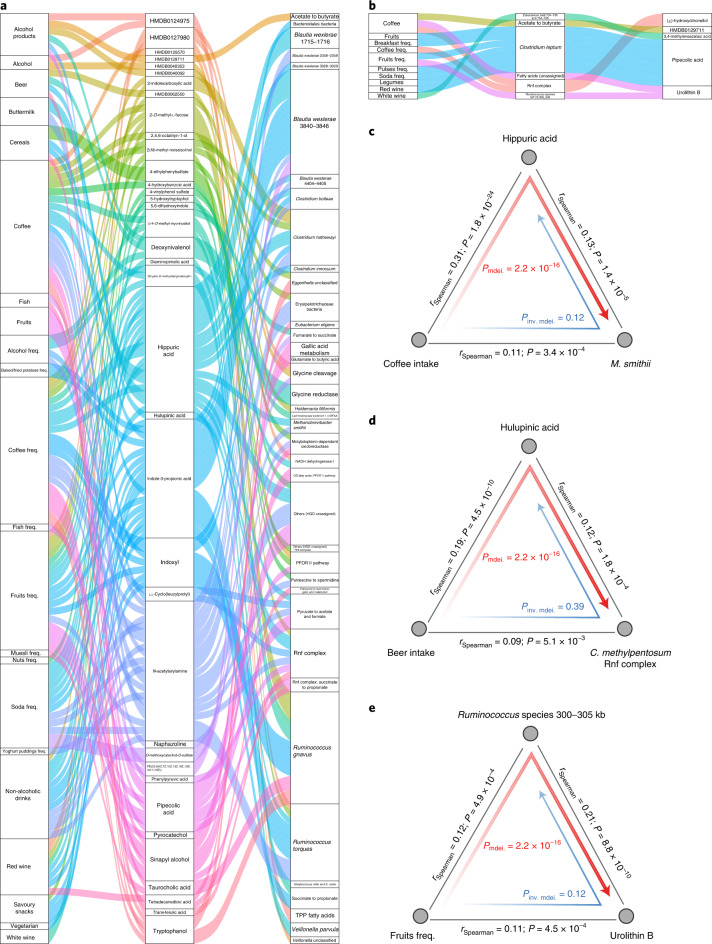
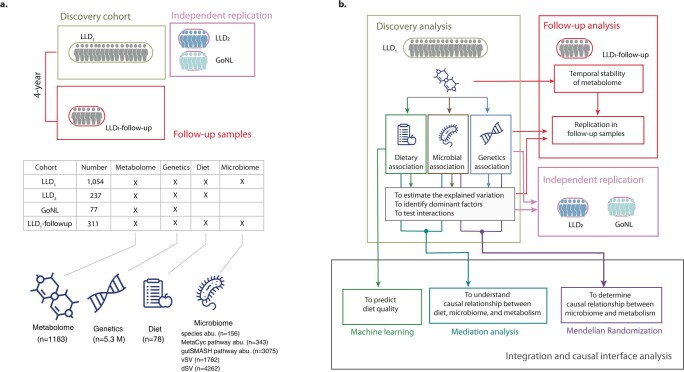
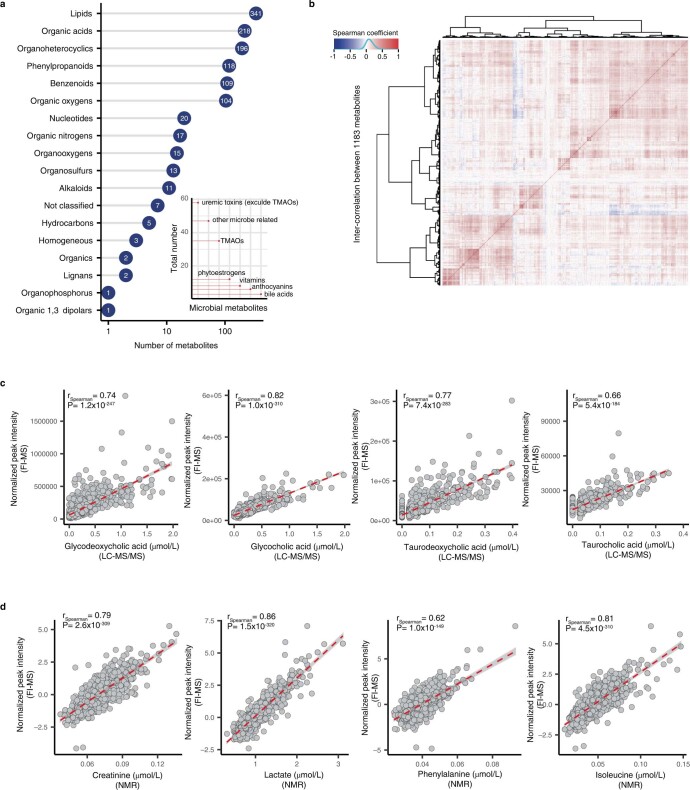
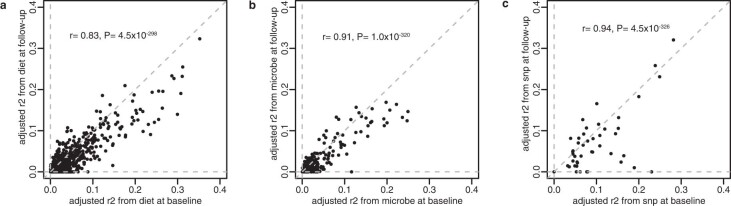
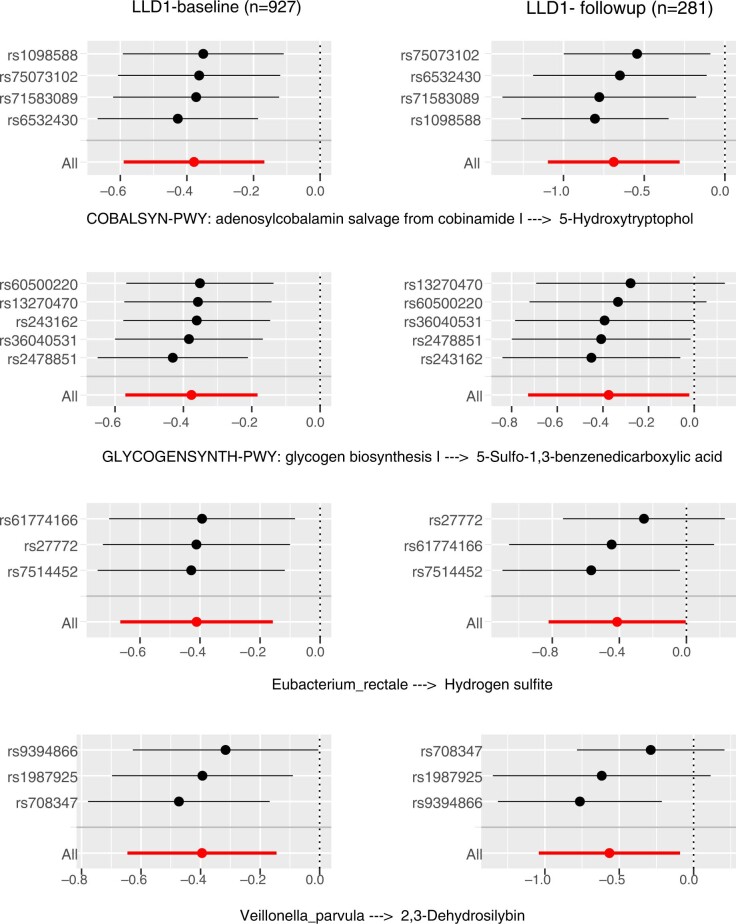
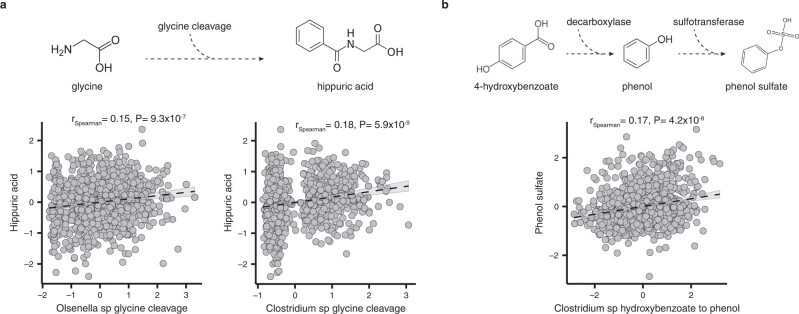
The levels of the thousands of metabolites in the human plasma metabolome are strongly influenced by an individual's genetics and the composition of their diet and gut microbiome. Here, by assessing 1,183 plasma metabolites in 1,368 extensively phenotyped individuals from the Lifelines DEEP and Genome of the Netherlands cohorts, we quantified the proportion of inter-individual variation in the plasma metabolome explained by different factors, characterizing 610, 85 and 38 metabolites as dominantly associated with diet, the gut microbiome and genetics, respectively. Moreover, a diet quality score derived from metabolite levels was significantly associated with diet quality, as assessed by a detailed food frequency questionnaire. Through Mendelian randomization and mediation analyses, we revealed putative causal relationships between diet, the gut microbiome and metabolites. For example, Mendelian randomization analyses support a potential causal effect of Eubacterium rectale in decreasing plasma levels of hydrogen sulfite-a toxin that affects cardiovascular function. Lastly, based on analysis of the plasma metabolome of 311 individuals at two time points separated by 4 years, we observed a positive correlation between the stability of metabolite levels and the amount of variance in the levels of that metabolite that could be explained in our analysis. Altogether, characterization of factors that explain inter-individual variation in the plasma metabolome can help design approaches for modulating diet or the gut microbiome to shape a healthy metabolome.


Conflict of interest statement

The authors declare no competing interests.

Figures

Fig. 1
Fig. 1. Contributions of genetics, diet and the microbiome to inter-individual variation in the plasma metabolome.
a, Inter-individual variation in the whole plasma metabolome explained by the indicated factors, estimated using the PERMANOVA method. All, all of the indicated factors combined; smk, smoking status. b, Venn diagram indicating the number of metabolites whose inter-individual variation was significantly explained by diet, genetics or the gut microbiome, as estimated using the linear regression method (FDRF-test < 0.05). c, Inter-individual variations in metabolites explained by diet, genetics or the gut microbiome, as estimated using the linear regression method (the lasso regression method was applied for feature selection) with a significant estimated adjusted r2 > 5% (FDRF-test < 0.05). The blue bars represent dietary contributions to metabolite variations, the yellow bars indicate genetic contributions and the orange bars indicate microbial contributions. The other colors indicate the metabolic categories of metabolites (see legend). The y axis indicates the proportion of variation explained. TMAO, trimethylamine N-oxide.
Fig. 2
Fig. 2. Temporal stability of plasma metabolites.
a, Principal component analysis of metabolite levels at two time points (Euclidean dissimilarity). The green dots indicate baseline samples and the orange dots indicate follow-up samples (n = 311 biologically independent samples). The Kruskal–Wallis test (two sided) was used to check differences between baseline and follow-up. b, Temporal stability of metabolites stratified by the dominantly associated factor for each metabolite. The Wilcoxon test (two sided) was used to check the differences between groups. Each dot represents one metabolite. The y axis indicates the Spearman correlation coefficient of abundances of each metabolite between two time points (n = 311 biologically independent samples). In a and b, the box plots show the median and first and third quartiles (25th and 75th percentiles) of the first and second principal components (a) or correlation coefficients (b); the upper and lower whiskers extend to the largest and smallest value no further than 1.5× the interquartile range (IQR), respectively; and outliers are plotted individually. c, Correlation between metabolite stability and the metabolite variance explained by diet (left), genetics (middle) and the microbiome (right). The x axis indicates the inter-individual variation explained by each factor and the y axis indicates the Spearman correlation coefficient (two sided) of abundances of each metabolite between the two time points. The dashed white lines show the best fit and the gray shading represents the 95% confidence interval (CI) (n = 311 biologically independent samples).
Fig. 3
Fig. 3. Associations between dietary habits and plasma metabolites.
a, Summary of the associations between diet and metabolites. The bars represent dietary habits, with the bar order sorted by the number of significant associations. Association directions are colored differently: orange indicates a positive association, whereas blue indicates a negative association. The length of each bar indicates the number of significant associations at FDR < 0.05 (Spearman; two sided). b, Association between plasma quinic acid levels and coffee intake. The x and y axes indicate residuals of coffee intake and the metabolic abundance after correcting for covariates, respectively (n = 1,054 biologically independent samples). c, Association between plasma 2,6-dimethoxy-4-propylphenol levels and fish intake frequency (n = 1,054 biologically independent samples). The x and y axes refer to residuals of fish intake and metabolic abundance after correcting for covariates, respectively. d, Differential plasma levels of 1-methylhistidine between vegetarians and non-vegetarians (n = 1,054 biologically independent samples). The y axis indicates normalized residuals of metabolic abundance. The P value from the Wilcoxon test (two sided) is shown. The box plots show the median and first and third quartiles (25th and 75th percentiles) of the metabolite levels. The upper and lower whiskers extend to the largest and smallest value no further than 1.5× the IQR, respectively. Outliers are plotted individually. e, Association between the diet quality score predicted by the plasma metabolome (y axis) and the diet quality score assessed by the FFQ (x axis) (n = 237 biologically independent samples). In b, c and e, each gray dot represents one sample, the dark gray dashed line shows the linear regression line and the gray shading represents the 95% CI. In b and c, the association strength was assessed using Spearman correlation (two sided; the correlation coefficient and P value are reported) and in e, the prediction performance was assessed with linear regression (F-test; two sided; the adjusted r2 value and P value are reported).
Fig. 4
Fig. 4. Genetic associations of plasma metabolites.
a, Manhattan plot showing 48 independent mQTLs identified linking 44 metabolites and 40 genetic variants with P < 4.2 × 10−11 (Spearman; two sided). Representative genes for the SNPs with significant mQTLs are labeled. b, Association between a tag SNP (rs1495741) of the NAT2 gene and plasma AFMU levels. c, Association between a SNP (rs13100173) within the HYAL3 gene and plasma levels of N-acetylgalactosamine-4-sulfate. d, Association between a tag SNP (rs17789626) of the SCLT1 gene and plasma mizoribine levels. e, Differences in coffee intake between participants with different genotypes at rs1495741. f, Correlations between coffee intake and AFMU in participants with different genotypes at rs1495741. g, Differences in bacterial fatty acid β-oxidation pathway abundance in participants with different genotypes at rs67981690. h, Correlations between bacterial fatty acid β-oxidation pathway abundance and 5′-carboxy-γ-chromanol in participants with different genotypes at rs67981690. In be and g, the x axis indicates the genotype of the corresponding SNP and the y axis indicates normalized residuals of the corresponding metabolic abundance (n = 927 biologically independent samples). Each dot represents one sample. The box plots show the median and first and third quartiles (25th and 75th percentiles) of the metabolite levels. The upper and lower whiskers extend to the largest and smallest value no further than 1.5× the IQR, respectively. Outliers are plotted individually. The association strength is shown by the Spearman correlation coefficient and corresponding P value (two sided). In f and h, the x axis indicates the normalized abundance of coffee intake (f) or the bacterial fatty acid β-oxidation pathway (h) and the y axis indicates the normalized residuals of the corresponding metabolic abundance. Each dot represents one sample (n = 927 biologically independent samples). The lines indicate linear regressions for each genotype group separately. Areas with light gray shading indicate the 95% CI of the linear regression lines. The association strength per genotype is shown by the Spearman correlation and the corresponding P value (two sided).
Fig. 5
Fig. 5. Causal relationships between microbiomes and plasma metabolites as assessed by MR analysis.
a, Analysis of the association between adenosylcobalamin biosynthesis pathway abundance and 5-hydroxytryptophol levels. b, Glycogen biosynthesis pathway abundance versus 5-sulfo-1,3-benzenedicarboxylic acid levels. c, E. rectale abundance versus hydrogen sulfite levels. d, Veillonella parvula abundance versus 2,3-dehydrosilybin levels. In the top panels of ad, the x axis shows the SNP exposure effect, and the y axis shows the SNP outcome effect and each dot represents a SNP. Error bars represent the s.e. of each effect size. The bottom panels of ad, show the MR effect size (center dot) and 95% CI for the baseline (blue) and follow-up (green) datasets of the LLD1 cohort, estimated with the IVW MR approach (two sided) (n = 927 biologically independent samples at baseline and n = 311 biologically independent samples at follow-up).
Fig. 6
Fig. 6. Mediation analysis identifies linkages between the gut microbiome, metabolites and dietary habits.
a, Parallel coordinates chart showing the 133 mediation effects of plasma metabolites that were significant at FDR < 0.05. Shown are dietary habits (left), plasma metabolites (middle) and microbial factors (right). The curved lines connecting the panels indicate the mediation effects, with colors corresponding to different metabolites. freq., frequency; PFOR, pyruvate:ferredoxin oxidoreductase; OD, oxidative decarboxylation; HGD, 2-hydroxyglutaryl-CoA dehydratase; TPP, thiamine pyrophosphate. b, Parallel coordinates chart showing the 13 mediation effects of the microbiome that were significant at FDR < 0.05. Shown are dietary habits (left), microbial factors (middle) and plasma metabolites (right). For the microbial factors column, number ranges represent the genomic location of microbial structure variations (SVs) in kilobyte unit, and colons represent the detailed annotation of certain gutSMASH pathway. c, Analysis of the effect of coffee intake on the abundance of M. smithii as mediated by hippuric acid. d, Analysis of the effect of beer intake on the C. methylpentosum Rnf complex pathway as mediated by hulupinic acid. e, Analysis of the effect of fruit intake on urolithin B in plasma as mediated by a vSV in Ruminococcus species (300‒305 kb). In ce, the gray lines indicate the associations between the two factors, with corresponding Spearman coefficients and P values (two sided). Direct mediation is shown by a red arrow and reverse mediation is shown by a blue arrow. Corresponding P values from mediation analysis (two sided) are shown. inv., inverse; mdei., mediation.
Extended Data Fig. 1
Extended Data Fig. 1. Overview of study cohorts and analysis workflow.
a. Summary of cohorts and datasets involved in the analyses. b. Detailed analysis workflow of the present study.
Extended Data Fig. 2
Extended Data Fig. 2. Summary of plasma metabolites.
a. Number of metabolites per metabolic categories based on annotation in the HMDB database. The x-axis indicates number of metabolites per category. The number of metabolites is also shown. The y-axis indicates metabolic categories. b. Inter-correlation between metabolites in the LLD baseline samples. Rows and columns represent metabolites. Color scheme represents the Spearman correlation coefficient. c. Comparison of metabolite concentrations between un-targeted FI-MS and LC-MS/MS platforms. The x-axis indicates metabolic abundance determined by LC-MS/MS. The y-axis indicates metabolic abundance determined by FI-MS. Each gray dot represents one sample. The red dashed line is the best fit line of linear regression with 95% confidence interval (CI). Spearman correlation coefficient between two measurements and the corresponding P value (two-sided) are shown. d. Comparison of metabolite concentrations between un-targeted FI-MS and NMR platforms. The x-axis indicates metabolic abundance determined by NMR and the y-axis indicates metabolic abundance determined by FI-MS. Each gray dot represents one sample. The red dashed line is the best fit line of linear regression with 95% CI. Spearman correlation coefficients between two measurements and the corresponding P value (two-sided) are shown.
Extended Data Fig. 3
Extended Data Fig. 3. Comparison of the proportion of metabolite variation explained by diet, microbiome and genetics at two time points.
a. Proportion of the variation explained by diet. b. Proportion of the variation explained by microbiome. c. Proportion of the variation explained by genetics. Each dot represents a metabolite. The x-axis indicates explained variation at baseline and the y-axis indicates explained variation at follow-up. Similarity between the two time points was assessed using Spearman correlation (two-sided).
Extended Data Fig. 4
Extended Data Fig. 4. Tissue-specific gene expression analysis with FUMA.
All significant mQTLs observed in LLD1 were used to check the enrichment of differentially expressed gene (DEG) sets in a specific tissue compared to all other tissue types based on GTEx (version 8). Red bars represent liver and kidney. Blue bars represent other tissues. The x-axis is the different tissue type and the y-axis indicates the significance of the differential abundance of the gene in one tissue compared to other tissue types in terms of -log10 transformed P value (Fisher’s exact test, two-sided).
Extended Data Fig. 5
Extended Data Fig. 5. Leave-one-out sensitivity analysis for significant MR linkages.
Forest plots of MR leave-one-out sensitivity results (IVW method) for four significant bi-directional MR linkages in LLD1 and LLD1-follow-up. Dots represent the estimated effect size. Bars represent 95% confidence intervals. The x-axis indicates effect size of MR.
Extended Data Fig. 6
Extended Data Fig. 6. Metabolites associated with gutSMASH pathways.
a. Correlation between the microbial glycine cleavage pathway and plasma hippuric acid levels. b. Correlation between the microbial hydroxybenzoate to phenol pathway and plasma phenol sulfate levels. The upper part of each panel indicates the chemical transformation of the gutSMASH pathways. The lower part indicates the correlation between the pathway abundance (x-axis) and the plasma level of the corresponding metabolite (y-axis). Each dot represents one sample. The dark dashed line is the best fitted line of linear regression with 95% CI. Spearman correlation coefficient and the corresponding P value (two-sided) are also shown.

Similar articles

Cited by

References

    1. Suhre K, et al. Human metabolic individuality in biomedical and pharmaceutical research. Nature. 2011;477:54–60. - PMC - PubMed
    1. Shin SY, et al. An atlas of genetic influences on human blood metabolites. Nat. Genet. 2014;46:543–550. - PMC - PubMed
    1. Bar N, et al. A reference map of potential determinants for the human serum metabolome. Nature. 2020;588:135–140. - PubMed
    1. Asnicar F, et al. Microbiome connections with host metabolism and habitual diet from 1,098 deeply phenotyped individuals. Nat. Med. 2021;27:321–332. - PMC - PubMed
    1. Tigchelaar EF, et al. Cohort profile: LifeLines DEEP, a prospective, general population cohort study in the northern Netherlands: study design and baseline characteristics. BMJ Open. 2015;5:e006772. - PMC - PubMed

Publication types