. 2022 Oct;28(10):2038-2044.
doi: 10.1038/s41591-022-01973-2. Epub 2022 Oct 10.

The Burden of Proof studies: assessing the evidence of risk

Affiliations

The Burden of Proof studies: assessing the evidence of risk

Peng Zheng et al. Nat Med. 2022 Oct.

Abstract

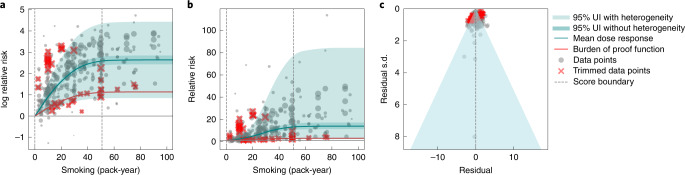
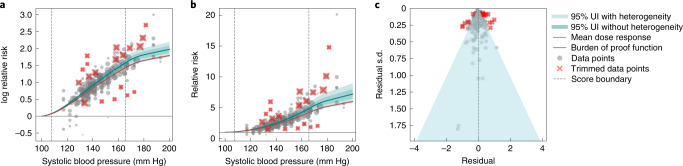
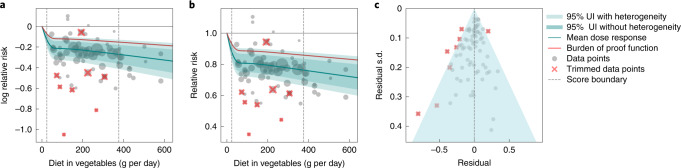
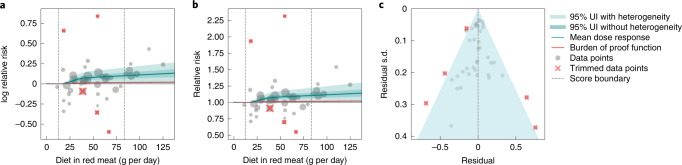
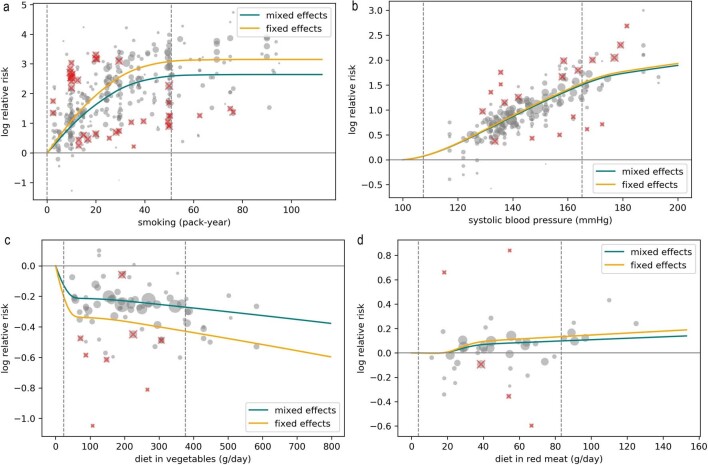
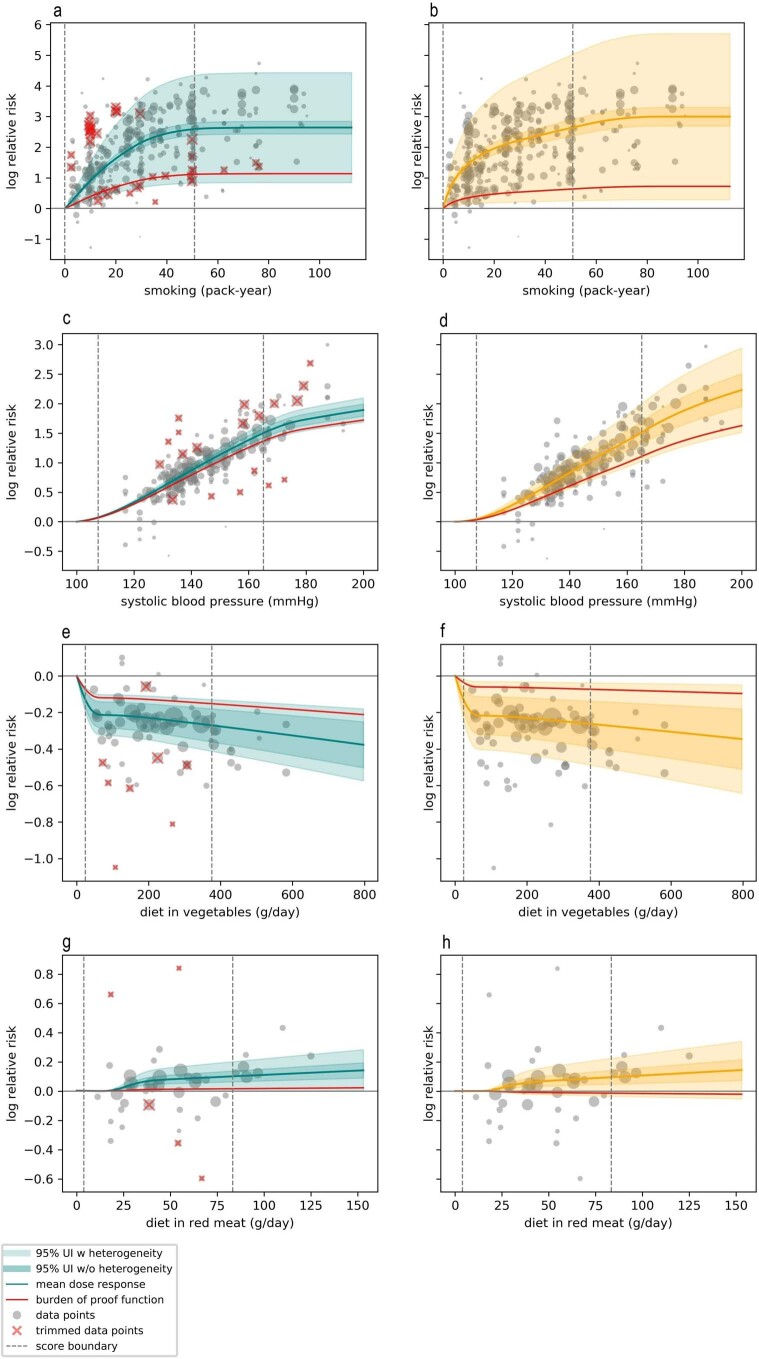
Exposure to risks throughout life results in a wide variety of outcomes. Objectively judging the relative impact of these risks on personal and population health is fundamental to individual survival and societal prosperity. Existing mechanisms to quantify and rank the magnitude of these myriad effects and the uncertainty in their estimation are largely subjective, leaving room for interpretation that can fuel academic controversy and add to confusion when communicating risk. We present a new suite of meta-analyses-termed the Burden of Proof studies-designed specifically to help evaluate these methodological issues objectively and quantitatively. Through this data-driven approach that complements existing systems, including GRADE and Cochrane Reviews, we aim to aggregate evidence across multiple studies and enable a quantitative comparison of risk-outcome pairs. We introduce the burden of proof risk function (BPRF), which estimates the level of risk closest to the null hypothesis that is consistent with available data. Here we illustrate the BPRF methodology for the evaluation of four exemplar risk-outcome pairs: smoking and lung cancer, systolic blood pressure and ischemic heart disease, vegetable consumption and ischemic heart disease, and unprocessed red meat consumption and ischemic heart disease. The strength of evidence for each relationship is assessed by computing and summarizing the BPRF, and then translating the summary to a simple star rating. The Burden of Proof methodology provides a consistent way to understand, evaluate and summarize evidence of risk across different risk-outcome pairs, and informs risk analysis conducted as part of the Global Burden of Diseases, Injuries, and Risk Factors Study.


Conflict of interest statement

The authors declare no competing interests.

Figures

Fig. 1
Fig. 1. Smoking and lung cancer.
a, Log relative risk function for smoking and lung cancer. b, Relative risk function for smoking and lung cancer. c, A modified funnel plot for smoking and lung cancer showing the residuals (relative to 0) on the x axis and the estimated standard deviation (s.d.) that includes reported s.d. and between-study heterogeneity on the y axis.
Fig. 2
Fig. 2. Systolic blood pressure and ischemic heart disease.
a, Log relative risk function for systolic blood pressure and ischemic heart disease. b, Relative risk function for systolic blood pressure and ischemic heart disease. c, A modified funnel plot for systolic blood pressure and ischemic heart disease showing the residuals (relative to 0) on the x axis and the estimated standard deviation (s.d.) that includes reported s.d. and between-study heterogeneity on the y axis.
Fig. 3
Fig. 3. Vegetable consumption and ischemic heart disease.
a, Log relative risk function for vegetable consumption and ischemic heart disease. b, Relative risk function for vegetable consumption and ischemic heart disease. c, A modified funnel plot for vegetable consumption and ischemic heart disease showing the residuals (relative to 0) on the x axis and the estimated standard deviation (s.d.) that includes reported s.d. and between-study heterogeneity on the y axis.
Fig. 4
Fig. 4. Unprocessed red meat consumption and ischemic heart disease.
a, Log relative risk function for unprocessed red meat consumption and ischemic heart disease. b, Relative risk function for unprocessed red meat consumption and ischemic heart disease. c, A modified funnel plot for unprocessed red meat consumption and ischemic heart disease showing the residuals (relative to 0) on the x axis and the estimated standard deviation (s.d.) that includes reported s.d. and between-study heterogeneity on the y axis.
Fig. 5
Fig. 5. Model validation for the data-rich scenario.
a, Estimated risk curves across 100 realizations for all methods for non-log linear risks. b, Estimated risk curves across 100 realizations for all methods for log linear risks. Mrtool is the method used in this paper. Dosresmeta_1stage_ncs refers to the Dosresmeta package with a natural cubic spline, while Dosresmeta_1stage_qs refers to the same tool with a quadratic spline. Dosresmeta_2stage refers to the the 2 stage approach in Dosresmeta. Metafor refers to a standard package that assumes a log linear relationship. (See ’Model validation’ for more details).
Extended Data Fig. 1
Extended Data Fig. 1. Scenario 1 mean risk curve.
a, estimated risk curves across 100 realizations for all methods, non-log linear. b, estimated risk curves across 100 realizations for all methods, log linear. c, RMSE results summarizing the errors of each method against simulated ground truth across different levels of true between-study heterogeneity, non-log linear risks. d, RMSE results summarizing the errors of each method against simulated ground truth across different levels of true between-study heterogeneity, log linear risks. e, log-scale RMSE results summarizing the errors of each method against simulated ground truth across different levels of true between-study heterogeneity, non-log linear risks. f, log-scale RMSE results summarizing the errors of each method against simulated ground truth across different levels of true between-study heterogeneity, log linear risks. MRSE = root mean squared error.
Extended Data Fig. 2
Extended Data Fig. 2. Scenario 1 burden of proof risk function.
a, estimated risk curves across 100 realizations for all methods, non-log linear. b, estimated risk curves across 100 realizations for all methods, log linear. c, RMSE results summarizing the errors of each method against simulated ground truth across different levels of true between-study heterogeneity, non-log linear risks. d, RMSE results summarizing the errors of each method against simulated ground truth across different levels of true between-study heterogeneity, log linear risks. e, log-scale RMSE results summarizing the errors of each method against simulated ground truth across different levels of true between-study heterogeneity, non-log linear risks. f, log-scale RMSE results summarizing the errors of each method against simulated ground truth across different levels of true between-study heterogeneity, log linear risks. MRSE = root mean squared error.
Extended Data Fig. 3
Extended Data Fig. 3. Scenario 2 mean risk curve.
a, estimated risk curves across 100 realizations for all methods, non-log linear. b, estimated risk curves across 100 realizations for all methods, log linear. c, RMSE results summarizing the errors of each method against simulated ground truth across different levels of true between-study heterogeneity, non-log linear risks. d, RMSE results summarizing the errors of each method against simulated ground truth across different levels of true between-study heterogeneity, log linear risks. e, log-scale RMSE results summarizing the errors of each method against simulated ground truth across different levels of true between-study heterogeneity, non-log linear risks. f, log-scale RMSE results summarizing the errors of each method against simulated ground truth across different levels of true between-study heterogeneity, log linear risks. MRSE = root mean squared error.
Extended Data Fig. 4
Extended Data Fig. 4. Scenario 2 burden of proof risk function.
a, estimated risk curves across 100 realizations for all methods, non-log linear. b, estimated risk curves across 100 realizations for all methods, log linear. c, RMSE results summarizing the errors of each method against simulated ground truth across different levels of true between-study heterogeneity, non-log linear risks. d, RMSE results summarizing the errors of each method against simulated ground truth across different levels of true between-study heterogeneity, log linear risks. e, log-scale RMSE results summarizing the errors of each method against simulated ground truth across different levels of true between-study heterogeneity, non-log linear risks. f, log-scale RMSE results summarizing the errors of each method against simulated ground truth across different levels of true between-study heterogeneity, log linear risks. MRSE = root mean squared error.
Extended Data Fig. 5
Extended Data Fig. 5. Scenario 3 mean risk curve.
a, estimated risk curves across 100 realizations for all methods, non-log linear. b, estimated risk curves across 100 realizations for all methods, log linear. c, RMSE results summarizing the errors of each method against simulated ground truth across different levels of true between-study heterogeneity, non-log linear risks. d, RMSE results summarizing the errors of each method against simulated ground truth across different levels of true between-study heterogeneity, log linear risks. e, log-scale RMSE results summarizing the errors of each method against simulated ground truth across different levels of true between-study heterogeneity, non-log linear risks. f, log-scale RMSE results summarizing the errors of each method against simulated ground truth across different levels of true between-study heterogeneity, log linear risks. MRSE = root mean squared error.
Extended Data Fig. 6
Extended Data Fig. 6. Scenario 3 burden of proof risk function.
a, estimated risk curves across 100 realizations for all methods, non-log linear. b, estimated risk curves across 100 realizations for all methods, log linear. c, RMSE results summarizing the errors of each method against simulated ground truth across different levels of true between-study heterogeneity, non-log linear risks. d, RMSE results summarizing the errors of each method against simulated ground truth across different levels of true between-study heterogeneity, log linear risks. e, log-scale RMSE results summarizing the errors of each method against simulated ground truth across different levels of true between-study heterogeneity, non-log linear risks. f, log-scale RMSE results summarizing the errors of each method against simulated ground truth across different levels of true between-study heterogeneity, log linear risks. MRSE = root mean squared error.
Extended Data Fig. 7
Extended Data Fig. 7. Simulation study for γ estimation as a function of the number of studies, using 500 realizations of each setting.
a, 5th and 95th percentiles of the estimated γ values. b, violin plots to illustrate how the number of studies affects γ estimation. In both panels, it is clear that using FIM improves the quality of γ estimation. FIM = Fischer information matrix. γ = between-study heterogeneity parameter.
Extended Data Fig. 8
Extended Data Fig. 8. Sensitivity study results comparing mixed effects model (teal) and fixed effects model (orange).
a, smoking and lung cancer. b, systolic blood pressure and ischemic heart disease. c, vegetables and ischemic heart disease. d, unprocessed red meat and ischemic heart disease.
Extended Data Fig. 9
Extended Data Fig. 9. Sensitivity study results comparing trimming (teal) and no trimming (orange).
a, smoking and lung cancer, with trimming. b, smoking and lung cancer, no trimming. c, systolic blood pressure and ischemic heart disease, with trimming. d, systolic blood pressure and ischemic heart disease, no trimming. e, vegetables and ischemic heart disease, with trimming. f, vegetables and ischemic heart disease, no trimming. g, unprocessed red meat and ischemic heart disease, with trimming. h, unprocessed red meat and ischemic heart disease, no trimming.

Similar articles

Cited by

References

    1. Murray CJL, et al. Global burden of 87 risk factors in 204 countries and territories, 1990–2019: a systematic analysis for the Global Burden of Disease Study 2019. Lancet. 2020;396:1223–1249. doi: 10.1016/S0140-6736(20)30752-2. - DOI - PMC - PubMed
    1. Murray CJ, Lopez AD. Global mortality, disability, and the contribution of risk factors: Global Burden of Disease Study. Lancet. 1997;349:1436–1442. doi: 10.1016/S0140-6736(96)07495-8. - DOI - PubMed
    1. Murray CJ, Ezzati M, Lopez AD, Rodgers A, Vander Hoorn S. Comparative quantification of health risks: conceptual framework and methodological issues. Popul. Health Metr. 2003;1:1. doi: 10.1186/1478-7954-1-1. - DOI - PMC - PubMed
    1. Stanley K. Evaluation of randomized controlled trials. Circulation. 2007;115:1819–1822. doi: 10.1161/CIRCULATIONAHA.106.618603. - DOI - PubMed
    1. Deaton A, Cartwright N. Understanding and misunderstanding randomized controlled trials. Soc. Sci. Med. 2018;210:2–21. doi: 10.1016/j.socscimed.2017.12.005. - DOI - PMC - PubMed

Publication types