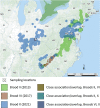
Gut microbiome insights from 16S rRNA analysis of 17-year periodical cicadas (Hemiptera: Magicicada spp.) Broods II, VI, and X
- PMID: 36217008
- PMCID: PMC9550851
- DOI: 10.1038/s41598-022-20527-7
Gut microbiome insights from 16S rRNA analysis of 17-year periodical cicadas (Hemiptera: Magicicada spp.) Broods II, VI, and X
Abstract
Periodical cicadas (Hemiptera: Magicicada) have coevolved with obligate bacteriome-inhabiting microbial symbionts, yet little is known about gut microbial symbiont composition or differences in composition among allochronic Magicicada broods (year classes) which emerge parapatrically or allopatrically in the eastern United States. Here, 16S rRNA amplicon sequencing was performed to determine gut bacterial community profiles of three periodical broods, including II (Connecticut and Virginia, 2013), VI (North Carolina, 2017), and X (Maryland, 2021, and an early emerging nymph collected in Ohio, 2017). Results showed similarities among all nymphal gut microbiomes and between morphologically distinct 17-year Magicicada, namely Magicicada septendecim (Broods II and VI) and 17-year Magicicada cassini (Brood X) providing evidence of a core microbiome, distinct from the microbiome of burrow soil inhabited by the nymphs. Generally, phyla Bacteroidetes [Bacteroidota] (> 50% relative abundance), Actinobacteria [Actinomycetota], or Proteobacteria [Pseudomonadota] represented the core. Acidobacteria and genera Cupriavidus, Mesorhizobium, and Delftia were prevalent in nymphs but less frequent in adults. The primary obligate endosymbiont, Sulcia (Bacteroidetes), was dominant amongst core genera detected. Chryseobacterium were common in Broods VI and X. Chitinophaga, Arthrobacter, and Renibacterium were common in Brood X, and Pedobacter were common to nymphs of Broods II and VI. Further taxonomic assignment of unclassified Alphaproteobacteria sequencing reads allowed for detection of multiple copies of the Hodgkinia 16S rRNA gene, distinguishable as separate operational taxonomic units present simultaneously. As major emergences of the broods examined here occur at 17-year intervals, this study will provide a valuable comparative baseline in this era of a changing climate.
© 2022. The Author(s).
Conflict of interest statement
The authors declare the following potential competing interest with respect to the research, authorship, and/or publication of this article: Dr. Nur Hasan was employed by EzBiome Inc. at the time this work was completed. Specific roles of the authors are articulated in the ‘author contributions’ section. This does not alter our decision to publish or adherence to policies on sharing data and materials. All other co-authors do not have any competing interest.
Figures


Similar articles
-
Idiosyncratic Genome Degradation in a Bacterial Endosymbiont of Periodical Cicadas.Curr Biol. 2017 Nov 20;27(22):3568-3575.e3. doi: 10.1016/j.cub.2017.10.008. Epub 2017 Nov 9. Curr Biol. 2017. PMID: 29129532 Free PMC article.
-
The periodical cicada four-year acceleration hypothesis revisited and the polyphyletic nature of Brood V, including an updated crowd-source enhanced map (Hemiptera: Cicadidae: Magicicada).PeerJ. 2018 Jul 31;6:e5282. doi: 10.7717/peerj.5282. eCollection 2018. PeerJ. 2018. PMID: 30083444 Free PMC article.
-
Mitochondrial Genomics Reveals Shared Phylogeographic Patterns and Demographic History among Three Periodical Cicada Species Groups.Mol Biol Evol. 2019 Jun 1;36(6):1187-1200. doi: 10.1093/molbev/msz051. Mol Biol Evol. 2019. PMID: 30850829 Free PMC article.
-
The 2021 emergence of Brood X periodical cicadas Magicicada spp. (Hemiptera: Cicadidae) in Georgia, United States of America.Environ Entomol. 2023 Apr 18;52(2):270-278. doi: 10.1093/ee/nvad018. Environ Entomol. 2023. PMID: 36897278
-
Do adult Magicicada (Hemiptera: Cicadidae) feed? Historical perspectives and evidence from molecular gut content analysis.J Insect Sci. 2023 Sep 1;23(5):13. doi: 10.1093/jisesa/iead082. J Insect Sci. 2023. PMID: 37850668 Free PMC article.
Cited by
-
Bacterial Community Survey of Wolbachia-Infected Parthenogenetic Parasitoid Trichogramma pretiosum (Hymenoptera: Trichogrammatidae) Treated with Antibiotics and High Temperature.Int J Mol Sci. 2023 May 8;24(9):8448. doi: 10.3390/ijms24098448. Int J Mol Sci. 2023. PMID: 37176154 Free PMC article.
-
Impact of intraspecific variation in insect microbiomes on host phenotype and evolution.ISME J. 2023 Nov;17(11):1798-1807. doi: 10.1038/s41396-023-01500-2. Epub 2023 Sep 2. ISME J. 2023. PMID: 37660231 Free PMC article. Review.
-
Bacterial Diversity in Aquacultured African Catfish and Source Pond Water in Buea, Cameroon.Int J Microbiol. 2025 May 19;2025:6132661. doi: 10.1155/ijm/6132661. eCollection 2025. Int J Microbiol. 2025. PMID: 40420853 Free PMC article.
-
Lack of host phylogenetic structure in the gut bacterial communities of New Zealand cicadas and their interspecific hybrids.Sci Rep. 2022 Nov 29;12(1):20559. doi: 10.1038/s41598-022-24723-3. Sci Rep. 2022. PMID: 36446872 Free PMC article.
-
An insight into the vaginal microbiome of infertile women in Bangladesh using metagenomic approach.Front Cell Infect Microbiol. 2024 Jul 9;14:1390088. doi: 10.3389/fcimb.2024.1390088. eCollection 2024. Front Cell Infect Microbiol. 2024. PMID: 39040604 Free PMC article.
References
Publication types
MeSH terms
Substances
Grants and funding
LinkOut - more resources
Full Text Sources
Research Materials
Miscellaneous

