. 2022 Oct 10;5(1):1081.
doi: 10.1038/s42003-022-04030-3.

Dynamic SARS-CoV-2 emergence algorithm for rationally-designed logical next-generation vaccines

Affiliations

Dynamic SARS-CoV-2 emergence algorithm for rationally-designed logical next-generation vaccines

David P Maison et al. Commun Biol. .

Abstract

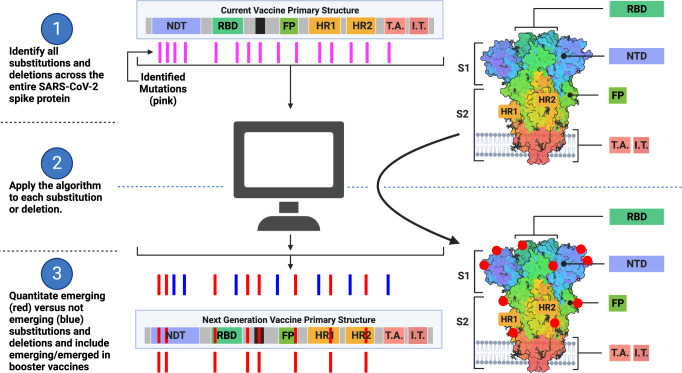
SARS-CoV-2 worldwide spread and evolution has resulted in variants containing mutations resulting in immune evasive epitopes that decrease vaccine efficacy. We acquired SARS-CoV-2 positive clinical samples and compared the worldwide emerged spike mutations from Variants of Concern/Interest, and developed an algorithm for monitoring the evolution of SARS-CoV-2 in the context of vaccines and monoclonal antibodies. The algorithm partitions logarithmic-transformed prevalence data monthly and Pearson's correlation determines exponential emergence of amino acid substitutions (AAS) and lineages. The SARS-CoV-2 genome evaluation indicated 49 mutations, with 44 resulting in AAS. Nine of the ten most worldwide prevalent (>70%) spike protein changes have Pearson's coefficient r > 0.9. The tenth, D614G, has a prevalence >99% and r-value of 0.67. The resulting algorithm is based on the patterns these ten substitutions elucidated. The strong positive correlation of the emerged spike protein changes and algorithmic predictive value can be harnessed in designing vaccines with relevant immunogenic epitopes. Monitoring, next-generation vaccine design, and mAb clinical efficacy must keep up with SARS-CoV-2 evolution, as the virus is predicted to remain endemic.


Conflict of interest statement

The authors declare no competing interests.

Figures

Fig. 1
Fig. 1. Cytopathic Effect and Growth Kinetics of SARS-CoV-2, Isolate USA-HI498 2020.
The figure shows time-lapse cell images of VeroE6 cells infected with SARS-CoV-2 isolate USA-HI498 2020 at different time points, demonstrating the cytopathic effect (CPE) induced by the virus at multiplicity of infection (MOI) 1. a 0 h, b 12 h, c 24 h, and d 48 h. Scale bar equals 200 µm. e Genomic equivalent (GEQ) of SARS-CoV-2, isolate USA-WA-1/2020 with N1 primers. f GEQ of SARS-CoV-2, isolate USA-WA-1/2020 with N2 primers. g GEQ of SARS-CoV-2, isolate USA-WA-1/2020 with RdRp primers. h GEQ of SARS-CoV-2, isolate USA-HI498/2020 with N1 primers. i GEQ of SARS-CoV-2, isolate USA-HI498/2020 with N2 primers. j GEQ of SARS-CoV-2, isolate USA-HI498/2020 with RdRp primers. k Growth kinetics of SARS-CoV-2 isolates USA-HI498/2020 and USA-WA-1/2020 at multiplicity of infection (MOI) 1 and 0.1 over 48 h using the N1 GEQ (e and h). l Growth kinetics of SARS-CoV-2 isolates USA-HI498/2020 (yellow and green) and USA-WA-1/2020 (blue and red) at MOI 1 and 0.1 over 48 h using the N2 GEQ (f and i). m Growth kinetics of SARS-CoV-2 isolates USA-HI498/2020 and USA-WA-1/2020 at MOI 1 and 0.1 over 48 h using the RdRp GEQ (g and j).
Fig. 2
Fig. 2. Pearson’s correlation on logarithmically-transformed prevalence ratios of SARS-CoV-2 variant of concern, variants of interest, and other lineages.
This figure demonstrates the quantitation of SARS-CoV-2 variants of concern, variants of interest, and other lineages. The emergence and disappearance of variants/lineages of SARS-CoV-2 is evaluated by Pearson’s correlation of logarithmic transformation prevalence data (n = 1,479,378 biologically independent samples). Variants are displayed in order of decreasing r value. Pearson’s correlation of logarithmic transformed prevalence versus time as a interval value for SARS-CoV-2 lineages a P.1, b B.1.617.2, c B.1.617.1, d B.1.351, e B.1.1.7, f B.1.429, g B.1.427, h B.1.525, i P.2, j B.1.243, k B.1.1.298, and l B.1.1. Graphs were generated using open-source RStudio version 1.3.1093 (R version 4.0.3) and the ggplot2 package under MIT + license (https://cran.r-project.org/web/packages/ggplot2/index.html). Graphs were compiled and the final figure created using Biorender.com.
Fig. 3
Fig. 3. Pearson’s correlation on logarithmically-transformed prevalence ratios of the omicron SARS-CoV-2 variant of concern.
This figure demonstrates the quantitation of the Omicron SARS-CoV-2 variant of concern. The emergence is shown for the collective variant (B.1.1.529+BA.*). The partitions are demonstrated in daily partitions (a) (n = 1,077,671 biologically independent samples), weekly partitions (b) (n = 1,375,929 biologically independent samples), bi-weekly partitions (c) (n = 1,582,268 biologically independent samples), and the prototype monthly partition (d) (n = 2,154,954 biologically independent samples). Each lineage and partition displays the date the VOC would be classified “of interest” (orange/orange dashed-lines) and “of concern” (red/red dashed-lines) as defined by the Algorithm. Additionally, the cut-off date for submissions demonstrates when the classification would occur. *p < 0.05, **p < 0.005, ***p < 0.0005, ****p < 0.00005. Graphs were generated using open-source R and the ggplot2 package under MIT + license (https://cran.r-project.org/web/packages/ggplot2/index.html). Graphs were compiled and the final figure generated using Biorender.com.
Fig. 4
Fig. 4. SARS-CoV-2 spike protein domains and relation to B and T cell epitopes, variant amino acid substitutions, and vaccine amino acid substitutions.
This figure demonstrates the evolution of the SARS-CoV-2 variants by depicting the location of the variants substitutions and deletions in the context of spike domains and epitopes. a Cartoon rendering of SARS-CoV-2 and the 1273 amino acid long spike protein overlay onto the color-coded crystallographic structure determined by electron microscopy (PBD ID: 6VXX-PDB). The individual protein domains are color-coded: N-terminal domain (NTD) (light purple) (residues 14-305), receptor-binding domain (RBD) (teal green) (residues 319-541), furin (F) (residues 682-685), fusion protein (FP) (green) (residues 788-806), heptad repeat 1 (HR1) (orange) (residues 912-984), heptad repeat 2 (HR2) (orange) (residues 1163-1213), transmembrane anchor (TM) (light pink) (1213-1237), and intracellular tail domain (IT) (dark pink) (1237-1273). b Two-dimensional layout of the spike protein and domains with the addition of the S1/S2 furin cleavage site (RRA/R) (682-685) (black). c In silico predicted B and T cell epitope loci revealing 393 in silico B and T cell epitopes mapped here individually as a yellow boxes i–xiii. Amino acid substitutions present in the corresponding variant shown in pink boxes in comparison to the reference sequence NC_045512. (i) B.1.243 Hawaii; (ii) B.1.1.7 United Kingdom; (iii) B.1.351 South Africa; (iv) B.1.1 Nigeria; (v) B.1.1.298 Denmark; (vi) B.1.427 and B.1.429 California; (vii) P.1 Brazil; (viii) P.2 Brazil; (ix) B.1.617.1 India; (x) B.1.617.2 India; (xi) B.1.525 United Kingdom/Nigeria; (xii) B.1.1.529+BA.* South Africa; (xiii) Pfizer and Moderna mRNA sequences with artificially added substitutions K986P and V987P; (xiii) Novavax and Janssen mRNA sequences with artificially added substitutions R682S/Q, R683Q, R685G/Q, K986P, and V987P. Adapted from “An In-depth Look into the Structure of the SARS-CoV-2 Spike Glycoprotein”, by BioRender.com (2021). Retrieved from https://app.biorender.com/biorender-templates.
Fig. 5
Fig. 5. Pearson’s correlation of logarithmically-transformed prevalence ratios of the most emergent SARS-CoV-2 mutations of concern and interest selected via the algorithm.
This figure shows the graphical representation of the logarithmically-transformed prevalence data used to calculate the Pearson’s correlation (n = 1,483,155 biologically independent samples) of each of the twenty most emerged (of concern) and emergent (of interest) spike protein substitutions and deletions. The substitutions and deletions of concern here are in order of decreasing r value, and each has a unique alphabet identifier (a) P681H, (b) ΔV70, (c) ΔH69, (d) N501Y, (e) S982A, (f) D1118H, (g) T716, (h) A570D, (i) ΔY144, and (j) D614G. The algorithm uses the monthly prevalence data from these ten spike protein substitutions and deletions, and they are the most concerning of all spike changes. The substitutions and deletions of interest here are in order of decreasing r value and each unique substitution or deletion is denoted by a letter of the English alphabet, (k) E484K, (l) T478K, (m) P26S, (n) L452R, (o) A701V, (p) W152C, (q) T95I, (r) H655Y, (s) S13I, and (t) D138Y. Graphs were generated using open-source R and the ggplot2 package under MIT + license (https://cran.r-project.org/web/packages/ggplot2/index.html). Graphs were compiled and the final figure created using Biorender.com.
Fig. 6
Fig. 6. Phylogenetic Tree of all B.1.243 Lineage Sequences Worldwide.
This figure displays the phylogenetic tree used to determine the origin of the B.1.243 sequences used in this study. We use 8822 SARS-CoV-2 B.1.243 whole-genome sequences published in the Global Initiative on Sharing Avian Influenza Data (GISAID) and GenBank as of April 12, 2021 to define the origin. From the 8822, 4273 had ambiguous nucleotides between the 5’ and 3’ untranslated regions as determined using multiple alignment using fast Fourier transform (MAFFT). Further, 1588 were duplicate sequences and eight had duplicate identifications as determined by the sRNA Toolbox. Therefore, the final tree was constructed using FastTree in Geneious Prime 2021.1.1 (http://www.geneious.com) from 2953 unique and unambiguous SARS-CoV-2 whole-genome sequences. The HI498 (purple text) origin is defined as New Mexico (blue text) and the HI-708 (purple text) origin is defined as California (blue text). Map prepared with R and usmaps package with a GNU General Public License (GPL), v3 (https://cran.r-project.org/package=usmap). Created with BioRender.com.
Fig. 7
Fig. 7. Applying the Algorithm to Vaccine Design.
The model displays how the algorithm would lead to the design of next-generation vaccines based on the S gene. Part one of the model identifies all SARS-CoV-2 variants or genomic mutations and spike amino acid substitutions and deletions (represented as pink lines) based on the worldwide sequence databases GISAID and GenBank. The current vaccine design as it translates into proteins is depicted in the top center and top right. Part two of the model will apply the quantitative analysis and algorithm described in this report to each of the protein changes identified in part one. The quantitative analysis determines emergence via logarithmic transformation of prevalence and Pearson’s correlation. The algorithm then applies criteria to the quantitative analysis and previous months prevalence for determining which changes are likely to be in the majority of SARS-CoV-2 for incorporation in the next-generation vaccine. Part three of the model determines which substitutions and deletions are exponentially emerging or emerged (red lines) and which are not (blue lines). From part three, the mRNA sequence of vaccines can then incorporate the emerging and emerged mutations so that the folded protein (bottom right) will contain the protein changes (red dots) most prevalent worldwide by the time the next-generation vaccine is manufactured and administered. As a result, these substitutions and deletions will present the most appropriate epitopes of the SARS-CoV-2 spike protein to vaccine recipients. Adapted from “An In-depth Look into the Structure of the SARS-CoV2 Spike Glycoprotein”, by BioRender.com (2021). Created with BioRender.com.

References

    1. CDC. Cases, Data, and Surveillance. Centers for Disease Control and Prevention. 2020. https://www.cdc.gov/coronavirus/2019-ncov/cases-updates/variant-surveill...
    1. Shu Y, McCauley J. GISAID: Global initiative on sharing all influenza data – from vision to reality. Eur. Surveill. 2017;22:30494. doi: 10.2807/1560-7917.ES.2017.22.13.30494. - DOI - PMC - PubMed
    1. Korber B, et al. Tracking changes in SARS-CoV-2 spike: evidence that D614G increases infectivity of the COVID-19 Virus. Cell (Camb.). 2020;182:812–827.e19. doi: 10.1016/j.cell.2020.06.043. - DOI - PMC - PubMed
    1. Tracking SARS-CoV-2 variants. World Health Organization. Published July 6, 2021. Accessed July 16, 2021. https://www.who.int/activities/tracking-SARS-CoV-2-variants
    1. Cha, L., Le, T., Ve’e, T., Ah Soon, N. T. & Tseng, W. Pacific Islanders in the Era of COVID-19: an Overlooked Community in Need. J Racial and Ethnic Health Disparities. Published online June, 2021. 10.1007/s40615-021-01075-8 - PMC - PubMed

Publication types