. 2023 Jan;41(1):140-149.
doi: 10.1038/s41587-022-01475-z. Epub 2022 Oct 10.

A proteome-scale map of the SARS-CoV-2-human contactome

Dae-Kyum Kim #  1   2   3   4   5 Benjamin Weller #  6 Chung-Wen Lin #  6 Dayag Sheykhkarimli #  1   2   3   4 Jennifer J Knapp #  1   2   3   4 Guillaume Dugied #  7   8   9 Andreas Zanzoni  10 Carles Pons  11 Marie J Tofaute  12 Sibusiso B Maseko  13 Kerstin Spirohn  4   14   15 Florent Laval  4   13   14   15   16   17 Luke Lambourne  4   14   15 Nishka Kishore  1   2   3   4 Ashyad Rayhan  1   2   3   4 Mayra Sauer  6 Veronika Young  6 Hridi Halder  6 Nora Marín-de la Rosa  6 Oxana Pogoutse  1   2   3   4 Alexandra Strobel  6 Patrick Schwehn  6 Roujia Li  1   2   3   4 Simin T Rothballer  6 Melina Altmann  6 Patricia Cassonnet  7   8   9 Atina G Coté  1   2   3   4 Lena Elorduy Vergara  6 Isaiah Hazelwood  1   2   3   4 Betty B Liu  1   2   3   4 Maria Nguyen  1   2   3   4 Ramakrishnan Pandiarajan  6 Bushra Dohai  6 Patricia A Rodriguez Coloma  6 Juline Poirson  1   2   18 Paolo Giuliana  1   2   3   4 Luc Willems  16   17 Mikko Taipale  1   2   13 Yves Jacob  7   8   9 Tong Hao  4   14   15 David E Hill  4   14   15 Christine Brun  10   19 Jean-Claude Twizere  4   13   16 Daniel Krappmann  12 Matthias Heinig  20   21 Claudia Falter  6 Patrick Aloy  11   22 Caroline Demeret  23   24   25 Marc Vidal  26   27 Michael A Calderwood  28   29   30 Frederick P Roth  31   32   33   34   35 Pascal Falter-Braun  36   37
Affiliations

A proteome-scale map of the SARS-CoV-2-human contactome

Dae-Kyum Kim et al. Nat Biotechnol. 2023 Jan.

Abstract

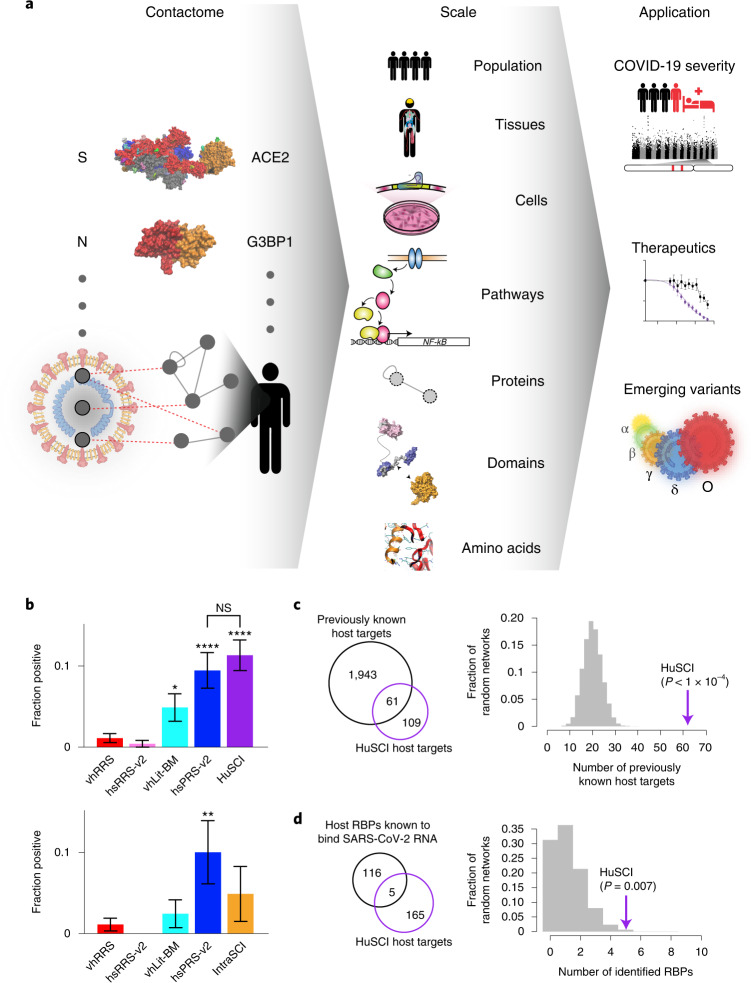
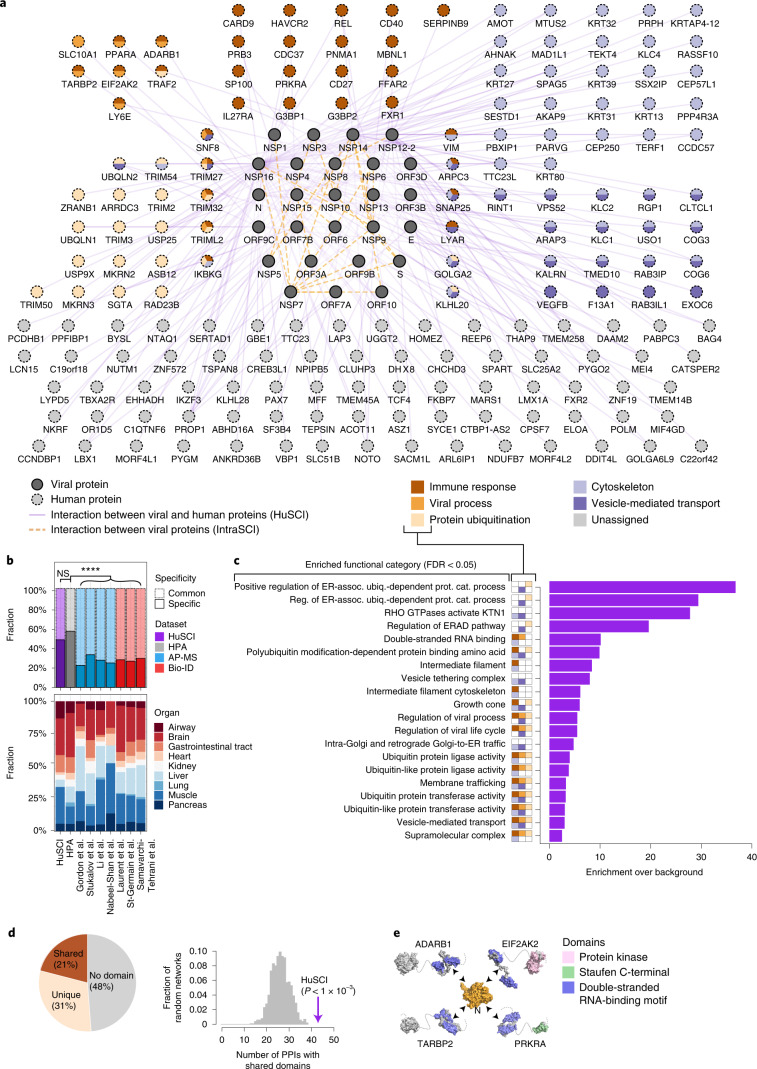
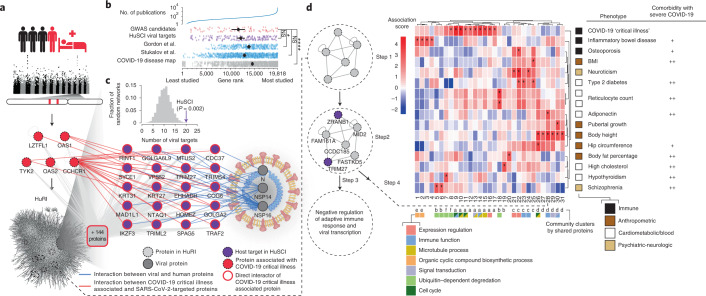
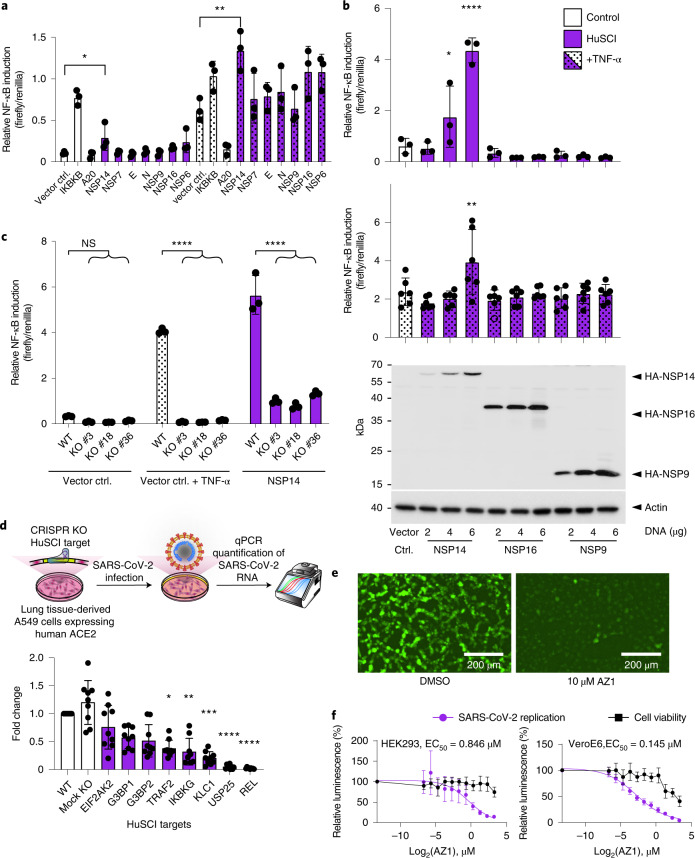
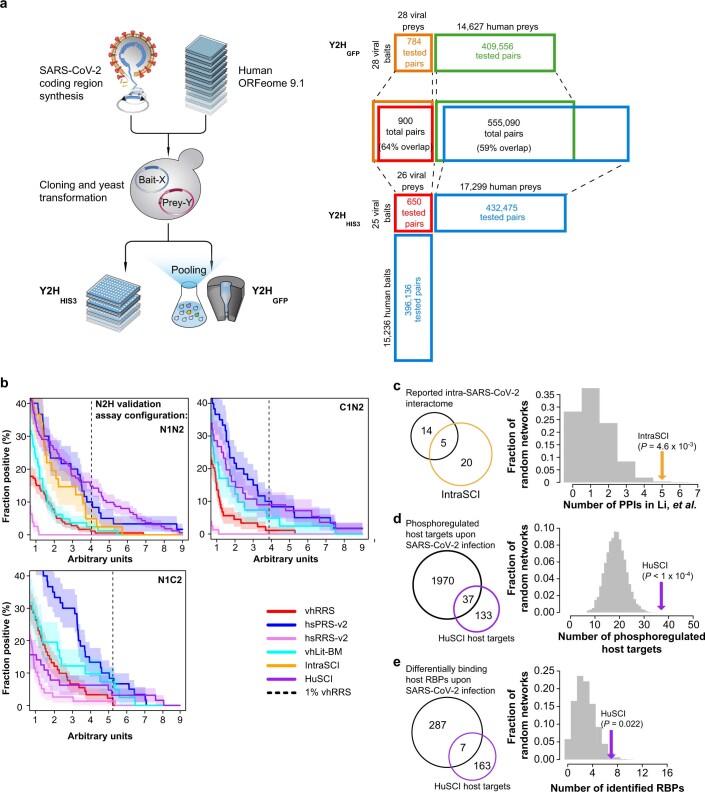
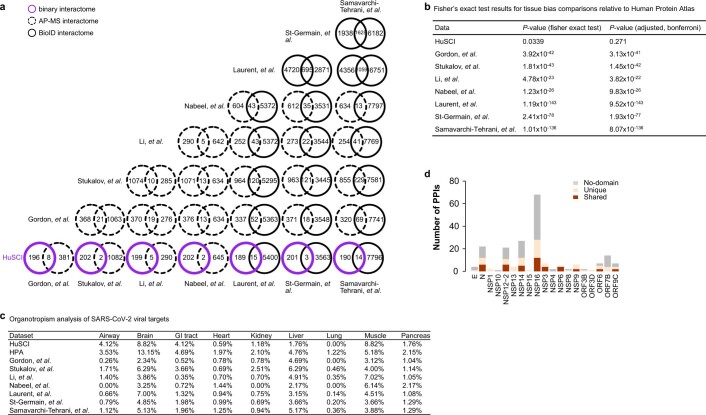
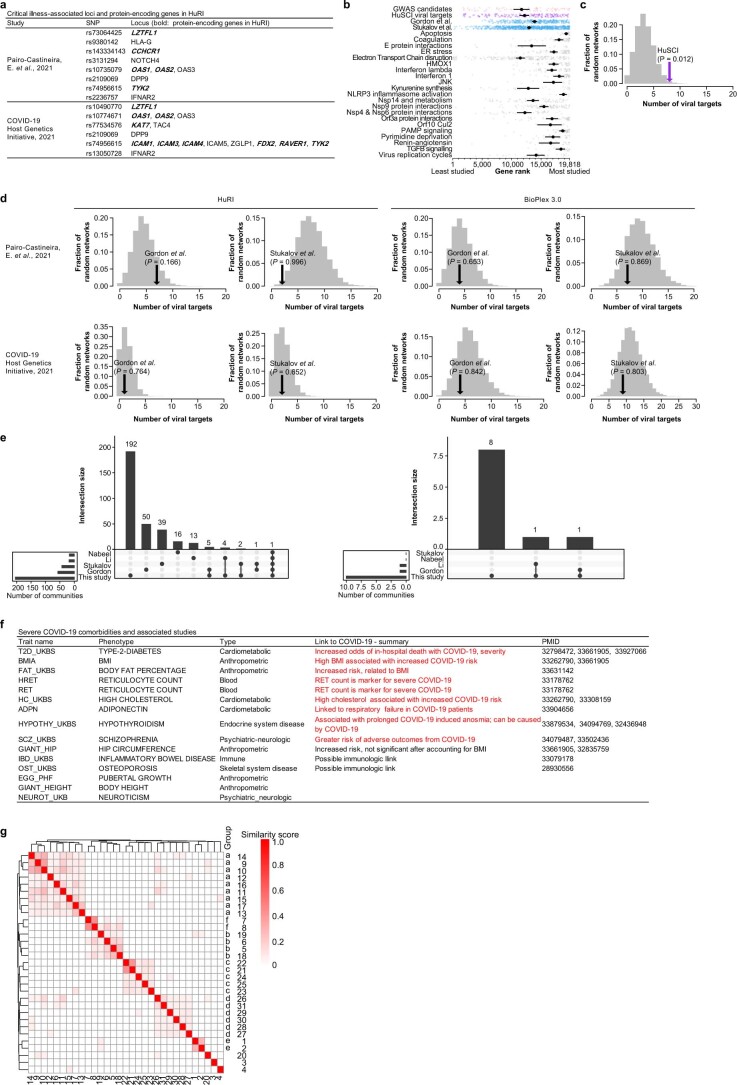
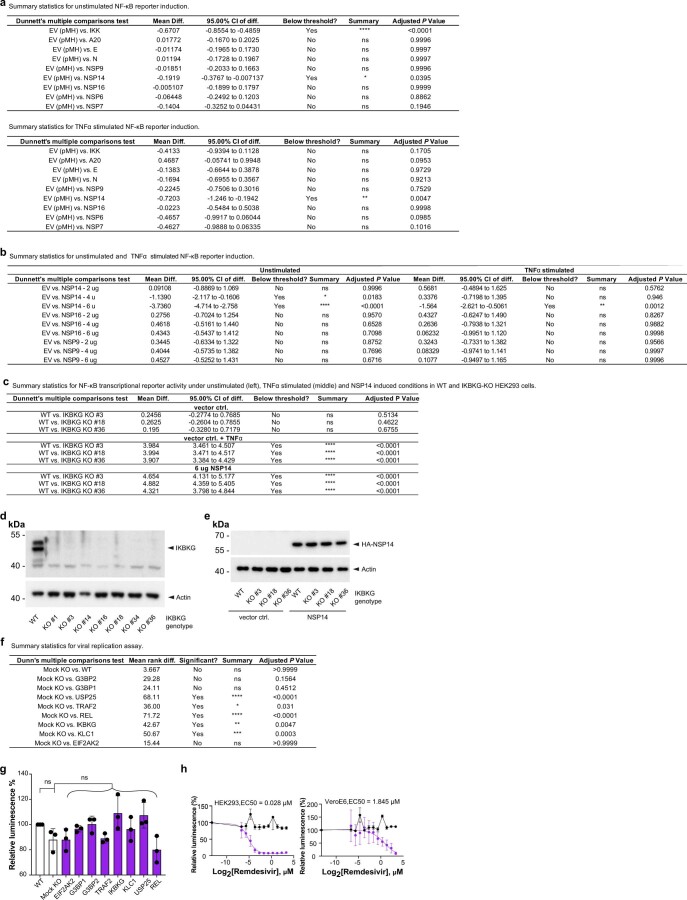
Understanding the mechanisms of coronavirus disease 2019 (COVID-19) disease severity to efficiently design therapies for emerging virus variants remains an urgent challenge of the ongoing pandemic. Infection and immune reactions are mediated by direct contacts between viral molecules and the host proteome, and the vast majority of these virus-host contacts (the 'contactome') have not been identified. Here, we present a systematic contactome map of severe acute respiratory syndrome coronavirus 2 (SARS-CoV-2) with the human host encompassing more than 200 binary virus-host and intraviral protein-protein interactions. We find that host proteins genetically associated with comorbidities of severe illness and long COVID are enriched in SARS-CoV-2 targeted network communities. Evaluating contactome-derived hypotheses, we demonstrate that viral NSP14 activates nuclear factor κB (NF-κB)-dependent transcription, even in the presence of cytokine signaling. Moreover, for several tested host proteins, genetic knock-down substantially reduces viral replication. Additionally, we show for USP25 that this effect is phenocopied by the small-molecule inhibitor AZ1. Our results connect viral proteins to human genetic architecture for COVID-19 severity and offer potential therapeutic targets.


Conflict of interest statement

F.R. and M.V. are advisors and shareholders of SeqWell, Inc. (Beverly, MA, USA).

Figures

Fig. 1
Fig. 1. Generation and quality assessment of HuSCI.
a, The contactome, the sum of physical contacts between viral and host macromolecules, mediates cellular perturbations that enable viral replication and cause disease manifestations. N, nucleocapsid protein; S, spike protein. b, Orthogonal validation; fraction of pairs that are yN2H-positive in HuSCI (top, n = 282 pair configurations representing 148 HuSCIs interaction pairs) and IntraSCI (bottom, n = 41 pair configurations for 25 IntraSCI interaction pairs), in the benchmark positive control sets hsPRS-v2 (n = 180 pair configurations for 60 interaction pairs) and vhLit-BM (n = 164 pair configurations for 40 interaction pairs), and negative control sets hsRRS-v2 (n = 234 pair configurations for 78 protein pairs) and vhRRS (n = 360 pair configurations for 178 protein pairs). Asterisks indicate significant differences from vhRRS benchmark (*P = 0.023; **P = 0.005; ****P = 1.57 × 10⁻⁵ hsPRS-v2, P = 1.02 × 10⁻⁷ HuSCI; NS, not significant; two-sided Fisher’s exact test; center, proportion of positives; error bars, standard error of proportion). Precise P values for all dataset pairs, biological repeats and n for each test are shown in Supplementary Table 3. c, Overlap of SARS-CoV-2 targets identified in HuSCI with previously identified target proteins of other viruses (left) and actual overlap (arrow) compared to n = 10,000 randomized control networks (right) (one-sided, empirical P < 0.0001). d, Host targets identified in HuSCI overlap with RNA-binding proteins (RBPs) bound to SARS-CoV-2 RNA upon infection (left) and actual overlap (arrow) compared to n = 10,000 randomized control networks (right) (one-sided, empirical P = 0.007).
Fig. 2
Fig. 2. Network representation and functional assessment of HuSCI.
a, Combined HuSCI and IntraSCI networks. Node colors of human proteins represent broad enriched functions as indicated in legend. Node labels for human proteins correspond to approved HGNC symbols; accession identifiers and descriptions are listed in Supplementary Table 1. b, Proportion of host targets in common and specific expression groups in all (top) and in SARS-CoV-2 RNA-positive organs (bottom) across eight datasets: purple, HuSCI; gray, HPA; blue, AP-MS datasets from Gordon et al.,, Stukalov et al., Li et al. and Nabeel-Shah et al.; red, BioID datasets from Laurent et al., St-Germain et al. and Samavarchi-Tehrani et al.. Two-sided Fisher’s exact test, Bonferroni adjusted P < 0.0001. Full statistical details and exact P values are listed in Supplementary Table 4. c, Functions enriched among host proteins found in HuSCI (P = 0.05, Fisher’s exact test with FDR correction). Broad functional groups are indicated in small boxes according to legend in panel a. Full statistical details are listed in Supplementary Table 5. ER-assoc. ubiq.-dependent prot. cat., Endoplasmic reticulum-associated ubiquitin-dependent protein catabolic. d, Proportion of virus–host interactions in which the human protein has domains that are present in other interactors of the viral protein (shared), not present in other interactors of the viral protein (unique) or no annotated domains (left) and number of shared-domain interactions in HuSCI (arrow) compared to n = 1,000 randomized control networks (gray distribution) (right). One-sided empirical P < 0.001. PPI, protein-protein interactions. e, Exemplary ‘shared-domain interaction’ between the viral nucleocapsid protein and four interactors containing a double-stranded RNA-binding motif. Domain colors according to legend; gray parts lack domain annotations.
Fig. 3
Fig. 3. HuSCI host targets link to genetic variation for severe COVID-19.
a, HuRI interactors (gray nodes) of COVID-19 ‘critical illness proteins’ loci (seed, red nodes) include a significant (P = 0.0009, empirical test) number of direct SARS-CoV-2 targeted proteins (purple nodes). A total of 144 additional seed protein interactors are not resolved individually. Node and edge colors according to legend. b, Genes in indicated COVID-19 datasets ranked across the human genome by number of publications. Number of publications is indicated by the top panel on log scale. Asterisks indicate significant differences relative to COVID-19-associated genes,; NS, P = 1 (HuSCI) and P = 0.36 (Stuckalov et al.); *P = 0.047; ****P = 0.000014, two-sided Mann–Whitney U test, Bonferroni correction, from top to bottom: n = 45, 170, 383, 876 and 849; error bars are 95% confidence intervals of the mean, calculated by 1,000 bootstrap samples. c, Virus-interactor enrichment: number of direct SARS-CoV-2 protein interacting HuSCI proteins in the subnetwork formed by proteins encoded by seed proteins, and their first-level interactors (arrow) compared to n = 10,000 randomized control networks (gray distribution). d, Of 3,603 communities in Human Reference Interactome (HuRI) with ≥4 members (step 1), 204 are significantly targeted by SARS-CoV-2 (two-sided nominal P < 0.05; Fisher’s exact test) (step 2); Gene Ontology (GO) enrichment identifies functions associated with each community (step 3); and MAGMA identifies 31 communities significantly associated with human traits (FDR < 0.05) (step 4), the great majority of which are COVID-19 comorbidities. Example community 28 is significantly targeted by SARS-CoV-2 in HuSCI (two-sided P = 0.0078; Fisher’s exact test, uncorrected) and enriched for negative regulation of adaptive immune response and viral transcription. Functional descriptors in squared boxes according to legend (Supplementary Table 8); relation of indicated traits to COVID-19 is indicated in rightmost column as general link (+) (e.g., via immunity) and clinical evidence for modulation of diseases symptoms and risk for severe or long COVID ( + + ; Extended Data Fig. 3f). BMI, body mass index.
Fig. 4
Fig. 4. Validation of pathways and host targets.
a, Relative NF-κB transcriptional reporter activity in unstimulated (left) and TNF-α-stimulated conditions (one-way analysis of variance (ANOVA) with Dunnett’s multiple comparisons test, P = 0.0395 and P = 0.0047, respectively). Error bars represent standard deviation of the mean, n = 3. b, Relative NF-κB transcriptional reporter activity at different amounts of transfected viral protein-encoding plasmid in unstimulated (top) and TNF-α-stimulated conditions (middle) (one-way ANOVA with Dunnett’s multiple comparisons test: *P = 0.0183, ****P < 0.0001 and **P = 0.0012, respectively). Error bars represent standard deviation of the mean, n = 3 (top) and n = 6 (middle). Representative anti-hemagglutinin (HA) western blot demonstrating levels of tagged viral protein in titration experiments relative to actin beta (ACTB) loading controls (bottom). a and b, Precise P values, biological repeats and n for each test are shown in Extended Data Fig. 4 and Supplementary Table 9. c, Relative NF-κB transcriptional reporter activity under unstimulated (left), TNF-α-stimulated (middle) and NSP14-induced conditions in wild-type (WT) and three independent IKBKG KO clones of HEK293 cells (two-way ANOVA with Dunnett’s multiple comparisons test). Error bars represent standard deviation of the mean, n = 3. Precise P values, biological repeats and n for each test are shown in Extended Data Fig. 4. ctrl., control. d, Schematic of viral replication assay (top) and viral replication in wild-type, mock KO and CRISPR KOs of the indicated HuSCI host targets (bottom) (Kruskal–Wallis with Dunn’s multiple comparisons test, * P = 0.031, ** P = 0.0047, *** P = 0.0003, **** P < 0.0001, respectively). Error bars represent standard deviation of the mean, n = 9. Precise P values, biological repeats and n for each test are shown in Extended Data Fig. 4 and Supplementary Table 10. e, Fluorescence microscopy images showing replication of icSARS-CoV-2-mNeonGreen in infected Vero E6 cells treated with 10 µM AZ1 or solvent (DMSO, dimethylsulfoxide). f, Cell viability and relative replication of icSARS-CoV-2-nanoluciferase in HEK293 cells (left) and Vero E6 cells (right) at different concentrations of AZ1. The EC50 values were calculated with a variable slope model. Error bars represent standard deviation of the mean, n = 8 biological repeats and full analysis in Supplementary Table 11. Source data
Extended Data Fig. 1
Extended Data Fig. 1. Screening space, orthogonal validation and comparison of HuSCI and IntraSCI to previous SARS-CoV-2 related datasets.
a, Schematic of the experimental contactome mapping pipelines (left) and screening space for each of the two parallel Y2HHIS and Y2HGFP screens (right). Proportional overlap is given relative to the union of protein pairs tested by both methods. b, Rate at which interactions are detected by yN2H for HuSCI and IntraSCI, as well as positive (hsPRS-v2 and vhLit-BM) and negative (hsRRS-v2 and vhRRS) benchmark sets, across stringency thresholds, error band: standard error of proportion. c, Left: overlap of previously identified intraviral SARS-CoV-2 interactions and IntraSCI; right: actual overlap (arrow) compared to n = 10,000 randomized control networks. One-sided, empirical P = 0.0046. d, Left: overlap of host targets identified in HuSCI and differentially phosphorylated proteins following infection by SARS-CoV-2; right: actual overlap (arrow) compared to n = 10,000 randomized control networks. One-sided, empirical P < 0.0001. e, Left: overlap of host targets identified in HuSCI and RNA Binding Proteins (RBPs) demonstrating differential RNA binding upon SARS-CoV-2 infection; right: actual overlap (arrow) compared to n = 10,000 randomized control networks. One-sided, empirical P = 0.022.
Extended Data Fig. 2
Extended Data Fig. 2. Comparison of HuSCI with SARS-CoV-2 association and proximity datasets.
a, Overlap of viral-human protein pairs between HuSCI, four AP-MS and three BioID based datasets (Gordon et al.,, Stukalov et al., Li et al., Nabeel-Shah et al., Laurent et al., St-Germain et al., Samavarchi-Tehrani et al.). b, Statistical analysis of representation of host targets in common and specific expression groups from datasets in (a), compared to the Human Protein Atlas22 (HPA) (Fisher’s exact test with Bonferroni correction). c, Organotropism analysis across SARS-CoV-2 infected organs from datasets in (b). The percentage of genes within each dataset with specific organotropism (‘tissue-specific’ expression in tissues grouped into organ systems). b and c, Full analysis is shown in Supplementary Table 4. d, Proportion of HuSCI host interactors per SARS-CoV-2 protein in which the human protein has: domains present in other interactors of the viral protein (shared); domains not present in other interactors of the viral protein (unique); no structural domains. Full analysis is shown in Supplementary Table 6.
Extended Data Fig. 3
Extended Data Fig. 3. Traits associated with COVID-19 severity.
a, Table showing COVID-19 critical illness associated loci from two GWAS meta-analyses,. Locus-associated proteins present in HuRI are marked in bold. b, Genes in indicated COVID-19 datasets ranked across the human genome by number of publications. Error bars are 95% confidence intervals of the mean, calculated by 1,000 bootstrap samples (from top to bottom n = 45, 170, 383, 876, 29, 75, 25, 71, 233, 46, 49, 45, 15, 33, 10, 71, 97, 47, 58, 9, 46, 22, 20, 23, 39). c, Virus-interactor enrichment in contactome: number of direct SARS-CoV-2 protein interacting HuSCI proteins in a HuRI subnetwork formed by proteins encoded by COVID-19 critical illness associated loci (marked in bold in table (a)) and their first level interactors (arrow) compared to n = 10,000 randomized control networks (gray distribution). One-sided, empirical P = 0.012. d, Virus-interactor enrichment in co-complex associations: number of SARS-CoV-2 associated human proteins in two AP-MS based studies, in a subnetwork formed by proteins encoded by COVID-19 critical illness associated loci, (marked in bold in table in (a)) and their first level interactors (arrow) either in HuRI or BioPlex 3.0. The comparisons are against n = 10,000 randomized control networks (gray distribution). One-sided, empirical P values are shown for each dataset. e, Upset plots showing number of communities targeted by SARS-CoV-2 (left) and associated with severe COVID-19 (right) in HuSCI and AP-MS based datasets. f, Table showing 15 traits for genetic variation identified within targeted network communities. An association with severe COVID-19 comorbidities is indicated, as well as trait references: T2D_UKBS, BMIA,, FAT_UKBS, HRET, RET, HC_UKBS,, ADPN, HYPOTHY_UKBS,,, SCZ_UKBS,, GIANT_HIP,, IBD_UKBS, OST_UKBS, EGG_PHF, GIANT_HEIGHT, NEUROT_UKB. g, Grouping of 31 network communities with significantly associated traits shown in Fig. 3d by protein membership measured by Jaccard similarity according to legend.
Extended Data Fig. 4
Extended Data Fig. 4. Effect of viral proteins on NF-κB reporter activity and of viral interactors on viral replication.
a, Tables showing statistical details of NF-κB transcriptional reporter activity in the absence and presence of selected viral proteins under unstimulated (top) and TNFα stimulated (bottom) conditions. One-way ANOVA with Dunnett’s multiple comparisons test, n = 3, adjusted P values are shown. b, Table showing statistical details of NF-κB transcriptional reporter activity at different amounts of transfected viral protein-encoded plasmid under unstimulated (left) and TNFα stimulated conditions (right). One-way ANOVA with Dunnett’s multiple comparisons test, n = 3 and n = 6, respectively, adjusted P values are shown. a and b, Raw data and full analysis is shown in Supplementary Table 9. c, Table showing statistical details of NF-κB transcriptional reporter activity under unstimulated (left), TNFα-stimulated (middle) and NSP14-induced conditions in WT and IKBKG KO HEK293 cells (two-way ANOVA with Dunnett’s multiple comparisons test, n = 3), adjusted P values are shown. d, Representative anti-IKBKG (top) western blot demonstrating levels of IKBKG in WT and three independent IKBKG knockout clones of HEK293 cells relative to actin beta (ACTB) loading controls (bottom). e, Representative anti-hemagglutinin (HA) western blot demonstrating levels of tagged NSP14 protein in NF-κB induction experiments relative to actin beta (ACTB) loading controls (bottom). f, Table showing statistical details of viral replication in wild-type, mock KO and CRISPR KOs of the indicated HuSCI host proteins. Kruskal-Wallis with Dunn’s multiple comparisons test, n = 9. Adjusted P values are shown. g, Cell viability of mock KO and CRISPR KOs of the indicated HuSCI host proteins relative to WT cells. Kruskal-Wallis with Dunn’s multiple comparisons test, n = 3. Adjusted, Fisher’s exact P values are shown. f and g, Raw data, Fisher’s exact P values, and full analysis is shown in Supplementary Table 10. h, Cell viability and relative replication of icSARS-CoV-2-nanoluciferase in HEK293 cells (left) and Vero E6 cells (right) at different concentrations of remdesivir. The EC50 values shown for each cell line were calculated with a variable slope model. Error bars: standard deviation of the mean, n = 3 biological repeats, full analysis in Supplementary Table 11. Source data
Extended Data Fig. 5
Extended Data Fig. 5. Mutations of SARS-CoV-2 variants affect specific interactions with uSCI host targets.
a, Y2HHIS3 yeast growth on selective plates of HuSCI interaction partners as DB-fusion proteins tested against AD-fusion of the SARS-CoV-2 Nucleocapsid (AD-N) protein (Wuhan-Hu1, original screen) and AD-N containing ‘lineage defining’ amino acid substitutions: D3L and S235F (α-strain), T205I (β-strain), or P80R (γ-strain). Shown is one representative result of 5 repeats. b, Y2HHIS3 yeast growth on selective plates of HuSCI interaction partners as DB-fusion proteins tested against AD-fusion of the SARS-CoV-2 Envelope (AD-E) protein (Wuhan-Hu1, original screen) or AD-E containing ‘lineage defining’ substitution P71L (β-strain). Shown is one representative Y2HHIS3 result on selective media, out of 2 repeats. a - c, Black circles indicate changes in yeast colony growth between human proteins tested against viral variant ORFs or the originally screened Wuhan strain ORFs observed consistently across all repeats. c, AD-empty control plate for a, b indicates lack of autoactivation. d, Layout of DB-fusion HuSCI interactors (purple) tested with AD fusion SARS-CoV-2 proteins or AD-empty control, respectively in a - c. N/A indicates human interactors.

References

    1. Nalbandian A, et al. Post-acute COVID-19 syndrome. Nat. Med. 2021;27:601–615. doi: 10.1038/s41591-021-01283-z. - DOI - PMC - PubMed
    1. Yu H, et al. High-quality binary protein interaction map of the yeast interactome network. Science. 2008;322:104–110. doi: 10.1126/science.1158684. - DOI - PMC - PubMed
    1. Altmann M, et al. Extensive signal integration by the phytohormone protein network. Nature. 2020;583:271–276. doi: 10.1038/s41586-020-2460-0. - DOI - PubMed
    1. Yachie N, et al. Pooled-matrix protein interaction screens using Barcode Fusion Genetics. Mol. Syst. Biol. 2016;12:863. doi: 10.15252/msb.20156660. - DOI - PMC - PubMed
    1. Braun P, et al. An experimentally derived confidence score for binary protein-protein interactions. Nat. Methods. 2009;6:91–97. doi: 10.1038/nmeth.1281. - DOI - PMC - PubMed

Publication types

Grants and funding