. 2022 Oct;4(10):1369-1401.
doi: 10.1038/s42255-022-00640-7. Epub 2022 Oct 10.

The aldolase inhibitor aldometanib mimics glucose starvation to activate lysosomal AMPK

Affiliations

The aldolase inhibitor aldometanib mimics glucose starvation to activate lysosomal AMPK

Chen-Song Zhang et al. Nat Metab. 2022 Oct.

Abstract

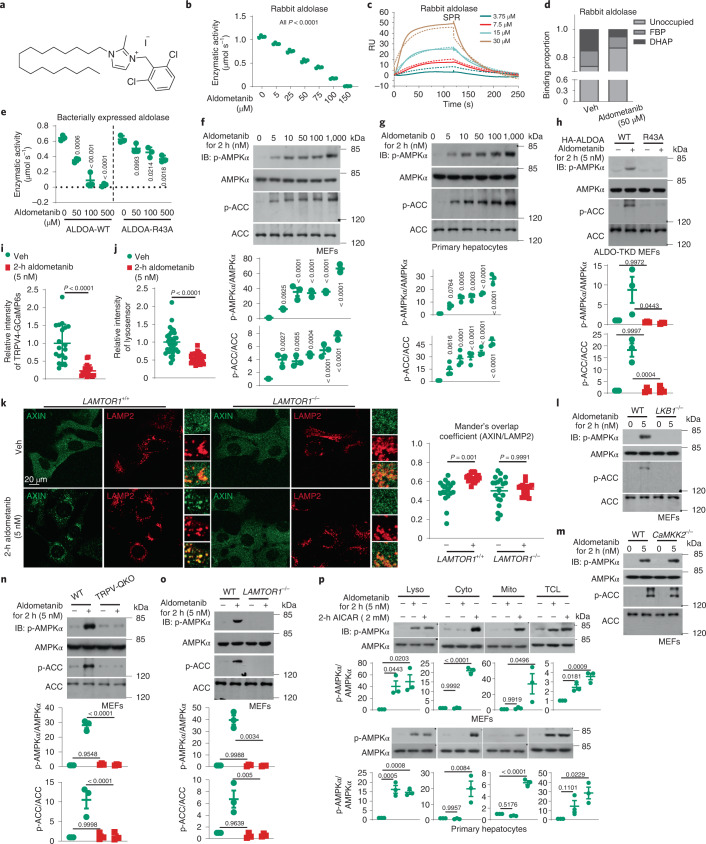
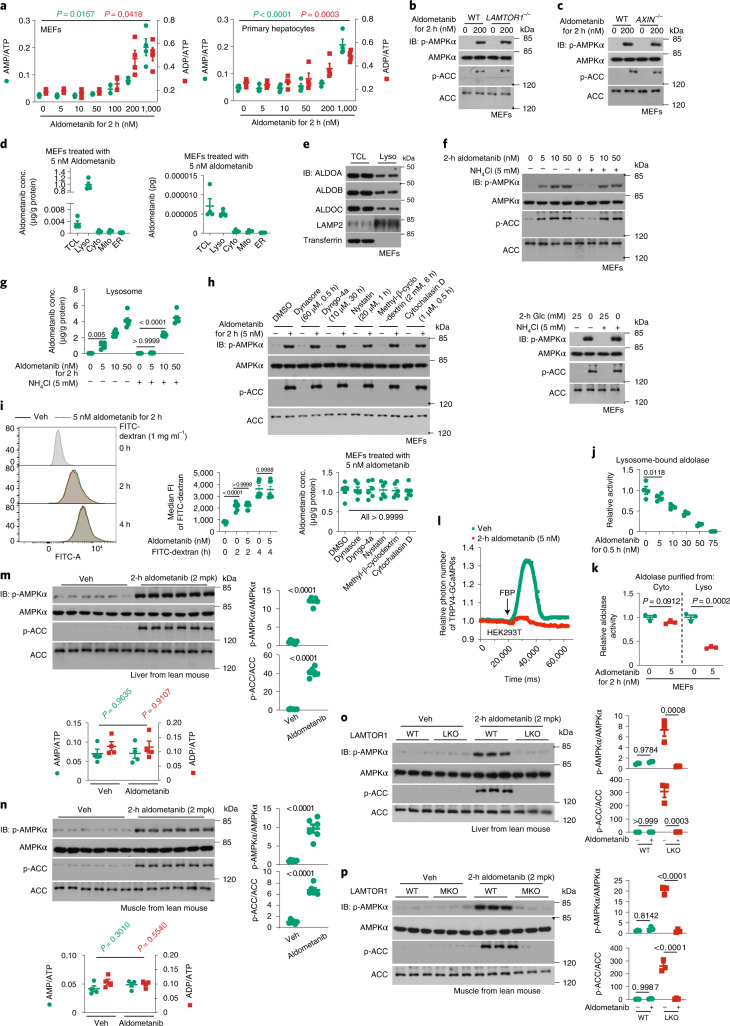
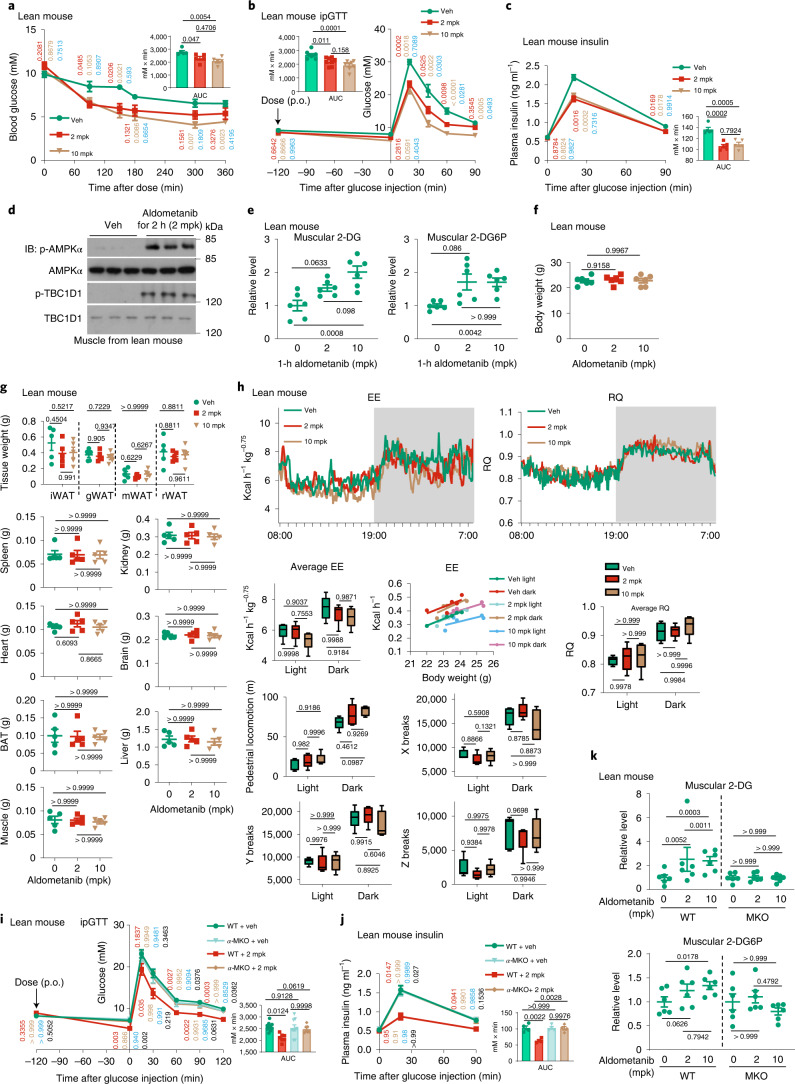
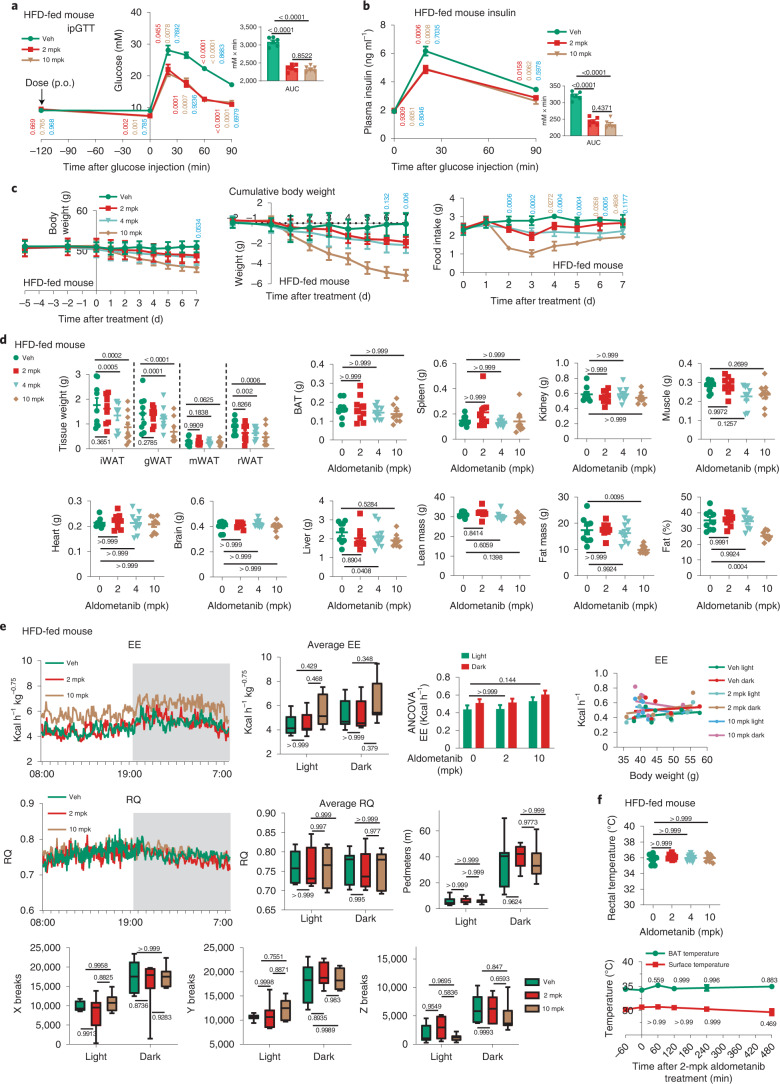
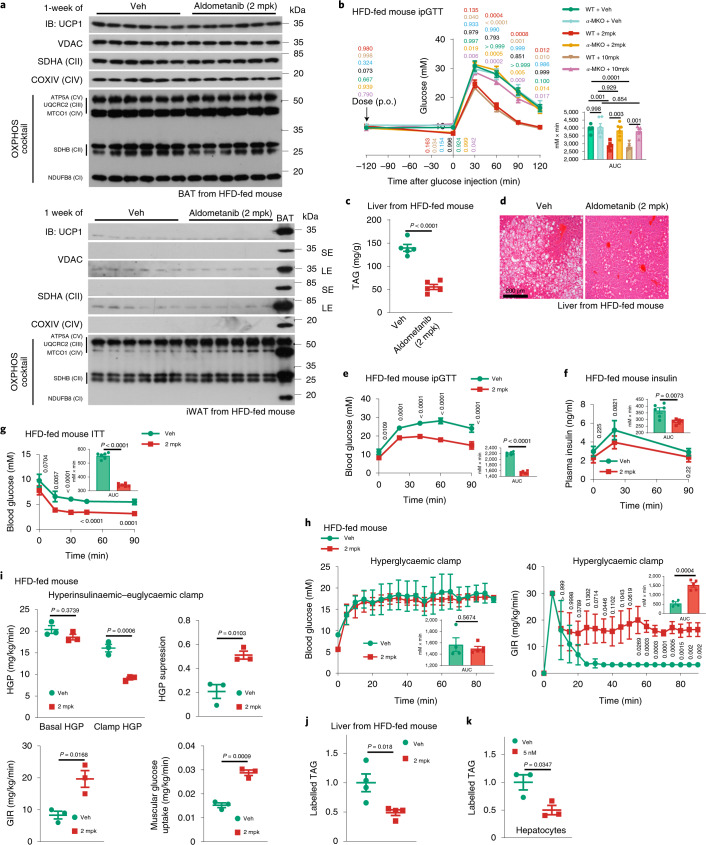
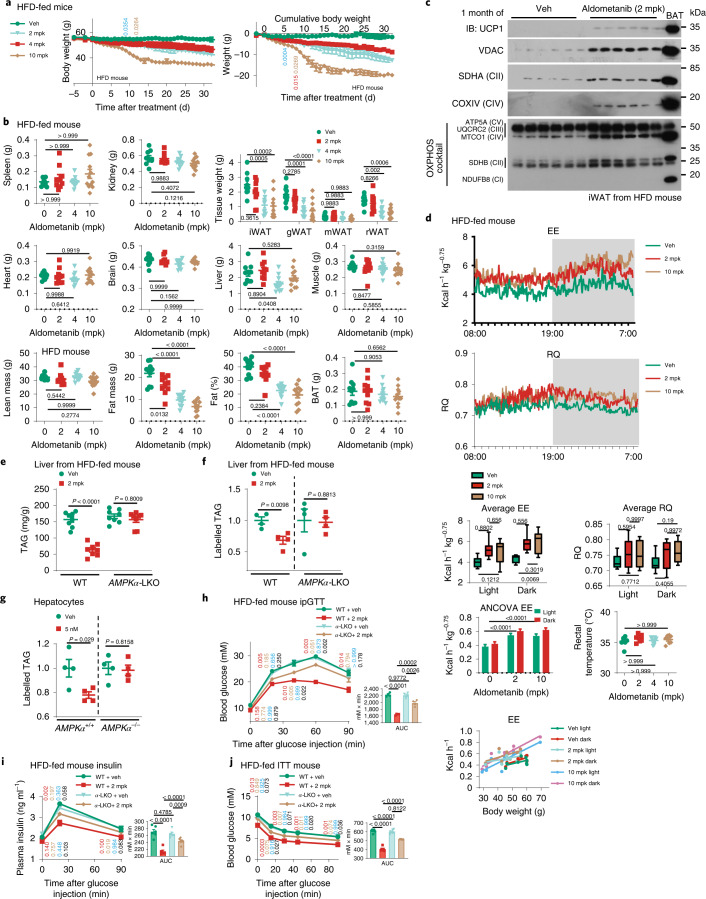
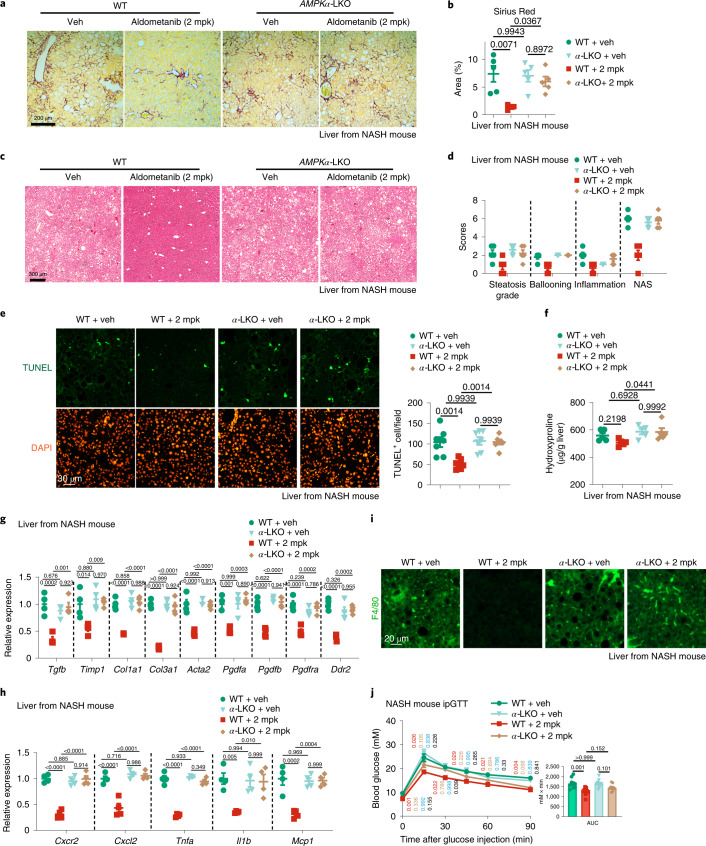
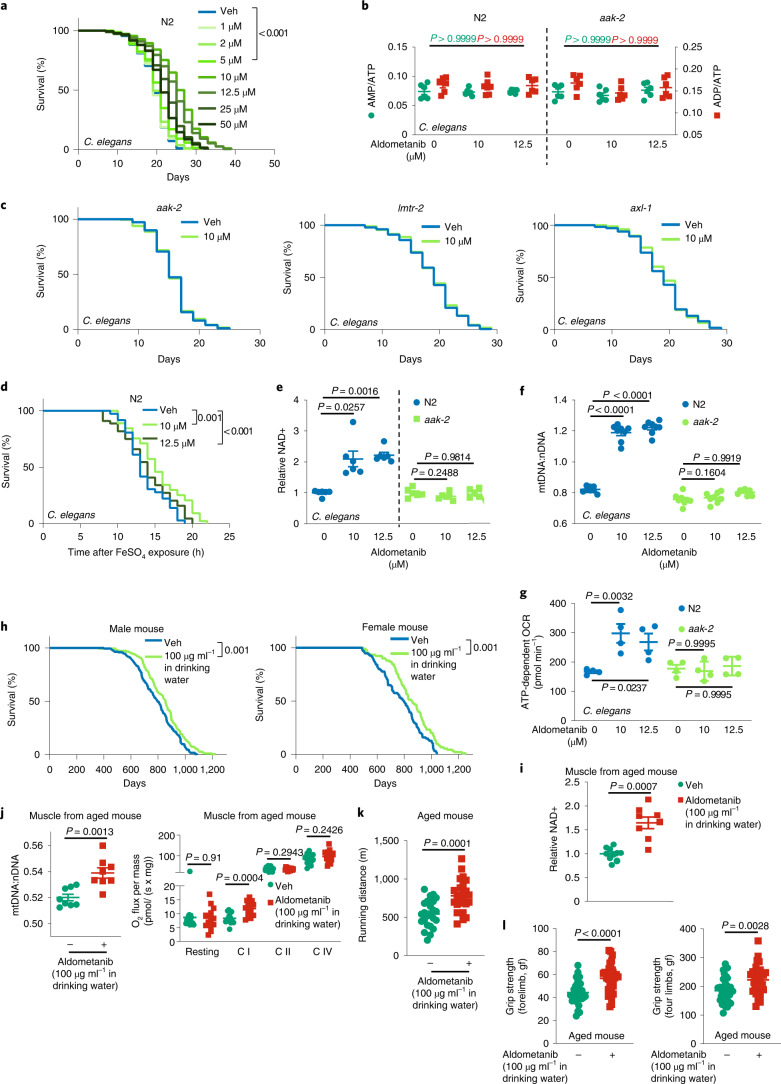
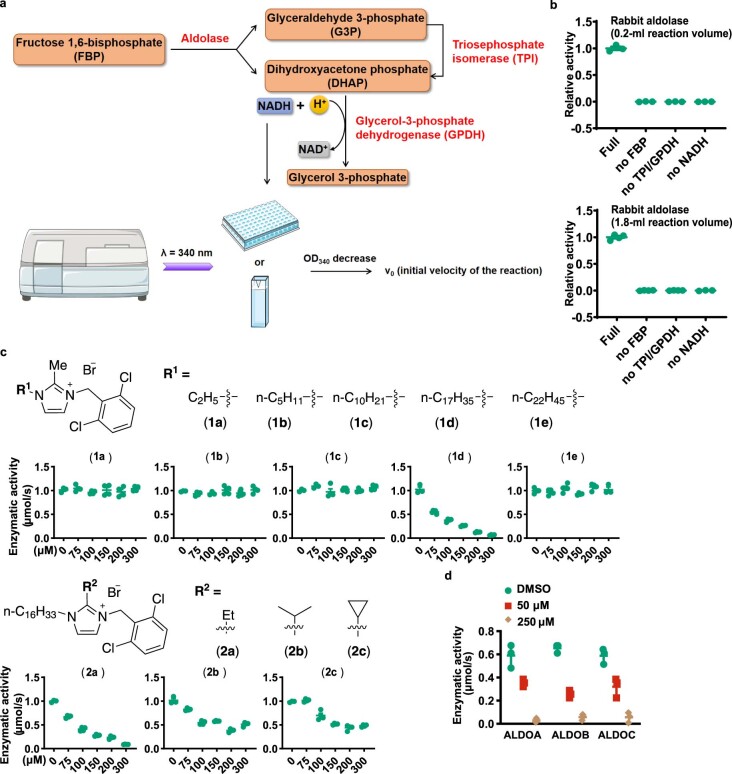
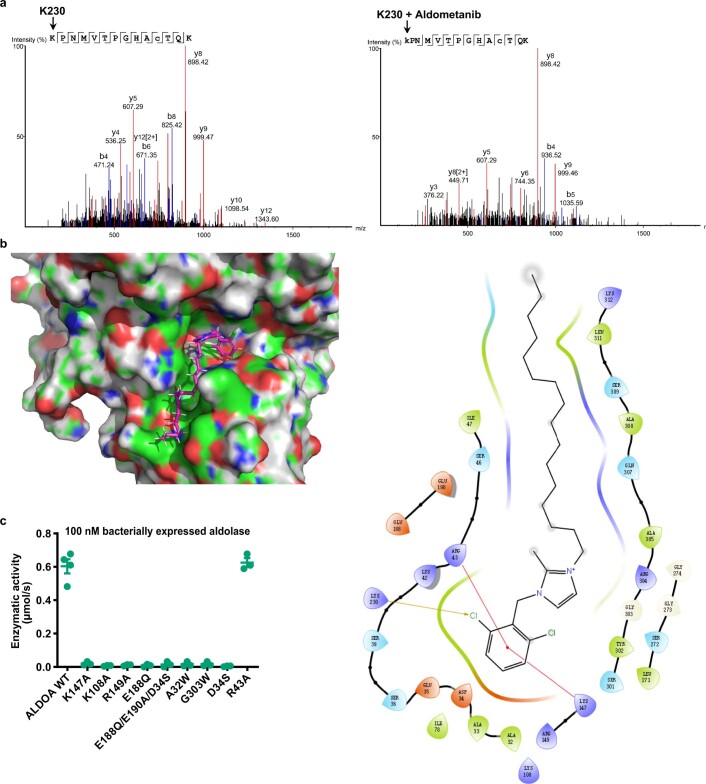
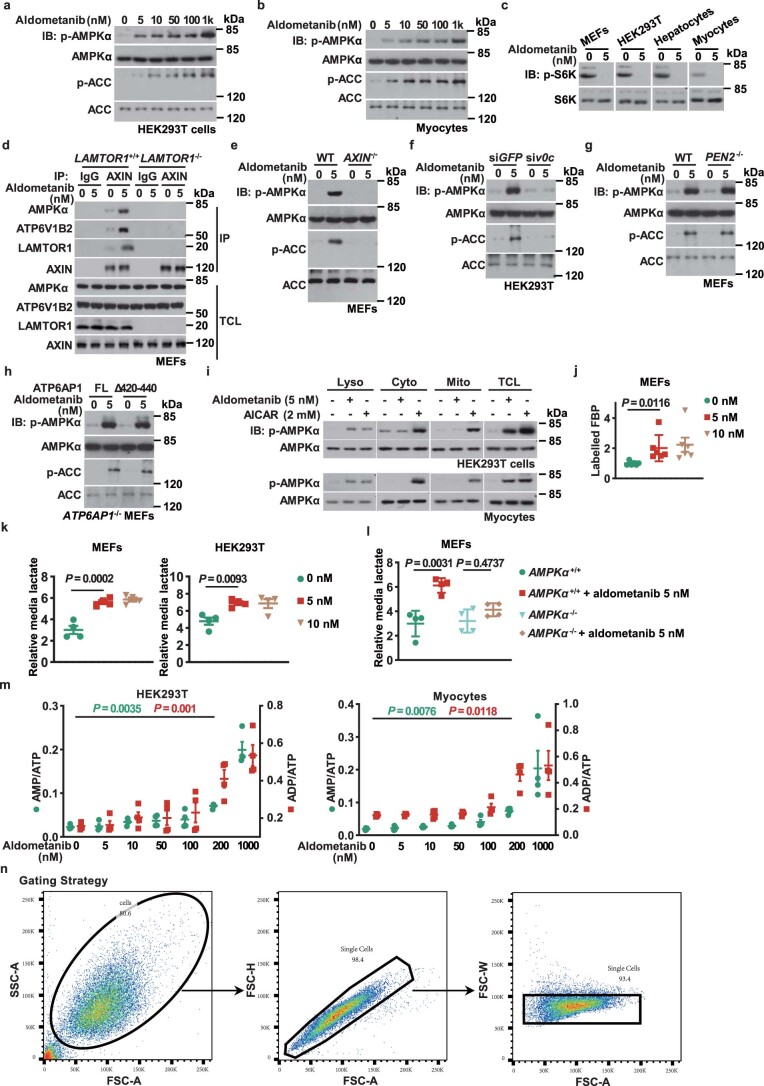
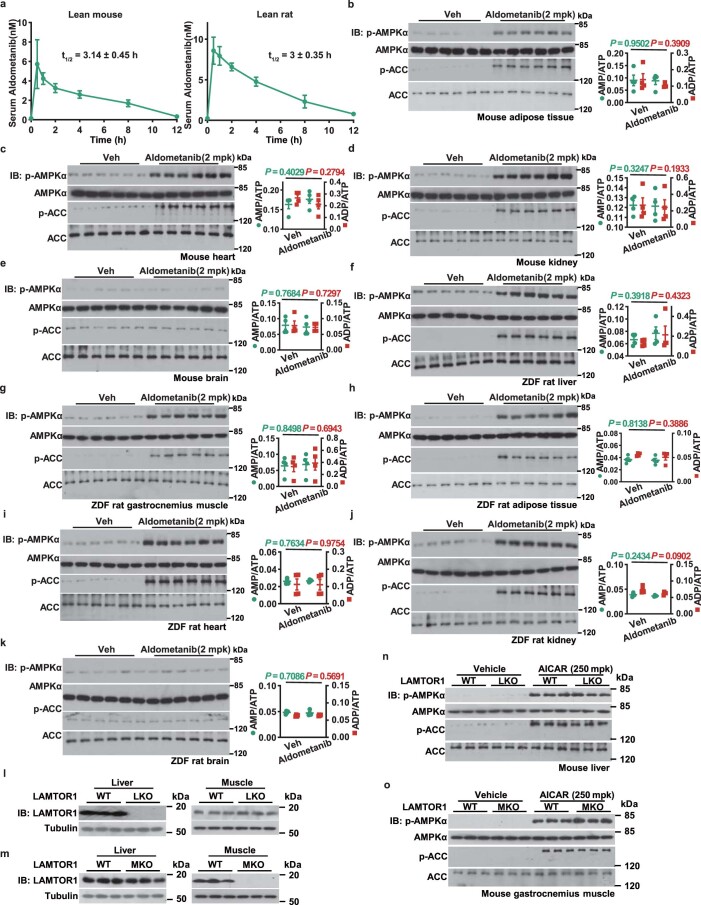
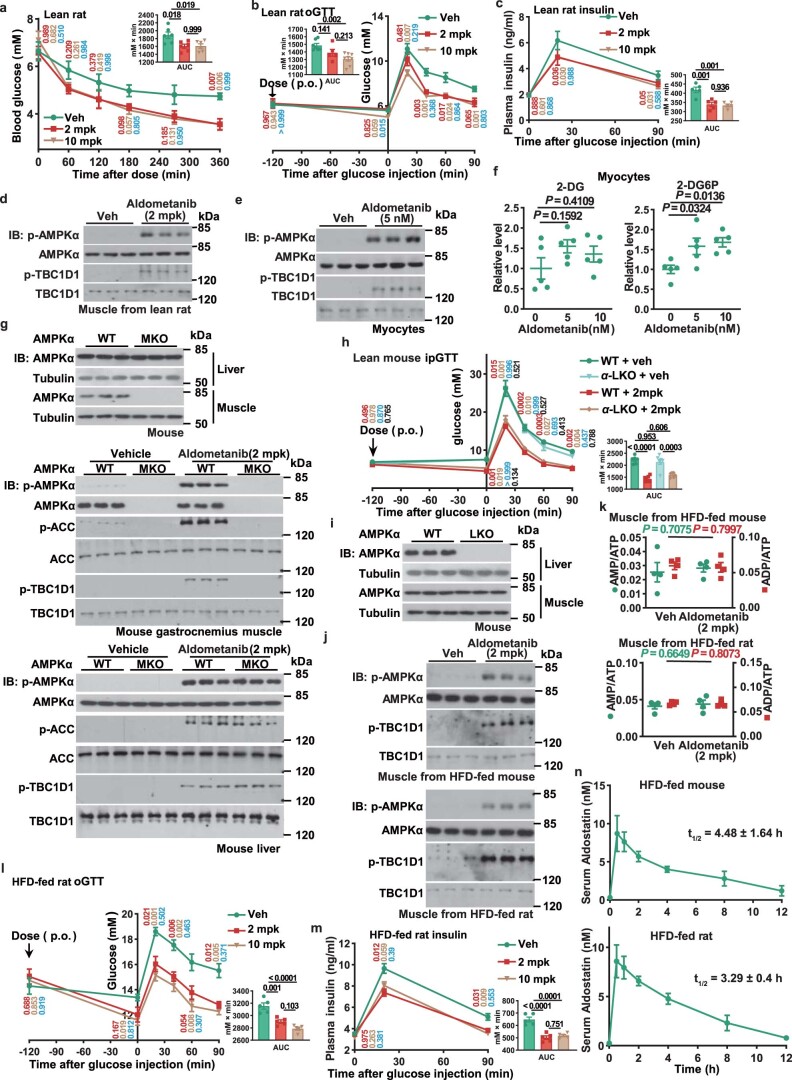
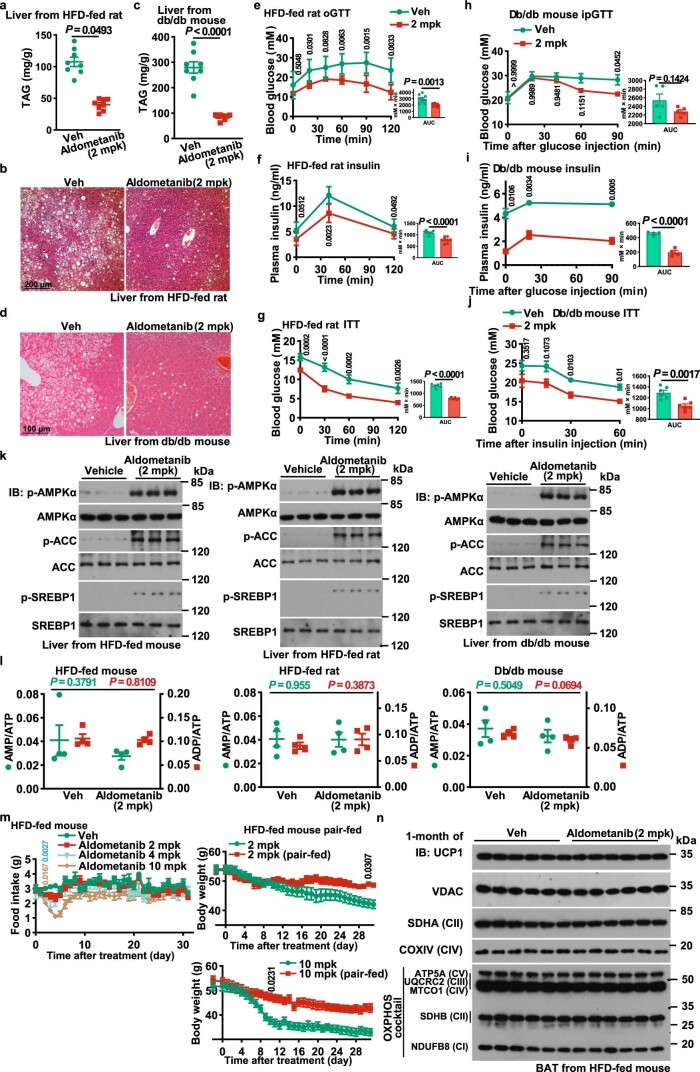
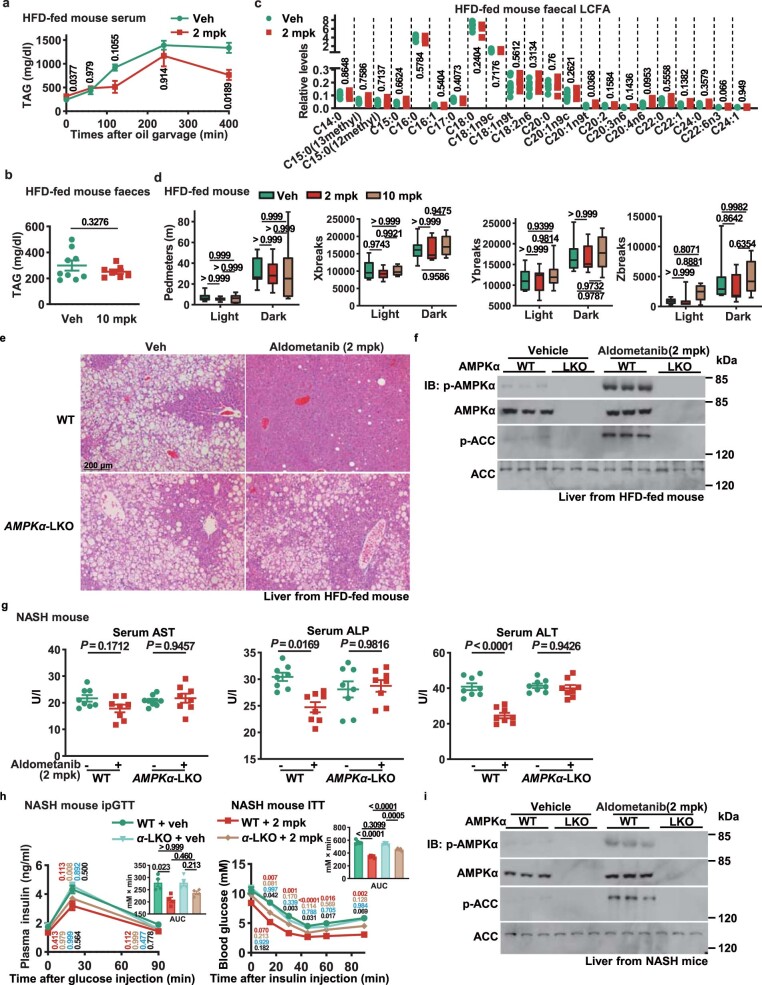
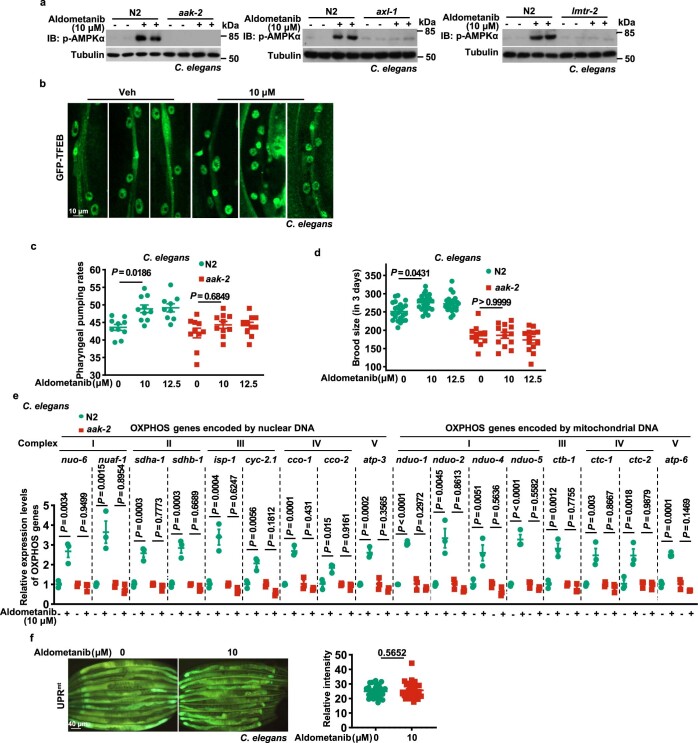
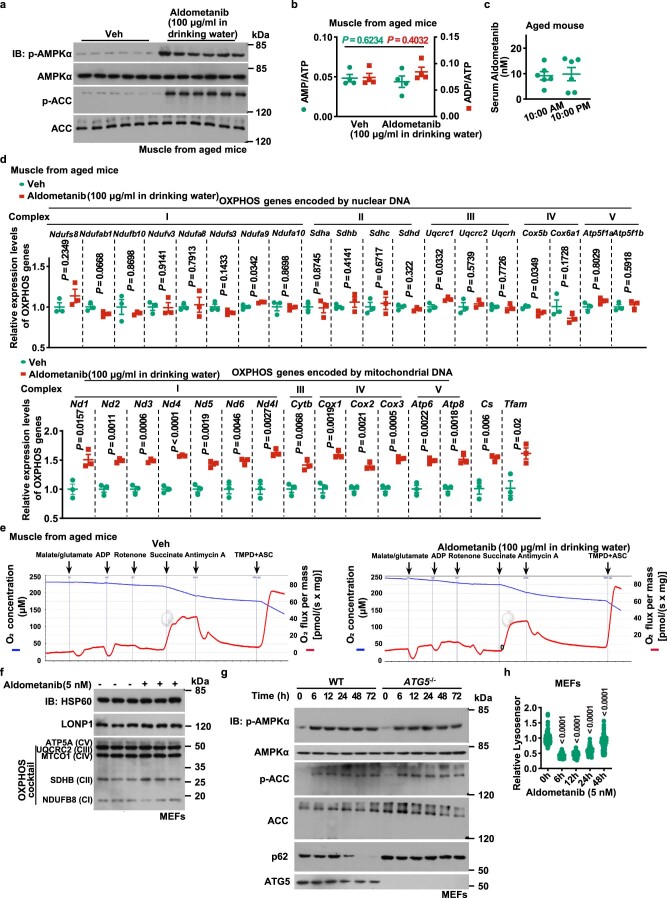
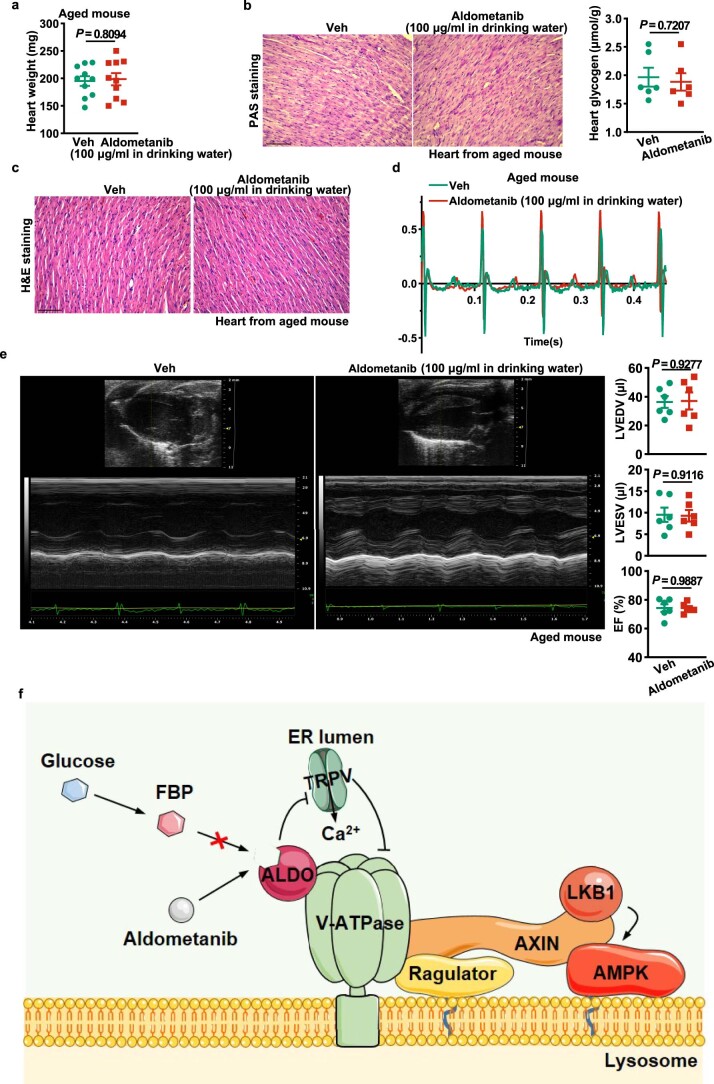
The activity of 5'-adenosine monophosphate-activated protein kinase (AMPK) is inversely correlated with the cellular availability of glucose. When glucose levels are low, the glycolytic enzyme aldolase is not bound to fructose-1,6-bisphosphate (FBP) and, instead, signals to activate lysosomal AMPK. Here, we show that blocking FBP binding to aldolase with the small molecule aldometanib selectively activates the lysosomal pool of AMPK and has beneficial metabolic effects in rodents. We identify aldometanib in a screen for aldolase inhibitors and show that it prevents FBP from binding to v-ATPase-associated aldolase and activates lysosomal AMPK, thereby mimicking a cellular state of glucose starvation. In male mice, aldometanib elicits an insulin-independent glucose-lowering effect, without causing hypoglycaemia. Aldometanib also alleviates fatty liver and nonalcoholic steatohepatitis in obese male rodents. Moreover, aldometanib extends lifespan and healthspan in both Caenorhabditis elegans and mice. Taken together, aldometanib mimics and adopts the lysosomal AMPK activation pathway associated with glucose starvation to exert physiological roles, and might have potential as a therapeutic for metabolic disorders in humans.


Conflict of interest statement

The compounds described in this paper have been filed for a patent application (WO 2018184561). Authors X.D., C.-S.Z. and S.-C.L. are listed as inventors on the patent (WO 2018184561) on the therapeutic use of aldometanib and other aldometanib derivatives. All other authors declare no competing interests.

Figures

Fig. 1
Fig. 1. Aldometanib activates lysosomal AMPK.
a,b, Aldometanib inhibits the enzymatic activity of purified aldolase. Enzymatic activities of rabbit aldolase are shown in b as the mean ± s.e.m.; n = 4 biological replicates for each concentration of aldometanib (see structure in a), and P values were determined by one-way analysis of variance (ANOVA), followed by Tukey’s test. c, Aldometanib is able to bind aldolase. Representative sensorgrams of SPR assays in which aldometanib were incubated with rabbit aldolase immobilized on a CM5 chip (solid line), and fitted curves for each measurement (dashed line) are shown. RU, response unit. d, Aldometanib prevents FBP from binding to aldolase. Rabbit aldolase was incubated with aldometanib, followed by determining the potential FBP and dihydroxyacetone phosphate (DHAP) binding by MS as described previously. e,h, The Arg43 residue of aldolase is required for aldometanib binding. Enzymatic activities of bacterially expressed ALDOA-p.Arg43Ala (e), and AMPK activation in ALDO-TKD MEFs reintroduced with ALDOA-p.Arg43Ala (h) were determined. Data are the mean ± s.d. (e) or s.e.m. (h; quantification of immunoblots); n = 3 biological replicates for each condition, and P values were by one-way (e) or two-way (h) ANOVA, followed by Tukey’s test (e and h). f,g,lo, Aldometanib activates AMPK via the lysosomal pathway. Wild-type MEFs (f) and MEFs LKB1−/− (l), CaMKK2−/− (m), TRPV1-4-QKO (n), LAMTOR1−/− (o) or mouse primary hepatocytes (g) were treated with aldometanib. Quantification data for immunoblots are the mean ± s.e.m., n = 4 (p-ACC/ACC of g) or 3 (others) dishes of cells for each condition, with P values calculated by two-way ANOVA followed by Tukey’s test (n and o), or by one-way ANOVA, followed by Tukey’s test (f and g; comparison between control and aldometanib-treated groups). ik, Aldometanib inhibits TRPVs and induces AXIN lysosomal translocation. MEFs were infected with TRPV4-GCaMP6s (i), pre-labelled with (j) or without (k) LysoSensor, and then treated with aldometanib, followed by determining the fluorescence intensity of TRPV4-GCaMP6s (i), LysoSensor (j) or staining AXIN and the lysosomal marker LAMP2 (k). Results are the mean ± s.d. (i) or s.e.m. (others); n = 19, 35, 18, 20, 19 and 18 cells from 5, 2, 4, 3, 4 and 3 dishes/fields for i, j, control of wild-type MEFs of k, aldometanib treatment of wild-type MEFs of k, control of LAMTOR1−/− MEFs and aldometanib treatment of LAMTOR1−/− MEFs, respectively; and P values were determined by two-sided Student’s t-test with Welch’s correction (i and j), or by two-way ANOVA followed by Tukey’s test (k). p, Aldometanib specifically activates lysosomally localized AMPK. MEFs or primary hepatocytes were treated with aldometanib, or AICAR (representing severe stress), followed by analysis of p-AMPKα in lysosomes (Lyso), cytosol (Cyto), mitochondria (Mito) and total cell lysates (TCL). Quantification data are the mean ± s.e.m., from n = 3 biological replicates, with P values calculated by one-way ANOVA, followed by Tukey’s test (compared as in f). Experiments were performed three times, except in b and e, which were performed four times. WT, wild type. Source data
Fig. 2
Fig. 2. Aldometanib is accumulated in the lysosome.
ac, Aldometanib activates AMPK through the lysosomal pathway without causing elevation of AMP/ADP, unless high doses are used. In a, results of adenylate ratios are shown as the mean ± s.e.m.; n = 4 dishes of cells for each condition. P values for AMP:ATP (coloured in green, and same hereafter for all comparisons between ratios of AMP:ATP) or ADP:ATP (coloured in red, and same hereafter for ADP:ATP) ratios were determined by one-way ANOVA followed by Dunnet’s (MEFs) or Tukey’s (hepatocytes) test. d,e,k,l, Aldometanib is enriched in the lysosome. MEFs (d, e and k) or HEK293T cells (l; expressing TRPV4-GCaMP6s indicator) were treated with aldometanib, followed by fractionation as in Fig. 1p to analyse aldometanib contents and concentrations (d; see also the lysosomal protein levels of ALDOA, ALDOB and ALDOC in e) and the activity of aldolase (k) in the lysosomal fraction, or determining the activity of TRPV4, which is an outcome of lysosomal aldolase activity in situ (l). Data are the mean ± s.e.m. from n = 3 (k) or 4 (d) biological replicates for each treatment; P values were determined by two-sided Student’s t-test (k), or by one-way ANOVA followed by Tukey’s test (d). fi, Lysosomal pH, but not endocytosis, contributes to the accumulation of aldometanib in the lysosome. MEFs were pretreated with NH4Cl, followed by incubation with aldometanib or starved for glucose (f and g). AMPK activation (f, upper part of h) and lysosomal concentrations of aldometanib (g, lower panel of h) were then determined. Aldometanib does not affect endocytosis, as evidenced by the fluorescence intensity (FI) of FITC in MEFs labelled with FITC-dextran via flow cytometry (i). Data are the mean ± s.e.m., from n = 7 (i) or 6 (h) biological replicates, with P values calculated by two-way ANOVA, followed by Tukey’s test (i), or by one-way ANOVA, followed by Dunn’s test (h). j, Intact lysosomes enhance the potency of aldometanib towards aldolase. Lysosomes from MEFs were purified, followed by incubation with aldometanib. Activities of lysosome-bound aldolase are the mean ± s.e.m. from n = 4 biological replicates for each treatment; P values were determined by one-way ANOVA, followed by Tukey’s test. mp, Aldometanib activates AMPK in liver and muscle through the lysosomal pathway. Wild-type mice (m and n) or mice with Lamtor1 specifically knocked out in liver (o; LKO) or muscle (p; MKO) were orally gavaged with aldometanib. After 2 h of gavaging, AMPK activation and the AMP:ATP and ADP:ATP ratios were determined. Data are the mean ± s.e.m. from n = 6 (m and n; AMPK activation), 3 (o and p; AMPK activation) or 4 (m and n; adenylate ratios) biological replicates for each treatment; P values were determined by two-sided Student’s t-test (m and n), or by two-way ANOVA followed by Tukey’ test (o and p). Experiments were performed three times. Source data
Fig. 3
Fig. 3. Aldometanib lowers blood glucose in lean mice.
ac,i,j, Acute aldometanib administration decreased fasting blood glucose and improved glucose tolerance in normoglycaemic mice. Wild-type and muscle-specific Ampkα knockout (α-MKO) mice were fasted for 2 h (a) or 6 h (b, c, i and j), followed by oral gavaging (p.o.) with aldometanib. Blood glucose levels in fasted mice or in mice that underwent an intraperitoneal glucose tolerance test (ipGTT) are shown as the mean ± s.e.m.; n = 5 (a and c), 8 (b), 10 (i; vehicle and WT), 9 (i; vehicle and α-MKO), 7 (i; 2 mpk) or 4 (j) mice for each treatment; P values were determined by two-way (blood glucose and insulin values), one-way (area under the curve (AUC) values of ac) or two-way (AUC values of i and j) repeated-measures (RM) ANOVA followed by Tukey’s test, and are indicated on the curves: for ac, comparisons between the control (Veh) and the 2-mpk group are coloured in red, control and 10-mpk group in beige, and 2-mpk and 10-mpk groups in blue; for i and j, WT + Veh and WT + 2 mpk are coloured in red, α-MKO + Veh and α-MKO + 2 mpk in beige, WT + Veh and α-MKO + Veh in blue, and WT + 2 mpk and α-MKO + 2 mpk in black. d,e,k, Aldometanib promoted muscular TBC1D1 phosphorylation and glucose uptake. Wild-type or α-MKO mice were starved for 5 h, followed by gavaging with aldometanib. After 1 h (e and k) or 2 h (d) of aldometanib gavaging, mice were killed and muscle tissue was collected for immunoblotting (IB) (d), or mice were intraperitoneally injected with 1.25 mpk glucose supplemented with 0.125 mpk 2-DG, followed by determining the muscular levels of 2-DG and 2-DG6P 2 h later (e and k). Results in e and k are shown as the mean ± s.e.m.; n = 6 mice for each treatment, and P values were determined by one-way ANOVA followed by Dunnet’s test (levels of 2-DG6P of e, and levels of 2-DG of k), Dunn’s test (levels of 2-DG6P of α-MKO of k) or Tukey’s test (others). fh, Acute aldometanib administration does not change body weight or EE. Mice were treated as in b, followed by determining body weight (f), body composition (g) and EE (h; see also respiratory quotient (RQ) and ambulatory activity data). Data are shown as the mean ± s.e.m. (f and g), mean (left part of h, at 5-min intervals during a 24-h course after normalization to the body weight (kg0.75)), or as box-and-whisker plot (right part of h, in which the lower and upper bounds of the box represent the first and the third quartile scores, the centre line represents the median, and the lower and upper limits denotes minimum and maximum scores, respectively; and the same hereafter for all box-and-whisker plots); n = 6 (f) or 5 (g and h) mice for each treatment; and P values were determined by one-way (f and g) or two-way (h) ANOVA, followed by Dunn’s (heart, kidney, liver, muscle, spleen, BAT and brain of g) or Tukey’s (others) test. gWAT, gonadal white adipose tissue; mWAT, mesenteric adipose tissue; rWAT, perirenal WAT; BAT, brown adipose tissue. Experiments were performed three times, except in a (four times). Source data
Fig. 4
Fig. 4. Aldometanib lowers blood glucose in obese hyperglycaemic mice.
a,b, Treatment with aldometanib for 1 week decreased blood glucose in HFD-induced obese mice. Experiments were performed as in Fig. 3b, except that mice fed with a HFD for 16 weeks were used, and mice were gavaged with aldometanib twice daily for a week. Results are shown as the mean ± s.e.m.; n = 6 mice for each treatment; P values were determined by two-way RM (blood glucose and insulin values) or one-way (AUC values) ANOVA followed by Tukey’s test, and are labelled as in Fig. 3a. cf, The 1-week treatment of aldometanib did not change body composition and energy metabolism in HFD-induced obese mice at effective doses. Mice were treated with 2 mpk, 4 mpk (effective doses) or 10 mpk (high dose) aldometanib for 1 week, followed by determination of body weight (c); body composition (d); EE, RQ and ambulatory activity (e); and rectal (f; upper) and surface (f, lower panel) temperatures. Data are shown as the mean ± s.e.m., except e as in Fig. 3h (for analysis of covariance (ANCOVA), the normalized weight was 45.2 g); n = 9 (c, d and f) or 7 (e) mice for each treatment; P values were determined by two-way RM ANOVA, followed by Tukey’s test (c; P values are indicated as in Fig. 3a) or Sidak’s test (lower part of f), by two-way ANOVA followed by Tukey’s test (e; except ANCOVA analysis), or by one-way ANOVA followed by Dunn’s test (BAT, spleen, kidney, heart and brain of d; and upper part of f), Dunnet’s test (fat mass of f) or Tukey’s test (others). Experiments were performed three times. Source data
Fig. 5
Fig. 5. Aldometanib alleviates fatty liver.
a, The 1-week treatment of aldometanib did not induce browning of adipose tissues in HFD-induced obese mice. LE, long exposure; SE, short exposure. b, The 1-week treatment of aldometanib lowered blood glucose in a muscular AMPK-dependent manner in HFD-induced obese mice. Experiments were performed as in Fig. 4a. Results are shown as the mean ± s.e.m.; n = 6 mice for each treatment; P values were determined by two-way RM (values of blood glucose) or two-way (values of AUC) ANOVA followed by Tukey’s test, and are indicated on the curves in colours: comparisons between the WT + Veh and WT + 2 mpk are coloured in red, WT + Veh and WT + 10 mpk in beige, α-MKO + Veh and α-MKO + 2 mpk in blue, α-MKO + Veh and α-MKO + 10 mpk in black, WT + Veh and α-MKO + Veh in green, WT + 2 mpk and α-MKO + 2 mpk in yellow, and WT + 10 mpk and α-MKO + 10 mpk in purple. c,d, The 1-month treatment of aldometanib reduced hepatic TAG in diet-induced obese mice. Mice were treated as in Fig. 4a, except that mice were gavaged with aldometanib twice daily for a month. Hepatic TAG levels (c; results are shown as the the mean ± s.e.m.; n = 5 mice for each treatment, and P values were determined by two-sided Student’s t-test) and representative images from H&E staining of the liver are shown (d). eg, The 1-month treatment of aldometanib improved insulin sensitivity in obese mice. Mice were treated as in c, followed by ipGTT (e; see also serum insulin levels during ipGTT in f) or ITT (g). Data are shown as the mean ± s.d., n = 6 mice for each treatment, and P values were were determined by two-way RM ANOVA followed by Sidak’s test (glucose and insulin), by two-sided Student’s t-test (AUC values of e and g), or by two-sided Student’s t-test with Welch’s correction (AUC values of f). h,i, The 1-month treatment of aldometanib increased glucose disposal rates in obese mice. Mice were treated as in c, followed by performing a hyperglycaemic (h) or hyperinsulinaemic–euglycaemic (i) clamp. Mice were treated as in c, followed by determining the glucose infusion rate (GIR; right part of h) when plasma glucose concentrations were maintained at 16–18 mM (left in h), or the HGP (upper left of i; see also the percentage of HGP suppressed by insulin infused during the clamp in upper right of i) and the muscular glucose uptake rate (lower right of i) by hyperinsulinaemic–euglycaemic clamp; see also GIR values during the clamp in lower left of i). Data are the mean ± s.d. (h) or s.e.m. (i); n = 4 (h; veh), 5 (h; aldometanib-treated) or 3 (i) mice for each treatment, and P values were determined by RM two-way ANOVA followed by Sidak’s test (GIR), by two-way ANOVA followed by Tukey’s test (i; HGP), or by two-sided Student’s t-test (h, AUC; i, others) j,k, Aldometanib inhibits TAG synthesis in liver and primary hepatocytes. Rates of TAG synthesis were assessed by labelled TAG determined either from liver tissues excised from mice gavaged with aldometanib and infused with uniformly labelled 13C [U-13C]-glucose through the jugular vein (j), or from primary hepatocytes incubated with [U-13C]-glucose (k). Data are the mean ± s.e.m.; n = 4 mice (j) or 3 dishes of cells (k) for each treatment; P values were determined by two-sided Student’s t-test. Experiments were performed three times. Source data
Fig. 6
Fig. 6. Aldometanib reduces fat mass.
ad, The 1-month treatment of aldometanib decreased fat mass, induced browning and elevated EE in HFD-induced obese mice. Mice were gavaged with aldometanib twice daily for a month, followed by determination of body weight (a), body composition (b), the mitochondrial contents of iWAT (c) and EE (d; n = 8 mice, shown and analysed as in Fig. 3h; and the normalized mouse weight for ANCOVA was 48.3604 g). Data in a and b are the mean ± s.e.m.; n = 10 (Veh and 2 mpk), 11 (4 mpk) or 12 (10 mpk) mice for each treatment; and P values were determined by two-way RM ANOVA, followed by Tukey’s test (a; labelled as in Fig. 4c), or by one-way ANOVA, followed by Dunn’s test (b; lean mass, BAT, spleen, kidney, brain and muscle) or Tukey’s test (b; others). See also rectal temperature measured in mice after 1 h of aldometanib gavage (d; mean ± s.e.m.; n = 7 mice for each treatment; P values were determined by one-way ANOVA, followed by Dunn’ test). ej, Knockout of AMPK prevented aldometanib from alleviating fatty liver. Levels of hepatic TAG (e), rates of TAG synthesis in liver (f) and primary hepatocytes (g), glucose tolerance (h, ipGTT; see also serum insulin levels during GTT in i) and insulin sensitivity (j, ITT) are shown. Data were generated either from HFD-induced obese α-LKO mice (e, f and gj; HFD-fed mice were treated with aldometanib as in Fig. 5c,e–g,j, except that the mice were injected with tamoxifen, three times a week for 1 week, to deplete hepatic AMPK before the aldometanib treatment), or from AMPKα−/− primary hepatocytes (g; treated as in Fig. 5k, except that cells were isolated from α-LKO mice). Data are the mean ± s.e.m. from n = 8 (e), 4 (f and h) or 6 (i and j) mice, or four dishes of cells (g); P values were determined by two-way ANOVA, followed by Tukey’s test (e; AUC values of h, i and j), two-sided Student’s t-test (f and g), or two-way RM ANOVA, followed by Tukey’s test (glucose values of hj; labelled as in Fig. 3i). Experiments were performed three times. Source data
Fig. 7
Fig. 7. Aldometanib alleviates NASH.
a,b,f,g, Aldometanib alleviated liver fibrosis in NASH mice. Mice were fed with AMLN diet for 30 weeks, and then twice-daily administration of 2 mpk aldometanib for a month. Hepatic AMPK was depleted by injecting tamoxifen 3 times a week for 1 week before the aldometanib treatment. Representative images of hepatic Sirius Red staining (a) and statistical analysis (b), hepatic levels of hydroxyproline (f) and the mRNA levels of fibrogenic genes (g) are shown. Data are the mean ± s.e.m.; n = 4 (g) or 5 (others) mice for each genotype/treatment; P values were determined by two-way ANOVA, followed by Tukey’s test. c,d, Aldometanib treatment decreased histological scores used to describe the features of NASH. Mice were treated as in a. Representative images from H&E staining of the liver (c), the NASs, ballooning scores, steatosis grades and the lobular inflammation scores (d; mean ± s.e.m. from n = 5 mice; P values were determined by two-way ANOVA, followed by Tukey’s test) are shown. e, Aldometanib reduces apoptosis rate of hepatic cells in NASH mice. Mice were treated as in a. Representative images from TUNEL/BrdU staining of the liver are shown, together with statistical analysis. Data are the mean ± s.e.m.; n = 7 mice for each genotype/treatment; P values were determined by two-way ANOVA, followed by Tukey’s test. h,i, Aldometanib inhibits inflammatory responses in the liver of NASH mice. Mice were treated as in a, and the mRNA levels of pro-inflammatory genes (h) are shown as the mean ± s.e.m. (n = 4 mice for each genotype/treatment). P values were determined by two-way ANOVA, followed by Tukey’s test. Representative images from F4/80 staining of the liver are shown (i). j, Aldometanib improved glucose tolerance of NASH mice. Mice were treated as in a, and results of ipGTT are shown as the mean ± s.e.m. (n = 9 mice for each genotype/treatment). P values were determined by two-way RM (glucose) or two-way (AUC) ANOVA, followed by Tukey’s test. Experiments were performed three times. Source data
Fig. 8
Fig. 8. Aldometanib extends lifespan and healthspan.
ac,e, Aldometanib extended lifespan in C. elegans via the lysosomal pathway. Wild-type (N2) nematodes or nematodes with AMPKα (aak-2), LAMTOR2 (lmtr-2) or AXIN (axl-1) knocked out were cultured on the agar plates containing aldometanib at indicated concentrations. Lifespan data are shown as Kaplan–Meier curves (a and c; see also statistical analyses on Supplementary Table 2, and the same hereafter for all lifespan data), and AMP:ATP and ADP:ATP ratios (b) and NAD+ (e) levels after 2-d treatment of aldometanib are shown as the mean ± s.e.m. (n = 6 dishes of worms for each treatment, and P values were determined by one-way ANOVA followed by Dunn’s (b; N2 of e) or Dunnet’s (others) test). d, Aldometanib promoted oxidative stress resistance in C. elegans. N2 nematodes were cultured on the agar plates containing aldometanib for 1 d, followed by treatment with 15 mM ferrous sulfate. f,g, Aldometanib promoted mitochondrial functions in C. elegans. The N2 and aak-2 nematodes were cultured on the agar plates containing aldometanib for 1 d, followed by determining the mtDNA:nDNA (f) and OCRs (g). Data are shown as the mean ± s.e.m.; n = 8 (f) or 4 (g) dishes of worms for each treatment, and P values were determined by two-way ANOVA followed by Tukey’s test. h, Aldometanib extended lifespan in mice. Male or female C57BL/6 mice at 52 weeks of age were treated with aldometanib in drinking water. i,j, Aldometanib elevated NAD+ levels and mitochondrial oxidative respiration in aged mouse muscle. Mice were treated as in h, except for 4 months, followed by determination of levels of muscular NAD+ (i), the activities of muscular mitochondrial complex I to IV (j) and the levels of muscular mtDNA:nDNA (j). Data are the mean ± s.e.m., n = 10 (control of i), 8 (aldometanib group of i, and right part of j) or 14 (left part of j) mice, and P values were determined by two-sided Student’s t-test with Welch’s correction (i), two-tailed Mann–Whitney test (resting group of right part of j) or two-sided Student’s t-test (others). k,l, Aldometanib rejuvenates muscle function in aged mice. Mice were treated as in i, followed by determination of running distance (k) and grip strength (both the forelimbs, and the four limbs; l). Data are shown as the mean ± s.e.m. form n = 24 (k), 30 (l; control) or 32 (l; aldometanib-treated) mice for each treatment. P values were determined by two-sided Student’s t-test. Experiments were performed three times, except d and e (four times). Source data
Extended Data Fig. 1
Extended Data Fig. 1. Aldometanib inhibits aldolase in vitro.
a, Schematic diagram depicting the principle for determining aldolase activity in vitro. The activity of aldolase was determined through its ability to catalyse FBP to G3P and DHAP. The yielded G3P was converted to DHAP through TPI, and was further catalysed to glycerol 3-phosphate through GPDH, coupled with a transition of NADH to NAD+. The decreases of OD340 of NADH were then quantified through a microplate reader (in 0.2-ml reaction volume, in 96-well plates; for screening assays) or a spectrophotometer (in 1.8-ml reaction volume, in cuvettes; for quantifying absolute activity), and then converted to the changes of amount of NAD+ by the Beer-Lambert law for calculating the activity of aldolase. b, Validations of aldolase enzymatic assay. Some 50 nM rabbit aldolase (ammonium sulphate precipitates) was incubated with FBP, TPI/GPDH and NADH (labelled as “complete”) in 96-well plates (upper panel) or cuvettes (lower panel), followed by determining its enzymatic activity. See also reactions without FBP (no FBP), TPI/GPDH (no TPI/GPDH), or NADH (no NADH) addition as controls. Results are shown as mean ± s.e.m.; n = 4 (“Full”, “no FBP” and “no TPI/GPDH” of lower panel) or 3 (others) biological replicates for each condition. c, Structure-activity relationship of 1,3-disubstituted imidazole derivatives. Some 50 nM rabbit aldolase was incubated with indicated chemical compounds (at indicated concentrations) for 30 min, followed by determining the activities of aldolase. Results are mean ± s.e.m.; n = 3 (0 μM, 75 μM of 1c, 100 μM of 1b, and 300 μM of 1e), 5 (150 μM of 1b and 1c, 200 μM of 1b, and 75 μM of 1d), or 4 (others) biological replicates for each condition. d, aldometanib inhibits all isozymes of aldolase. Some 100 nM bacterially expressed and purified human ALDOA, ALDOB and ALDOC were incubated with aldometanib for 30 min, followed by determining their activities. Results are shown as mean ± s.d.; n = 3 biological replicates for each condition; and P value by one-way ANOVA followed by Dunnet. Experiments in this figure were performed three times. Source data
Extended Data Fig. 2
Extended Data Fig. 2. Aldometanib binds aldolase at the K230 residue.
a, Typical spectrograms of K230 residues with (right) and without (left) aldometanib conjugation. Some 1 μg of rabbit aldolase was incubated with 50 μM aldometanib for 2 h, followed by SDS-PAGE and analysis of covalent modifications through mass spectrometry. b, In silico docking results showing that the groove near the K230 residue is required for aldometanib binding. c, Enzymatic activities of ALDOA (100 nM, bacterially expressed and purified) carrying mutations on residues that may be responsible for aldometanib binding. Results are shown as mean ± s.d.; n = 4 (ALDOA WT) or 3 (others) biological replicates for each condition. Experiments in this figure were performed three times. Source data
Extended Data Fig. 3
Extended Data Fig. 3. Aldometanib activates the lysosomal pool of AMPK.
a, b, e-h, aldometanib activates AMPK via the lysosomal pathway. HEK293T cells (a), mouse primary myocytes (b), AXIN-/- MEFs (e), HEK293T cells with ATP6v0c knocked down (f), PEN2-/- MEFs (g), or ATP6AP1-/- MEFs with the Δ420-440 mutant of ATP6AP1 re-introduced (h) were treated with aldometanib at indicated concentrations for 2 h, and the levels of p-AMPKα and p-ACC were determined by immunoblotting. c, aldometanib inhibits mTORC1. MEFs, HEK293T, primary hepatocytes and primary myocytes were treated with 5 nM aldometanib for 2 h, and the activity of mTORC1, as assessed by the phosphorylation levels of its substrate S6K (p-S6K), was determined through immunoblotting. d, i, aldometanib triggers the lysosomal pathway. MEFs were treated as in c, followed by immunoprecipitation (IP) of AXIN, or purification of lysosome (as in Fig. 1p). j-l, aldometanib does not inhibit, and even slightly enhances glycolysis. Wildtype MEFs (j, k), AMPKα-/- MEFs (l), and HEK293T cells (k) were treated with aldometanib for 2 h (j) or 4 h (k, l), followed by determining glycolytic rates, either through labelled metabolites tracing [j, using the levels of labelled (M + 6) FBP as an indicator of glycolytic rate] or lactate production (k). Results are shown as mean ± s.d.; n = 6 (j) or 4 (k, l) dishes of cells for each condition; and P value by one-way ANOVA followed by Dunn (j) or Tukey (k), or by two-way ANOVA, followed by Tukey (l). m, aldometanib activates AMPK without elevation of AMP/ADP. HEK293T cells (left panel) or primary myocytes (right panel) were treated with aldometanib at indicated concentrations for 2 h, followed by determining the AMP:ATP and ADP:ATP ratios. Results are shown as mean ± s.e.m.; n = 4 dishes of cells for each treatment, and P value by one-way ANOVA followed by Dunnet (HEK293T) or Dunn (myocytes). n, The gating strategy for quantifying the populations of FITC-labelled cells. Experiments in this figure were performed three times, except k and l four times. Source data
Extended Data Fig. 4
Extended Data Fig. 4. Aldometanib activates AMPK in rodent tissues.
a, Serum aldometanib concentrations in lean mice and rats. Serum samples were collected at indicated time points from mice (left panel) or rats (right panel) after oral gavaging 2 mpk aldometanib. Data are shown as mean ± s.d.; n = 7 mice/rats. See also half-life (t1/2) of aldometanib on each panel. b-e, aldometanib activates AMPK in various mouse tissues. Mice were orally gavaged with 2 mpk aldometanib. Adipose (b), heart (c), kidney (d) or brain (e) tissues were collected by freeze-clamping after 1 h of aldometanib gavage, followed by determining AMPK activation (left panel), and AMP:ATP and ADP:ATP ratios (right panel; results are shown as mean ± s.e.m.; n = 4 mice for each treatment, and P value by two-sided Student’s t-test, except ADP:ATP ratios in b, d by two-sided Student’s t-test with Welch’s correction). f-k, aldometanib activates AMPK in various rat tissues. Rats were orally gavaged with 2 mpk aldometanib. Liver (f), gastrocnemius muscle (g), adipose (h), heart (i), kidney (j) or brain (k) tissues were collected by freeze-clamping after 1 h of aldometanib gavage, followed by determining AMPK activation (left panel) and AMP:ATP and ADP:ATP ratios (right panel; results are shown as mean ± s.e.m.; n = 4 rats for each treatment, and P values by two-sided Student’s t-test, except ADP:ATP ratios in f by two-sided Student’s t-test with Welch’s correction). l, m, Validation of knockout efficiency and specificity of LAMTOR1 in LAMTOR1-LKO (l) and LAMTOR1-MKO (m) mice. Mice were generated as described in Methods section, and the protein levels of hepatic and muscular LAMTOR1 were determined by immunoblotting. n, o, AICAR activates AMPK in muscle or liver tissues with LAMTOR1 knockout. LAMTOR1-MKO mice were intraperitoneally injected with 250 mpk AICAR for 2 h, followed by determining the levels of p-AMPK and p-ACC in muscle (n) and liver (o) tissues by immunoblotting. Experiments in this figure were performed three times. Source data
Extended Data Fig. 5
Extended Data Fig. 5. Aldometanib increases muscular glucose uptake to lower blood glucose.
a-c, Acute aldometanib administration lowers blood glucose in normoglyceamic rats. Rats were fasted for 6 h, followed by gavaging of 2 mpk or 10 mpk aldometanib. Blood glucose levels in fasted rats or in rats undergo oral glucose tolerance test (oGTT) were measured and shown as mean ± s.e.m., n = 6 (a), 7 (vehicle of b), 5 (2 mpk of b; c) or 8 (10 mpk of b) rats for each treatment; P value by two-way RM (glucose) or one-way ANOVA (AUC) ANOVA, followed by Tukey (labelled as in Fig. 3a). d-f, j, aldometanib promotes glucose uptake. Levels of p-TBC1D1 in rat muscle (d), myocytes (e, treated as in Extended Data Fig. 3c) and HFD-induced obese mouse (j, upper) or rat (j, lower) muscle, and levels of 2-DG and 2-DG6P in myocytes (f) were determined. In d, j, rats were gavaged with 2 mpk aldometanib, and tissues were excised 2 h after gavaging. In f, primary myocytes were treated with 5 nM or 10 nM aldometanib for 2 h, followed by incubating with 0.1 mM 2-DG for another 10 min. Results of f are mean ± s.e.m.; n = 5 dishes of cells for each treatment, and P value by one-way ANOVA followed by Dunn (left panel) or Tukey (right panel). g, i, Validation of knockout efficiency and specificity of knockout in α-MKO (g) and α-LKO (i) mice. Tissue samples were collected (in the middle and lower panels of g, mice were treated as in d), followed by immunoblotting. h, aldometanib can lower blood glucose without hepatic AMPK. Experiments were performed as in Fig. 3i, except that liver-specific AMPKα knockout (LKO) mice were used. Results are shown as mean ± s.e.m.; n = 6 (WT, and LKO + aldometanib) or 7 (others) mice, and P values by two-way RM (glucose) or two-way (AUC) ANOVA, followed by Tukey (labelled as in Fig. 3i). k, aldometanib does not elevate AMP in obese rodent muscle. HFD-induced obese mice (upper panel) or rats (lower panel) were gavaged with aldometanib. At 2 h post-gavaging, muscular AMP:ATP and ADP:ATP ratios were determined. Results are mean ± s.e.m.; n = 4 mice/rats for each treatment, and P value by two-sided Student’s t-test. l, m, The 1-week treatment of aldometanib decreases blood glucose in HFD-induced obese rats. Experiments were performed as in b, except that rats fed with HFD for 12 weeks were used, and that aldometanib was gavaged twice a day for a week. Results are mean ± s.e.m.; n = 5 rats for each treatment, and P values by two-way RM (glucose) or one-way (AUC) ANOVA followed by Tukey (labelled as in Fig. 3a). n, Serum aldometanib concentrations in obese mice and rats. Experiment were performed as in Extended Data Fig. 4a; data are mean ± s.d.; n = 5 mice/rats. See also half-life (t1/2) of aldometanib on each panel. Experiments in this figure were performed three times. Source data
Extended Data Fig. 6
Extended Data Fig. 6. Aldometanib alleviates fatty liver.
a-d, The 1-month treatment of aldometanib reduces alleviates fatty liver in obese rodents. Rats (a, b) and Db/db (c, d) mice were fed with HFD and standard diet, respectively, for 12 weeks. aldometanib was administered twice-daily for a month, followed by determining hepatic TAG levels. In a, c, data are mean ± s.e.m.; n = 8 mice/rats for each treatment, P value by two-sided Student’s t-test with Welch’s correction. See also representative images from hepatic H&E staining in b, d. e-j, The 1-month treatment of aldometanib improves insulin sensitivity in obese rodents. Rats and db/db mice were treated as in a, followed by performing oGTT (e, for rats; see also insulin levels in f), ipGTT (h, for db/db mice, insulin levels in i) and ITT (g, j). Data are mean ± s.d. (rats) or s.e.m. (db/db mice), n = 9 (e), 6 (f, g, j), 5 (h), or 4 (i) mice/rats for each treatment, and P value by two-way RM ANOVA followed by Sidak (glucose), by two-sided Student’s t-test (AUC of f, g, j, i), or by two-sided Student’s t-test with Welch’s correction (AUC of e, h). k, l, aldometanib promotes hepatic ACC and SREBP1 phosphorylation in obese rodents without elevating AMP. HFD-induced obese mice (left), HFD-induced obese rats (middle) or db/db mice (right) were gavaged with aldometanib, followed by determining p-ACC, p-SREBP, and adenylate ratios [mean ± s.e.m.; n = 4 mice/rats for each treatment, and P value by two-sided Student’s t-test with Welch’s correction (AMP:ATP of HFD mice) or two-sided Student’s t-test (others)] in liver tissues 2 h after gavaging. m, n, The 1-month treatment of aldometanib does not affect food intake, unless high doses are administered. Mice were treated as in Fig. 6a, and the daily food intake (m, left panel) and mitochondrial contents of BAT (n) were determined. See also body weight of mice in the pair-feeding experiments on the right panel of m. Data are shown as mean ± s.e.m.; n = 11 (4 mpk of food intake), 12 (10 mpk of food intake) or 10 (others) mice for each treatment; and P values by two-way RM ANOVA, followed by Tukey. Experiments in this figure were performed three times. Source data
Extended Data Fig. 7
Extended Data Fig. 7. AMPK is required for aldometanib to alleviate fatty liver and NASH.
a, aldometanib impairs post-prandial TAG absorption. The HFD-induced obese mice were starved for 8 h, followed by injection with Tyloxapol and gavaged with aldometanib. Some 0.5 h later, mice were gavaged with 10 ml/kg olive oil, followed by determining serum TAG. Data are mean ± s.e.m., n = 6 mice for each treatment, and P value by two-way ANOVA followed by Sidak (TAG). b, c, aldometanib does not change faecal lipid content. The HFD-induced obese mice were gavaged with aldometanib. At 1 h after gavaging, levels of faecal TAG (b) and long-chain fatty acids (c) were determined. Data are mean ± s.e.m., n = 9 (b, Veh), 7 (b, 2 mpk; c, Veh), and 6 (c, 2 mpk) mice for each treatment, and P value by two-sided Student’s t-test. d, The 1-month treatment of aldometanib administration does not change ambulatory activity. Experiments were performed as in Fig. 6d. Data are shown as box-and-whisker plots (n = 8 mice, P values by two-way ANOVA, followed by Tukey). e, Hepatic knockout of AMPK impairs the effects of 1-month aldometanib treatment in reducing hepatic TAG; experiments as in Fig. 5c, but using AMPKα-LKO mice. f, i, aldometanib promotes AMPK activation in the liver of obese and NASH mouse models. HFD-induced obese mice (f) and the AMLN-NASH mice (i) were gavaged with aldometanib, followed by determining AMPK activation in liver tissues 2 h after gavaging. g, h, Hepatic knockout of AMPK impairs the effects of aldometanib in alleviating NASH. Mice were treated as in Fig. 7a, followed by measuring serum AST (g, left panel), ALP (g, middle panel), ALT (g, right panel), insulin levels during the ipGTT (h, left panel), and performing ITT (h, right panel). Data are mean ± s.e.m.; n = 8 (g), 4 (h, left panel) or 5 (h, right panel) mice for each genotype/treatment, and P value by two-way (g, AUC of h), two-way RM (glucose of h) ANOVA, followed by Tukey (labelled as in Fig. 3i). Experiments in this figure were performed three times. Source data
Extended Data Fig. 8
Extended Data Fig. 8. Aldometanib improves lifespan and healthspan in C. elegans.
a, aldometanib activates AMPK in C. elegans via the lysosomal pathway. N2, aak-2 (left), lmtr-2 (middle), and axl-1 (right) nematodes were cultured on the agar plates containing aldometanib at 10 μM, followed by determining levels of p-AMPKα by immunoblotting. b, aldometanib inhibits TORC1 in C. elegans. The N2 nematodes (HLH-30::GFP) expressing GFP-tagged HLH-30, nematode orthologue of TFEB, were cultured on the agar plates containing 10 μM aldometanib for 1 day, followed by determining the localisation of HLH-30 by fluorescent staining. Representative images are shown. c, d, aldometanib promotes pharyngeal pumping rates and brood size of C. elegans. N2 and aak-2 nematodes were cultured on the agar plates containing aldometanib at 10 μM and 12.5 μM. Pharyngeal pumping rates (c) are mean ± s.e.m., n = 9 (N2 + 12.5 μM) or 10 (others) biological replicates. Brood size (d) are mean ± s.e.m., n = 23 (N2), 11 (aak-2, control) or 13 (aak-2, aldometanib-treated) biological replicates. P values are calculated by two-way ANOVA, followed by Tukey. e, aldometanib promotes mitochondrial OXPHOS gene expression in C. elegans. N2 and aak-2 nematodes were cultured on the agar plates containing aldometanib at 10 μM for a day, followed by determining the levels of OXPHOS genes by RT-PCR. Data are shown as mean ± s.e.m., n = 3 biological replicates for each genotype/treatment, and P value by two-way ANOVA, followed by Tukey. f, aldometanib does not trigger UPRmt in C. elegans. The hsp-6p::gfp nematodes were cultured on the agar plates containing aldometanib at 10 μM for a day, followed by determining the fluorescent intensities of GFP. Representative images are shown on the left panel, and statistical analysis data on the right panel (left panel; shown as mean ± s.e.m., n = 30 worms for each treatment, and P value by two-sided Student’s t-test with Welch’s correction). Experiments in this figure were performed three times. Source data
Extended Data Fig. 9
Extended Data Fig. 9. Aldometanib improves lifespan and healthspan in mice.
a, b, aldometanib activates muscular AMPK in aged mice, without elevating AMP. Mice at 52 weeks of age (aged mice) were treated with aldometanib at 100 μg/ml in drinking water for a week, followed by determining levels of p-AMPKα and p-ACC (a), as well as AMP:ATP and ADP:ATP ratios (b, results are mean ± s.e.m.; n = 4 mice for each treatment, and P value by two-sided Student’s t-test) in muscle tissues. c, Serum aldometanib concentrations in aged mice. Aged mice were treated as in a, followed by determining serum aldometanib concentration at 10:00 a.m. and 10:00 p.m., respectively. Data are shown as mean ± s.e.m.; n = 6 mice. d, aldometanib promotes mitochondrial OXPHOS gene expression in mice. Aged mice were treated with aldometanib at 100 μg/ml in drinking water for 4 months, followed by determining the levels of OXPHOS genes by RT-PCR. Data are shown as mean ± s.e.m., n = 3 for each genotype/treatment, and P value by two-sided Student’s t-test. e, aldometanib elevates mitochondrial oxidative respiration in aged mice. Mice were treated as in d, followed by determining the muscular oxygen consumption rates by the Oxygraph-2k. Representative oxygraphs are shown. f, aldometanib does not trigger UPRmt in mammalian cells. MEFs were treated 5 nM aldometanib for 24 h, followed by determining the protein levels of LONP1, HSP60 and MTCO1, makers of UPRmt by immunoblotting. g, aldometanib promotes autophagy at later than AMPK activation. MEFs with ATG5 knocked out, along with its wildtype control, were incubated with 5 nM aldometanib for indicated time periods, followed by determining levels of p62, p-AMPK and p-ACC by immunoblotting. h, Long-term treatment of aldometanib re-acidifies lysosomes. MEFs were incubated with 5 nM aldometanib for indicated time periods, followed by determining the intensities of lysosensor. Results are mean ± s.e.m.; n = 133 (0 h), 138 (6 h), 129 (12 h), 121 (24 h) or 126 (48 h) cells; and P value by one-way ANOVA followed by Dunnet. Experiments in this figure were performed three times. Source data
Extended Data Fig. 10
Extended Data Fig. 10. Aldometanib does not cause cardiac hypertrophy.
a-e, Aged mice were treated with aldometanib at 100 μg/ml in drinking water for 4 months, followed by determining heart weight (a; data are mean ± s.e.m., n = 10 mice for each treatment, and P value by two-sided Student’s t-test), heart glycogen content (b, right panel; data are mean ± s.e.m., n = 6 mice for each/treatment, and P value by two-sided Student’s t-test; see also representative images from PAS staining of heart in the left panel), heart morphology (c; by H&E staining), cardiac function [assessed by electrocardiography (d) and echocardiography (e; representative echocardiograms are shown; see also levels of LVEDV, LVSEV and the percentage of EF; data are mean ± s.e.m., n = 6 mice for each treatment, and P value by two-sided Student’s t-test)]. f, Schematic diagram showing that aldometanib engenders a pseudostarvation of glucose to activate lysosomal AMPK. In high glucose, the glycolytic intermediate FBP occupies aldolase via the key residue K230. In low glucose, however, aldolase becomes unoccupied, and inhibits the cation channel TRPV, the latter of which then disrupts the association of the former with, and inhibits, v-ATPase. aldometanib binds aldolase K230 to prevent the binding of FBP, mimicking the state of low glucose. The inhibited v-ATPase, along with its associated Ragulator, provides docking sites for AXIN/LKB1, leading to the activation of AMPK on the lysosome. This panel was modified from elements created by Servier Medical Art (https://smart.servier.com/). Experiments in this figure were performed three times, except d and e four times. Source data

Similar articles

Cited by

References

    1. Hardie DG, Ross FA, Hawley SA. AMPK: a nutrient and energy sensor that maintains energy homeostasis. Nat. Rev. Mol. Cell Biol. 2012;13:251–262. doi: 10.1038/nrm3311. - DOI - PMC - PubMed
    1. Herzig, S. & Shaw, R. J. AMPK: guardian of metabolism and mitochondrial homeostasis. Nat. Rev. Mol. Cell Biol. 10.1038/nrm.2017.95 (2017). - PMC - PubMed
    1. Gonzalez A, Hall MN, Lin SC, Hardie DG. AMPK and TOR: the yin and yang of cellular nutrient sensing and growth control. Cell Metab. 2020;31:472–492. doi: 10.1016/j.cmet.2020.01.015. - DOI - PubMed
    1. Carling D, Clarke PR, Zammit VA, Hardie DG. Purification and characterization of the AMP-activated protein kinase. Copurification of acetyl-CoA carboxylase kinase and 3-hydroxy-3-methylglutaryl-CoA reductase kinase activities. Eur. J. Biochem. 1989;186:129–136. doi: 10.1111/j.1432-1033.1989.tb15186.x. - DOI - PubMed
    1. Oakhill JS, et al. beta-Subunit myristoylation is the gatekeeper for initiating metabolic stress sensing by AMP-activated protein kinase (AMPK) Proc. Natl Acad. Sci. USA. 2010;107:19237–19241. doi: 10.1073/pnas.1009705107. - DOI - PMC - PubMed

Publication types