

Prediction of hepatocellular carcinoma prognosis and immunotherapeutic effects based on tryptophan metabolism-related genes
- PMID: 36217206
- PMCID: PMC9552452
- DOI: 10.1186/s12935-022-02730-8
Prediction of hepatocellular carcinoma prognosis and immunotherapeutic effects based on tryptophan metabolism-related genes
Abstract
Background: L-tryptophan (Trp) metabolism involved in mediating tumour development and immune suppression. However, comprehensive analysis of the role of the Trp metabolism pathway is still a challenge.
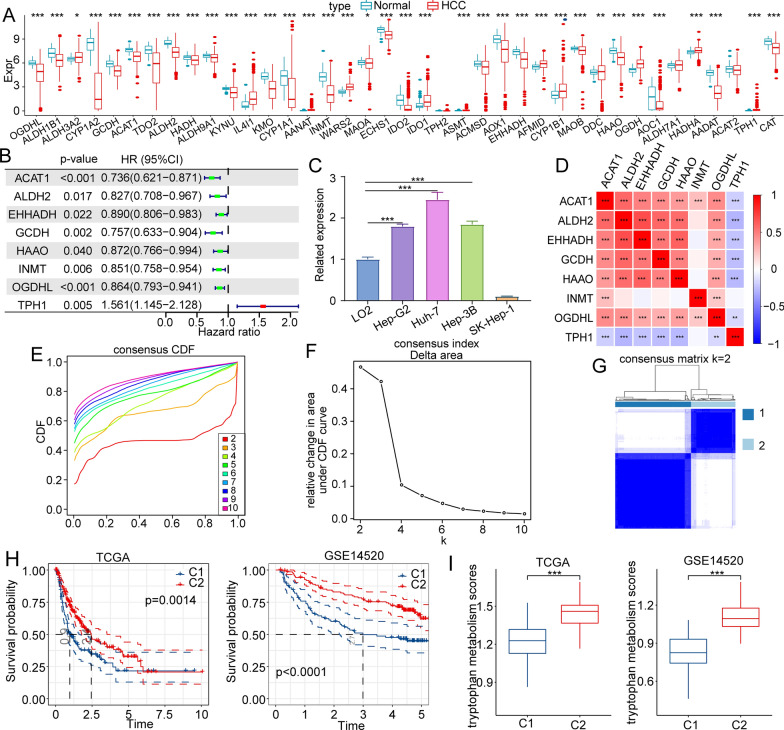
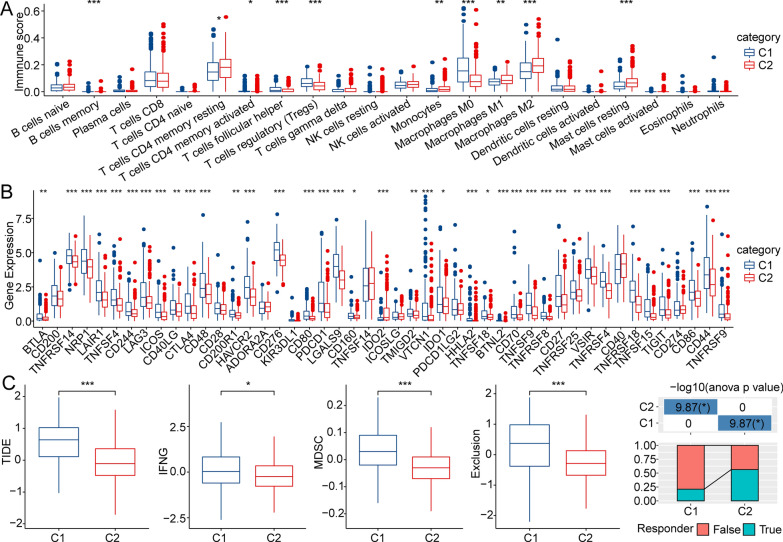
Methods: We downloaded Trp metabolism-related genes' expression data from different public databases, including TCGA, Gene Expression Omnibus (GEO) and Hepatocellular Carcinoma Database (HCCDB). And we identified two metabolic phenotypes using the ConsensusClusterPlus package. Univariate regression analysis and lasso Cox regression analysis were used to establish a risk model. CIBERSORT and Tracking of Indels by DEcomposition (TIDE) analyses were adopted to assess the infiltration abundance of immune cells and tumour immune escape.
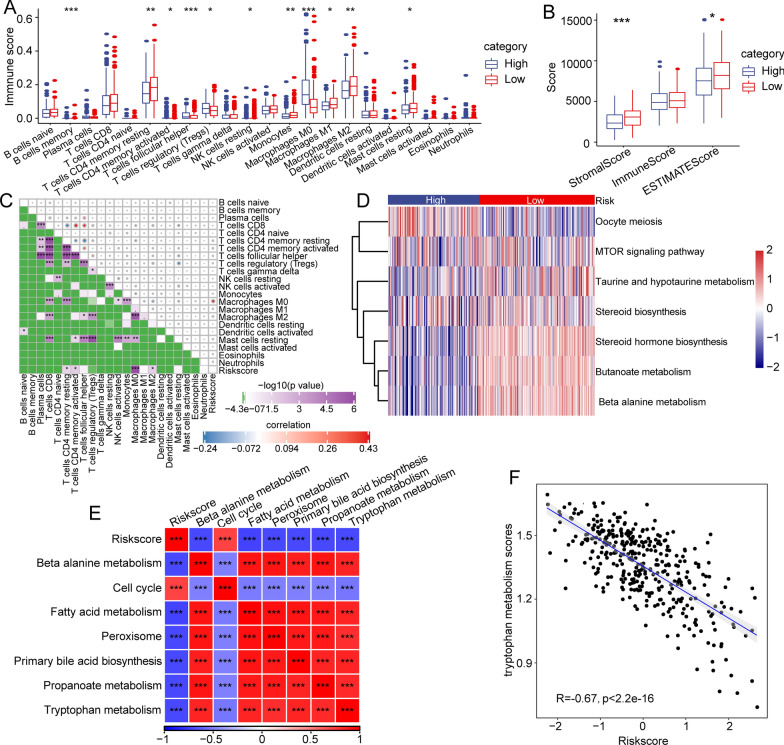
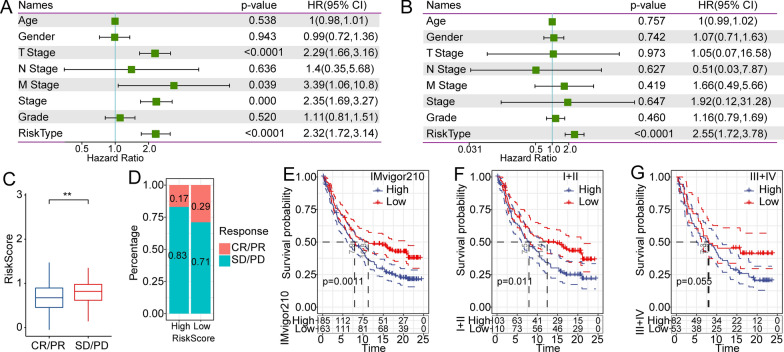
Results: We identified two metabolic phenotypes, and patients in Cluster 2 (C2) had a better prognosis than those in Cluster 1 (C1). The distribution of clinical features between the metabolic phenotypes showed that patients in C1 tended to have higher T stage, stage, grade, and death probability than those of patients in C2. Additionally, we screened 739 differentially expressed genes (DEGs) between the C1 and C2. We generated a ten-gene risk model based on the DEGs, and the area under the curve (AUC) values of the risk model for predicting overall survival. Patients in the low-risk subgroup tended to have a significantly longer overall survival than that of those in the high-risk group. Moreover, univariate analysis indicated that the risk model was significantly correlated with overall survival. Multivariate analysis showed that the risk model remained an independent risk factor in hepatocellular carcinoma (p < 0.0001).
Conclusions: We identified two metabolic phenotypes based on genes of the Trp metabolism pathway, and we established a risk model that could be used for predicting prognosis and guiding immunotherapy in patients with hepatocellular carcinoma.
Keywords: HCC; Immune escape; Metabolic phenotype; Prognosis; Risk model; Trp metabolism.
© 2022. The Author(s).
Conflict of interest statement
The authors declare that they have no competing interests.
Figures


Similar articles
-
Integrated bioinformatics analysis and experimental validation to understand tryptophan metabolism-related genes in hepatocellular carcinoma.J Cancer. 2024 Jul 16;15(15):4879-4892. doi: 10.7150/jca.91306. eCollection 2024. J Cancer. 2024. PMID: 39132147 Free PMC article.
-
Identification and analysis of necroptosis-associated signatures for prognostic and immune microenvironment evaluation in hepatocellular carcinoma.Front Immunol. 2022 Aug 23;13:973649. doi: 10.3389/fimmu.2022.973649. eCollection 2022. Front Immunol. 2022. PMID: 36081504 Free PMC article.
-
Systematic Analysis and Identification of Molecular Subtypes of TRP-Related Genes and Prognosis Prediction in Lung Adenocarcinoma.J Oncol. 2022 Aug 31;2022:5388283. doi: 10.1155/2022/5388283. eCollection 2022. J Oncol. 2022. PMID: 36090899 Free PMC article.
-
Comprehensive FGFR3 alteration-related transcriptomic characterization is involved in immune infiltration and correlated with prognosis and immunotherapy response of bladder cancer.Front Immunol. 2022 Jul 26;13:931906. doi: 10.3389/fimmu.2022.931906. eCollection 2022. Front Immunol. 2022. PMID: 35958598 Free PMC article.
-
Mitochondrial-Related Transcriptome Feature Correlates with Prognosis, Vascular Invasion, Tumor Microenvironment, and Treatment Response in Hepatocellular Carcinoma.Oxid Med Cell Longev. 2022 Apr 30;2022:1592905. doi: 10.1155/2022/1592905. eCollection 2022. Oxid Med Cell Longev. 2022. PMID: 35535359 Free PMC article.
Cited by
-
Novel molecular hepatocellular carcinoma subtypes and RiskScore utilizing apoptosis-related genes.Sci Rep. 2024 Feb 16;14(1):3913. doi: 10.1038/s41598-024-54673-x. Sci Rep. 2024. PMID: 38365931 Free PMC article.
-
Integrated bioinformatics analysis and experimental validation to understand tryptophan metabolism-related genes in hepatocellular carcinoma.J Cancer. 2024 Jul 16;15(15):4879-4892. doi: 10.7150/jca.91306. eCollection 2024. J Cancer. 2024. PMID: 39132147 Free PMC article.
-
Construction of a risk model associated with tryptophan metabolism and identification of related molecular subtypes in laryngeal squamous cell carcinoma.Front Genet. 2025 Mar 24;16:1530334. doi: 10.3389/fgene.2025.1530334. eCollection 2025. Front Genet. 2025. PMID: 40196225 Free PMC article.
-
A Narrative Review of Prognostic Gene Signatures in Oral Squamous Cell Carcinoma Using LASSO Cox Regression.Biomedicines. 2025 Jan 8;13(1):134. doi: 10.3390/biomedicines13010134. Biomedicines. 2025. PMID: 39857718 Free PMC article. Review.
-
KLF7 Promotes Hepatocellular Carcinoma Progression Through Regulating SLC1A5-Mediated Tryptophan Metabolism.J Cell Mol Med. 2024 Dec;28(23):e70245. doi: 10.1111/jcmm.70245. J Cell Mol Med. 2024. PMID: 39648156 Free PMC article.
References
Grants and funding
LinkOut - more resources
Full Text Sources
Miscellaneous
