. 2023 May;19(5):1444-1458.
doi: 10.1080/15548627.2022.2132686. Epub 2022 Oct 10.

Impaired TFEB activation and mitophagy as a cause of PPP3/calcineurin inhibitor-induced pancreatic β-cell dysfunction

Affiliations

Impaired TFEB activation and mitophagy as a cause of PPP3/calcineurin inhibitor-induced pancreatic β-cell dysfunction

Kihyoun Park et al. Autophagy. 2023 May.

Abstract

Macroautophagy/autophagy or mitophagy plays crucial roles in the maintenance of pancreatic β-cell function. PPP3/calcineurin can modulate the activity of TFEB, a master regulator of lysosomal biogenesis and autophagy gene expression, through dephosphorylation. We studied whether PPP3/calcineurin inhibitors can affect the mitophagy of pancreatic β-cells and pancreatic β-cell function employing FK506, an immunosuppressive drug against graft rejection. FK506 suppressed rotenone- or oligomycin+antimycin-A-induced mitophagy measured by Mito-Keima localization in acidic lysosomes or RFP-LC3 puncta colocalized with TOMM20 in INS-1 insulinoma cells. FK506 diminished nuclear translocation of TFEB after treatment with rotenone or oligomycin+antimycin A. Forced TFEB nuclear translocation by a constitutively active TFEB mutant transfection restored impaired mitophagy by FK506, suggesting the role of decreased TFEB nuclear translocation in FK506-mediated mitophagy impairment. Probably due to reduced mitophagy, recovery of mitochondrial potential or quenching of mitochondrial ROS after removal of rotenone or oligomycin+antimycin A was delayed by FK506. Mitochondrial oxygen consumption was reduced by FK506, indicating reduced mitochondrial function by FK506. Likely due to mitochondrial dysfunction, insulin release from INS-1 cells was reduced by FK506 in vitro. FK506 treatment also reduced insulin release and impaired glucose tolerance in vivo, which was associated with decreased mitophagy and mitochondrial COX activity in pancreatic islets. FK506-induced mitochondrial dysfunction and glucose intolerance were ameliorated by an autophagy enhancer activating TFEB. These results suggest that diminished mitophagy and consequent mitochondrial dysfunction of pancreatic β-cells contribute to FK506-induced β-cell dysfunction or glucose intolerance, and autophagy enhancement could be a therapeutic modality against post-transplantation diabetes mellitus caused by PPP3/calcineurin inhibitors.

Keywords: Calcineurin; TFEB; mitophagy; pancreatic β-cell; post-transplantation diabetes mellitus.


Conflict of interest statement

M.-S. L. is the CEO of LysoTech, Inc.

Figures

Figure 1.
Figure 1.
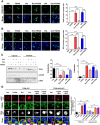
Effect of FK506, a PPP3/calcineurin inhibitor, on mitophagy of INS-1 insulinoma cells after treatment with mitochondrial stressors. (A) INS-1 cells transfected with pMito-Keima plasmid were incubated with rotenone (Rot) or oligomycin+antimycin A (O/A) for 18 h in the presence or absence of FK506 pretreatment. Fluorescent microscopy was performed at excitation wavelengths of 440 and 590 nm to visualize fluorescence from mitochondrial Keima and that from acidic Mito-Keima delivered to lysosome, thus from mitophagy, respectively (left). The number of acidic Mito-Keima puncta per cell (middle) and Mito-Keima red:green ratio representing mitophagy (right) were calculated. Scale bar: 5 μm. n = 30 (Veh, vehicle; Rot, rotenone; O/A, oligomycin+antimycin A). (B) INS-1 cells transfected with mRFP-LC3 were treated for 24 h and stained with Ab to TOMM20, a mitochondrial outer membrane protein, to visualize autophagosomes colocalized with TOMM20, thus the occurrence of mitophagy (left). The number of RFP puncta colocalized with TOMM20 was counted (right). Scale bar: 5 μm. n = 20. (C) INS-1 cells transfected with pMito-Keima were cultured without mitochondrial stressors in the presence or absence of FK506 for 72 h. Fluorescent microscopy was performed as in (A) (left). The number of acidic Mito-Keima puncta per cell (middle) and Mito-Keima red:green ratio representing mitophagy (right) were calculated. Scale bar: 10 μm. n = 30. (D) INS-1 cells transfected with pMito-Keima were incubated in hypoxic chamber (1% O2) for 24 h with or without FK506. Fluorescence microscopy was performed as in (A) (left). The number of acidic Mito-Keima puncta per cell (right upper) and Mito-Keima red:green ratio representing mitophagy (right lower) were calculated. Scale bar: 5 μm. n = 20. (E and F) After O/A treatment of INS-1 cells for 1 (E) or 24 h (F) with or without FK506 pretreatment for 1 h, cells were stained with MitoTracker Green to visualize mitochondria (left). Average length of mitochondria was measured to estimate mitochondrial fission (right). Scale bar: 10 μm. n = 8. Cells in the rectangles were magnified. All data in this figure are the means ± SEM from more than three independent experiments. **P < 0.01, ***P < 0.001 by one-way ANOVA with Tukey’s test (A,B,D,E,F) or two-tailed t-test (C). ns: not significant.
Figure 2.
Figure 2.
Effect of FK506 on TFEB nuclear translocation. (A) After treatment of TFEB-GFP- transfected INS-1 cells with rotenone or O/A for 4 h with or without FK506 pretreatment for 1 h, fluorescent microscopy was conducted (left). TFEB nucleus:cytosol fluorescence ratio was determined using ImageJ software (right). Scale bar: 50 μm. n = 50. (B) After rotenone or O/A treatment of TFE3-GFP-transfected INS-1 cells with or without FK506 pretreatment as in (A), fluorescent microscopy was conducted (left). TFE3 nucleus:cytosol fluorescence ratio was determined (right). Scale bar: 50 μm. n = 50. (C) After treatment of INS-1 cells with rotenone or O/A with or without pretreatment with FK506, cells were fractionated by centrifugation. Cytoplasmic and nuclear fractions were subjected to immunoblot analysis using the indicated Abs. Densitometric values after ImageJ analysis of the band intensity normalized to that of GAPDH (middle) or LMNA (lamin A) band (right) were compared between groups. Representative immunoblots are presented (left). n = 3. (D) After transfection of INS-1 cells with TFEB-GFP or constitutively active TFEB∆N30-GFP together with mRFP-LC3, cells were treated with rotenone or O/A for 4 h with or without FK506 pretreatment for 1 h. After immunostaining with anti-TOMM20 Ab, mRFP-LC3 puncta colocalized with TOMM20 were visualized by confocal microscopy as in Figure 1B (left). The number of mRFP-LC3 puncta colocalized with TOMM20 was counted (right). Scale bar: 5 μm. n = 20. All data in this figure are the means ± SEM from more than three independent experiments. *P < 0.05, **P < 0.01, ***P < 0.001 by one-way ANOVA with Tukey’s test.
Figure 3.
Figure 3.
Effect of MSL-7, an autophagy enhancer, on FK506-mediated suppression of mitophagy and TFEB nuclear translocation. (A) After FK506 treatment of pMito-Keima-transfected INS-1 cells for 18 h in the presence or absence of MSL-7 pretreatment for 1 h, fluorescent microscopy was performed as in Figure 1A (left). The number of acidic Mito-Keima puncta (middle) and Mito-Keima red:green ratio representing mitophagy (right) were calculated. Scale bar: 5 μm. n = 30. (B) After FK506 treatment for 4 h of TFEB-GFP-transfected INS-1 cells with or without MSL-7 pretreatment for 1 h, fluorescent microscopy was conducted (left). TFEB nucleus:cytosol fluorescence ratio was determined (right). Scale bar: 20 μm. n = 30. (C) After FK506 treatment of pMito-Keima-transfected Tfeb-KO INS-1 cells or control cells (Con) for 18 h in the presence or absence of MSL-7 pretreatment for 1 h, fluorescent microscopy was performed to visualize mitophagy as in (A) (upper). The number of acidic Mito-Keima puncta (lower left) and Mito-Keima red:green ratio representing mitophagy (lower right) were calculated. Scale bar: 5 μm. n = 20. Cells in the rectangles were magnified. All data in this figure are the means ± SEM from more than three independent experiments. *P < 0.05, ***P < 0.001 by one-way ANOVA with Tukey’s test.
Figure 4.
Figure 4.
Effect of autophagy enhancer on FK506-induced mitochondrial dysfunction. (A) Rotenone (Rot)-treated INS-1 cells were allowed to recover in a fresh medium containing FK506 without rotenone in the presence or absence of MSL-7 for 48 h. Mitochondrial potential was determined by flow cytometry after TMRE staining (left). Area representing low mitochondrial potential was calculated (right). n = 4. (B) In INS-1 cells allowed to recover from rotenone-induced mitochondrial stress in a fresh medium containing FK506 without rotenone in the presence or absence of MSL-7 as in (A), mitochondrial ROS was determined using MitoSOX (right). Representative flow cytometric scattergrams are presented (left). n = 4. (C) INS-1 cells transfected with pMito-Keima were incubated with rotenone for 4 h and were allowed to recover in a fresh medium with or without FK506 in the presence or absence of MSL-7 for 6 h. Mito-Keima fluorescence was visualized as in Figure 1A (left). The number of acidic Mito-Keima puncta per cell (middle) and Mito-Keima red:green ratio representing mitophagy (right) were calculated. Scale bar: 5 μm. n = 20. (D) Mitochondrial oxygen consumption rate (OCR) was determined in INS-1 cells treated with FK506 for 72 h in the presence or absence of MSL-7 (upper). Basal, ATP-coupled and maximal oxygen consumption were determined from the OCR curves (lower) (AA, antimycin A; FCCP, carbonyl cyanide 4-(trifluoromethoxy)phenylhydrazone). n = 6. (E) Glucose-induced insulin release from INS-1 cells was determined in a medium containing FK506 in the presence or absence of MSL-7 using ELISA, as described in the Material and methods. n = 5. (F) After pretreatment of INS-1 cells with FK506 in the presence or absence of MSL-7, cells were treated with rotenone or O/A for 6 h. Expression of the indicated genes was examined by real-time RT-PCR. n = 4. All data in this figure are the means ± SEM from more than three independent experiments. *, †, §, ¶P < 0.05, **, ††, ‡‡, §§, ¶¶P < 0.01, ***, †††, ‡‡‡, ¶¶¶P < 0.001 by one-way ANOVA with Tukey’s test. *, compared to Veh-treated cells; †, compared to cells treated with Rot alone; ‡, compared to cells treated with O/A alone; §, compared to FK506+Rot-treated cells; ¶, compared to FK506+O/A-treated cells.
Figure 5.
Figure 5.
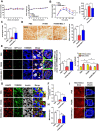
Effect of FK506 on glucose profile and β-cell function in vivo. (A) C57BL/6 mice were treated with daily administration of 10 mg/kg FK506 for 8 weeks with or without combined administration of 50 mg/kg MSL-7 treatment three times a week. Non-fasting blood glucose (left) and body weight (right) were monitored. n = 5. (B) After treatment of C57BL/6 for 8 weeks as in (A), intraperitoneal GTT was performed (left). Area under the curve (AUC) was calculated (right). n = 11. (C) In mice treated with FK506 as in (A), insulinogenic index was calculated as described in the Materials and methods. n = 9–15. (D) Mitochondrial COX activity in pancreatic islets of mice treated as in (B) was determined as described in the Materials and methods, and expressed as the mean pixel intensity per islet area (right). Representative DAB images are presented (left). Scale bar: 50 μm. n = 5. (E) GFP-RFP-LC3-transgenic mice were treated with daily administration of 10 mg/kg FK506 for 8 weeks with or without combined administration of 50 mg/kg MSL-7 treatment three times a week for 8 weeks. The number of RFP puncta colocalized with TOMM20 in pancreatic islets was counted (middle). Representative fluorescence images of RFP puncta colocalized with TOMM20 are presented (left). The number of red puncta representing autolysosome or autophagic flux and that of yellow puncta representing autophagosome was counted (right). Arrows indicate RFP puncta colocalized with TOMM20. Scale bar: 5 μm. n = 8–10. (F and G) In pancreatic sections of the mice of (E), colocalization of LAMP2 spot, a lysosomal marker, with TOMM20 was estimated by Pearson’s correlation analysis (F). Representative fluorescence images are presented (G). Arrows indicate LAMP2 spots colocalized with TOMM20. Scale bar: 10 μm. n = 8. (H and I) %mitophagy level in pancreatic islets of FK506-injected Mito-Keima-transgenic mice with or without combined administration of MSL-7 was calculated as described in the Materials and method (H). Representative Mito-Keima red fluorescence images in pancreatic islets identified by insulin immunofluorescence are presented (I). Scale bar: 10 (boxed areas) or 20 µm. n = 6–7. Cells in the rectangles were magnified. All data in this figure are the means ± SEM from more than three independent experiments. *P < 0.05, **P < 0.01, ***P < 0.001 by one-way ANOVA with Tukey’s test (B-F) or two-way ANOVA with Bonferroni’s test (A,B). ns: not significant.

Similar articles

Cited by

References

    1. Nichols CG, Shyng SL, Nestorowicz A, et al. Adenosine diphosphate as an intracellular regulator of insulin secretion. Science. 1996;272(5269):1785–1787. DOI:10.1126/science.272.5269.1785 - DOI - PubMed
    1. Mizushima N, Komatsu M.. Autophagy: renovation of cells and tissues. Cell. 2011;147(4):728–741. - PubMed
    1. Narendra D, Tanaka A, Suen DF, et al. Parkin is recruited selectively to impaired mitochondria and promotes their autophagy. J Cell Biol. 2008;183(5):795–803. DOI:10.1083/jcb.200809125 - DOI - PMC - PubMed
    1. Wei H, Liu L, Chen Q. Selective removal of mitochondria fia mitophagy: distinct pathways for different mitochondrial stress. Biochim Biophys Acta. 2015;1853(10):2784–2790. - PubMed
    1. Settembre C, De Cegli R, Mansueto G, et al. TFEB controls cellular lipid metabolism through a starvation-induced autoregulatory loop. Nat Cell Biol. 2013;15(6):647–658. DOI:10.1038/ncb2718 - DOI - PMC - PubMed

Publication types

MeSH terms