. 2022 Nov;9(11):1715-1726.
doi: 10.1002/acn3.51668. Epub 2022 Oct 10.

Predicting the disease severity in male individuals with ornithine transcarbamylase deficiency

Collaborators, Affiliations

Predicting the disease severity in male individuals with ornithine transcarbamylase deficiency

Svenja Scharre et al. Ann Clin Transl Neurol. 2022 Nov.

Abstract

Objective: Ornithine transcarbamylase deficiency (OTC-D) is an X-linked metabolic disease and the most common urea cycle disorder. Due to high phenotypic heterogeneity, ranging from lethal neonatal hyperammonemic events to moderate symptoms and even asymptomatic individuals, the prediction of the disease course at an early disease stage is very important to individually adjust therapies such as medical treatment or liver transplantation. In this translational study, we developed a severity-adjusted classification system based on in vitro residual enzymatic OTC activity.

Methods: Applying a cell-based expression system, residual enzymatic OTC activities of 71 pathogenic OTC variants were spectrophotometrically determined and subsequently correlated with clinical and biochemical outcome parameters of 119 male individuals with OTC-D (mOTC-D) as reported in the UCDC and E-IMD registries.

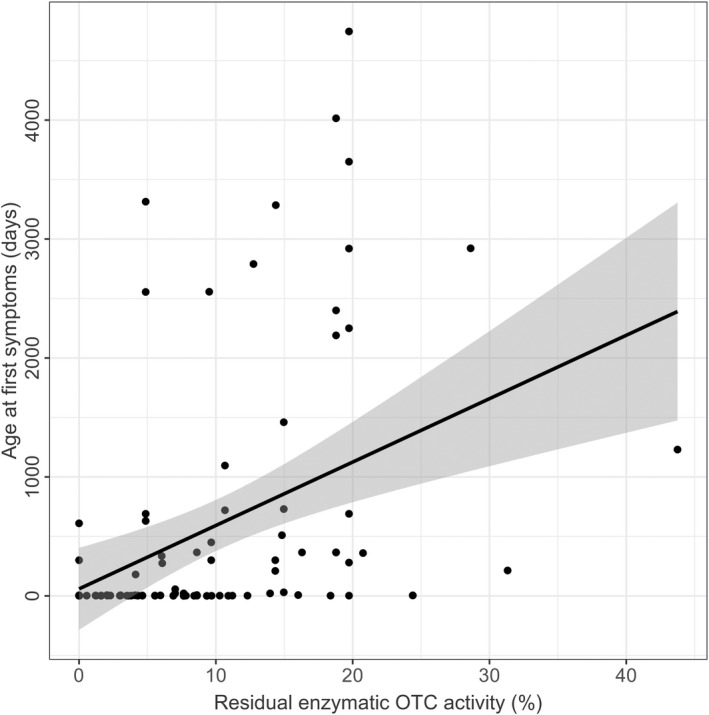
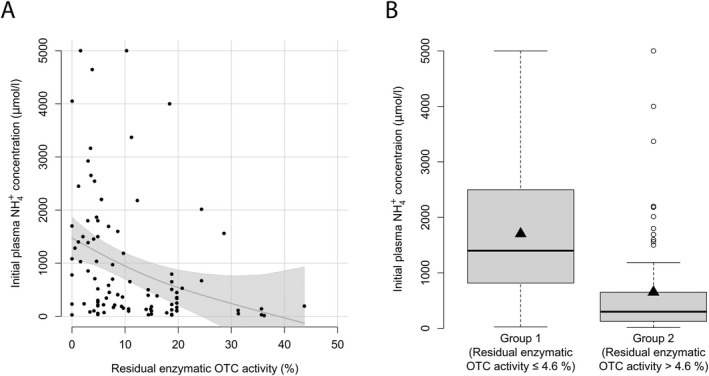
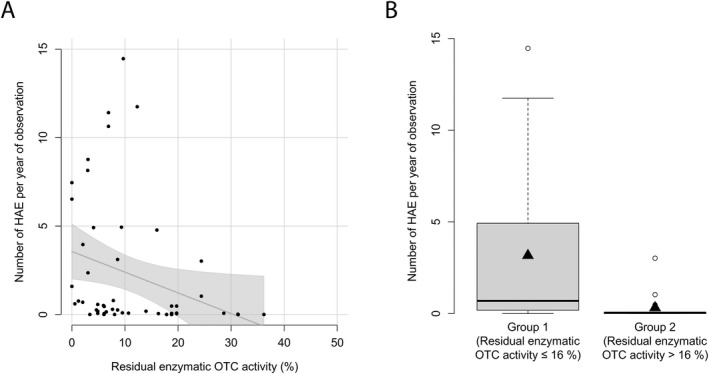
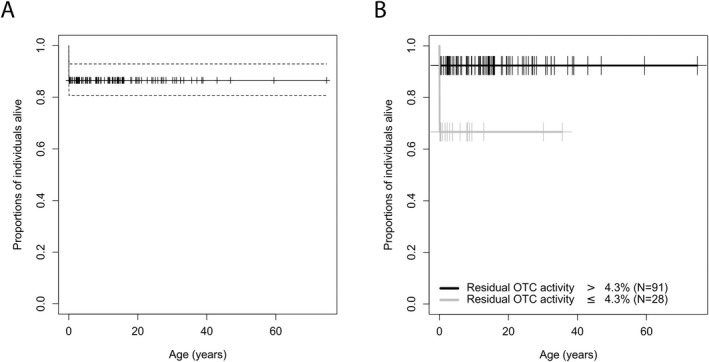
Results: Integration of multiple data sources enabled the establishment of a robust disease prediction model for mOTC-D. Residual enzymatic OTC activity not only correlates with age at first symptoms, initial peak plasma ammonium concentration and frequency of metabolic decompensations but also predicts mortality. The critical threshold of 4.3% residual enzymatic activity distinguishes a severe from an attenuated phenotype.

Interpretation: Residual enzymatic OTC activity reliably predicts the disease severity in mOTC-D and could thus serve as a tool for severity-adjusted evaluation of therapeutic strategies and counselling patients and parents.


Conflict of interest statement

SK received EU funding for the European registry and network for Intoxication type Metabolic Diseases (E‐IMD; CHAFEA agreement no. 2010 12 01). SK receives funding from Immedica Pharma AB for the European Post‐Authorization Registry for Ravicti® (glycerol phenylbutyrate) oral liquid in partnership with the E‐IMD (RRPE) (EU PAS Register no. EUPAS17267; http://www.encepp.eu/). SK and GFH receive funding from the Dietmar Hopp Foundation (St. Leon‐Rot, Germany) for a pilot study on extended newborn screening evaluating the technical feasibility, diagnostic process quality and health benefits for 28 inherited metabolic diseases including UCDs (NBS 2025, project no. 1DH1911376, 1DH2011117). GFH received lecture fees from Swedish Orphan Biovitrum GmbH. RP receives consultancy fees from Immedica Pharma AB. The sponsors have in no way influenced the design, conductance, analysis and report of the present study. All other authors declare that they have no conflict of interest.

Figures

Figure 1
Figure 1
Residual enzymatic OTC activity predicts age at first symptoms. Age at first symptoms (days) subject to residual enzymatic OTC activity (%). Each point represents a single patient (n = 100). The grey line displays the estimated regression curve. Linear regression, p < 0.0001, R 2 = 0.16.
Figure 2
Figure 2
Residual enzymatic OTC activity correlates with initial plasma NH4 + max. (A) Initial plasma NH4 + max (μmol/L) subject to residual enzymatic OTC activity (%) as determined in the expression system. Each point represents a single patient (n = 98). The grey line displays the estimated regression curve. GAM analysis, p = 0.004, R 2 = 0.102. (B) Box plot illustrating initial NH4 + max (μmol/L) with residual enzymatic OTC activity below or equal to 4.6% (n = 27) and above 4.6% (n = 71). Data are shown as median (black thick line) and mean (triangle), length of the box corresponds to interquartile range (IQR) and upper and lower whiskers correspond to the max. of 1.5 × IQR, each point represents an outlier. Recursive partitioning, p = 0.001.
Figure 3
Figure 3
Residual enzymatic OTC activity predicts number of HAE per year. (A) Number of HAE (NH4 + max ≥ 100 μmol/L) per year of observation subject to residual enzymatic OTC activity (%). Each point represents a single patient (n = 52). The grey line displays the estimated regression curve. GAM‐analysis, p = 0.04, R 2 = 0.06. (B) Boxplot illustrating number of HAE (NH4 + max ≥ 100 μmol/L) per year of observation with residual enzymatic OTC activity below or equal to 16.0% (n = 35) or above 16.0% (n = 17). Data are shown as median (black thick line) and mean (triangle), length of the box corresponds to IQR and upper and lower whiskers correspond to the max. of 1.5 × IQR, each point represents an outlier. Recursive partitioning, p = 0.04.
Figure 4
Figure 4
Residual enzymatic OTC activity correlates with mortality. Kaplan–Meier curve illustrating estimated overall survival (A) in total and (B) with residual enzymatic OTC activity below or equal to 4.3% (n = 28, grey) or above 4.3% (n = 91, black). Censored individuals are marked with a “+”. Of the two remaining (non‐representative) individuals above the age of 55 years, one individual has been censored who died at the age of 59 years due to an epileptic state. Dotted lines are indicating the confidence interval of 95%. Recursive partitioning, p = 0.003.

References

    1. Batshaw ML, Tuchman M, Summar M, Seminara J, Members of the urea cycle disorders C . A longitudinal study of urea cycle disorders. Mol Genet Metab. 2014;113(1‐2):127‐130. - PMC - PubMed
    1. Nettesheim S, Kolker S, Karall D, et al. Incidence, disease onset and short‐term outcome in urea cycle disorders ‐cross‐border surveillance in Germany, Austria and Switzerland. Orphanet J Rare Dis. 2017;12(1):111. - PMC - PubMed
    1. Summar ML, Koelker S, Freedenberg D, et al. The incidence of urea cycle disorders. Mol Genet Metab. 2013;110(1‐2):179‐180. - PMC - PubMed
    1. Ah Mew N, Krivitzky L, McCarter R, Batshaw M, Tuchman M. Urea cycle disorders consortium of the rare diseases clinical research N. clinical outcomes of neonatal onset proximal versus distal urea cycle disorders do not differ. J Pediatr. 2013. Feb;162(2):324‐9 e1. - PMC - PubMed
    1. Bachmann C. Outcome and survival of 88 patients with urea cycle disorders: a retrospective evaluation. Eur J Pediatr. 2003. Jun;162(6):410‐416. - PubMed

Publication types

MeSH terms