Review
. 2022 Oct 5:10:e14082.
doi: 10.7717/peerj.14082. eCollection 2022.

The soccer season: performance variations and evolutionary trends

Affiliations
Review

The soccer season: performance variations and evolutionary trends

Joao Renato Silva. PeerJ. .

Abstract

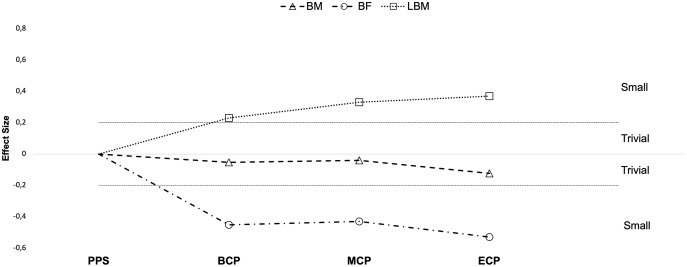
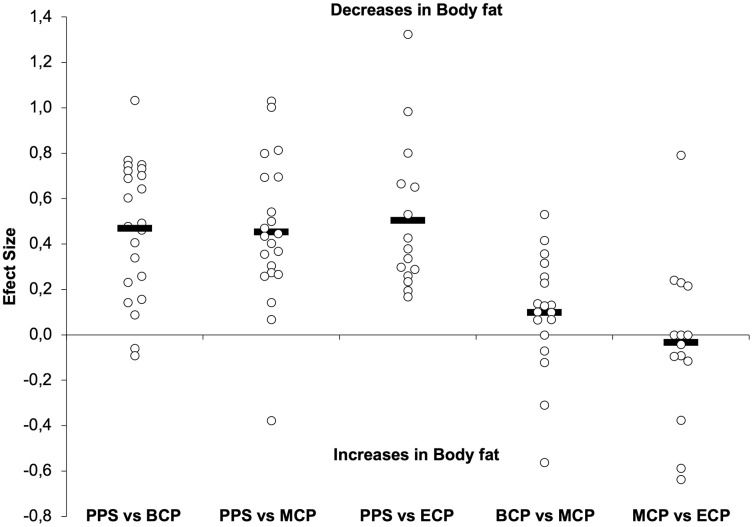
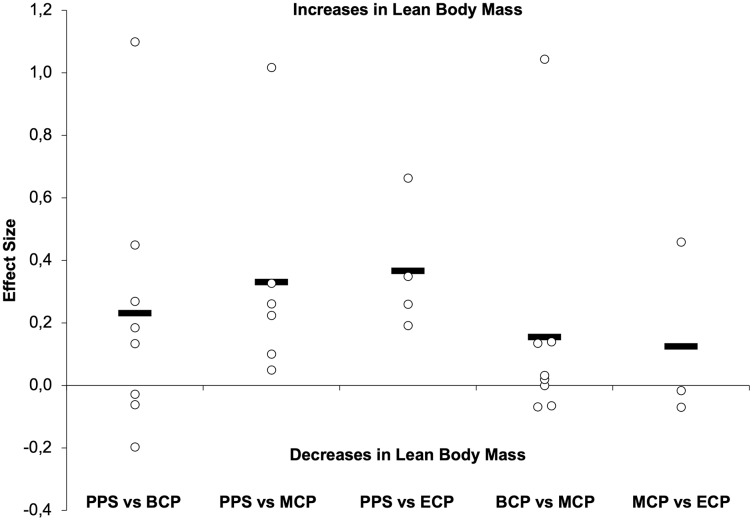
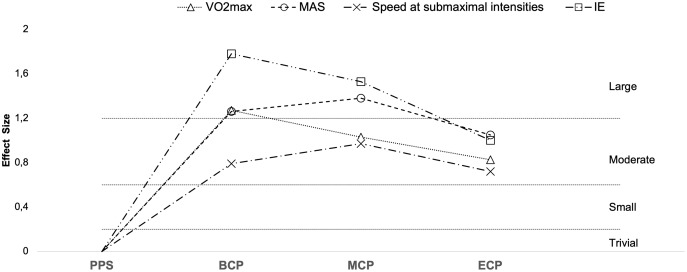
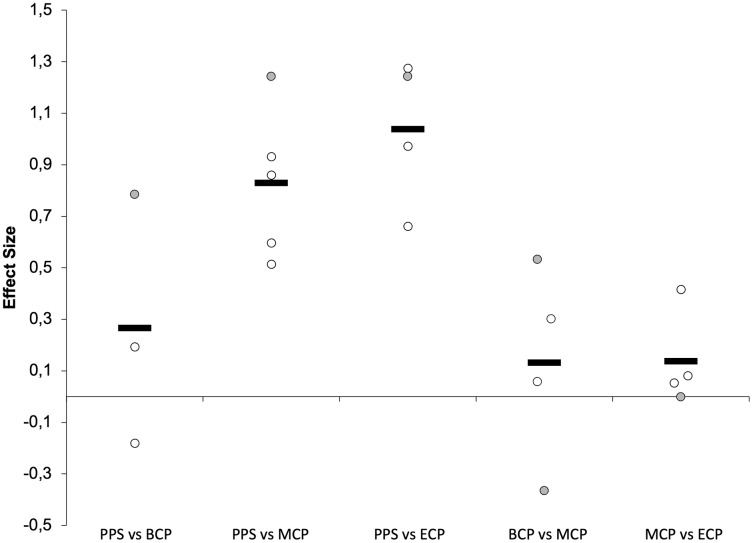
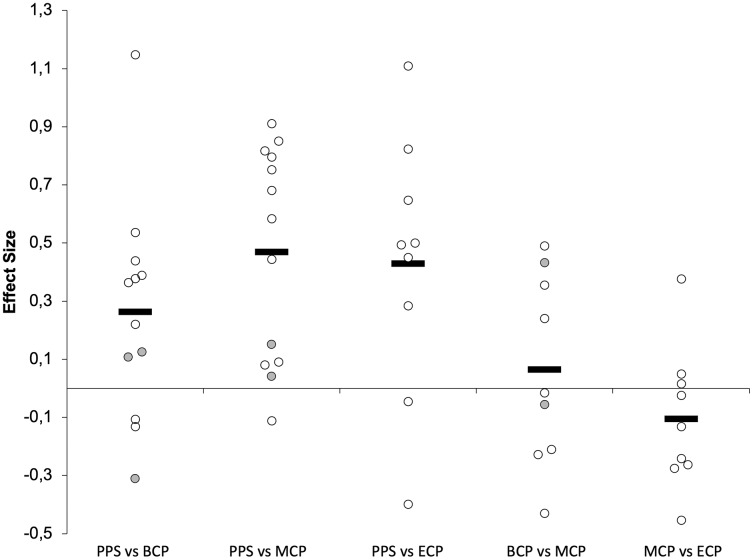
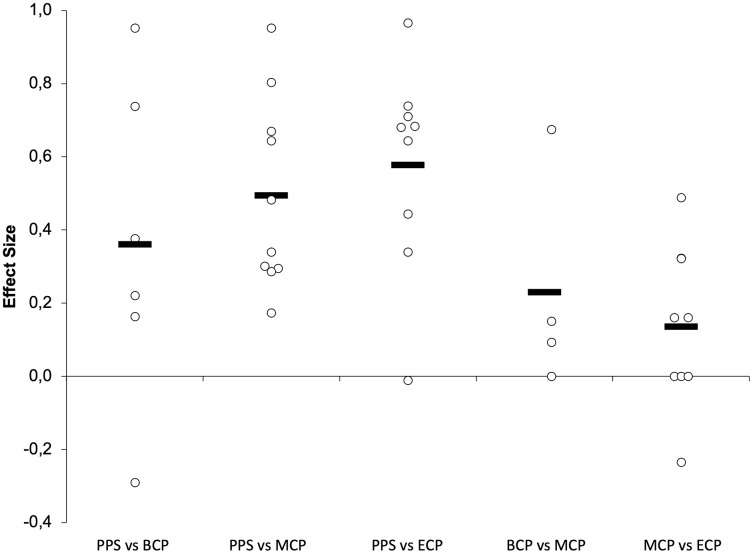
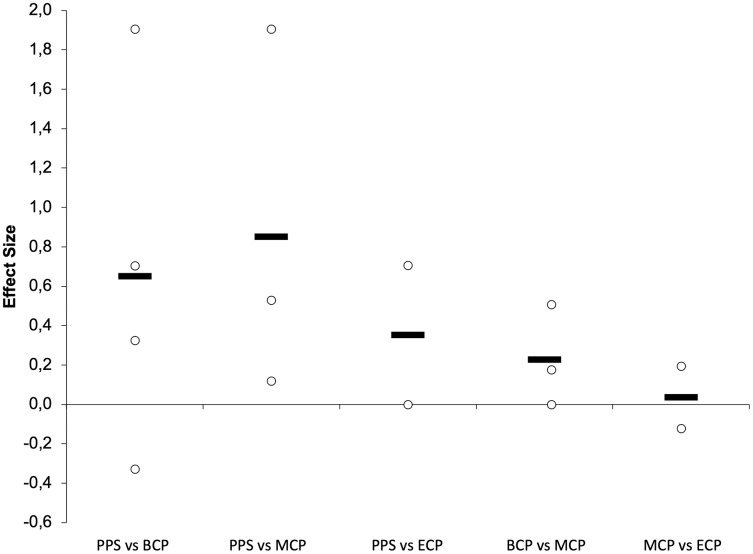
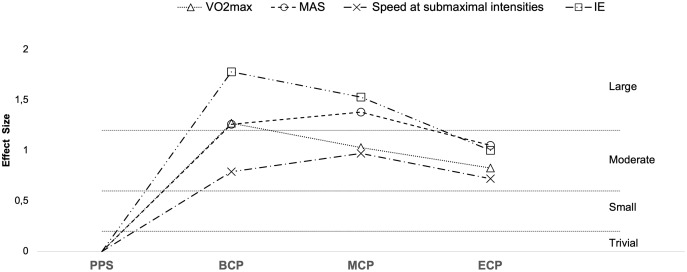
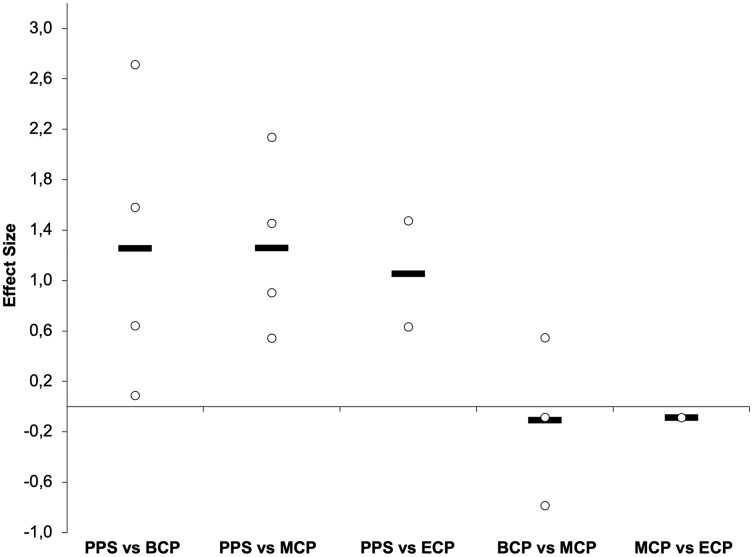
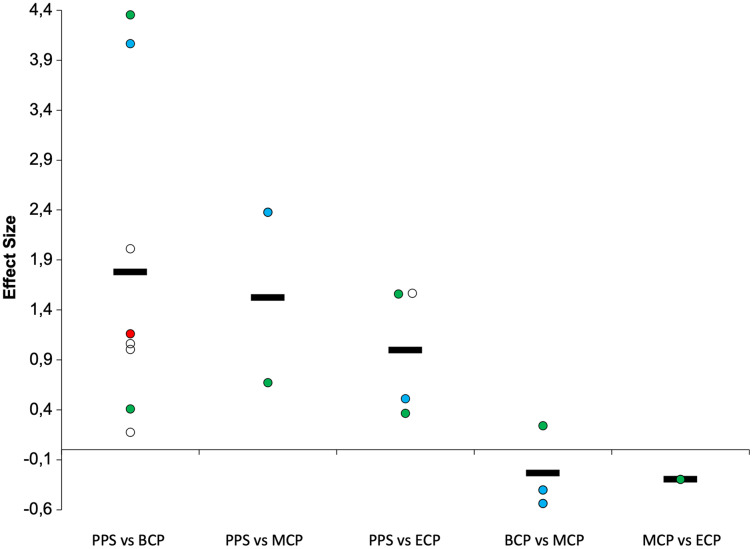
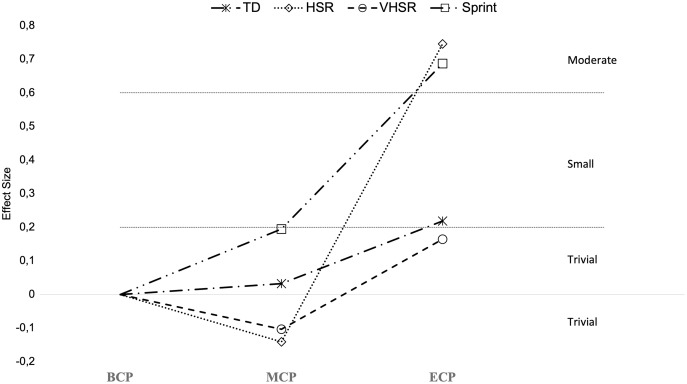
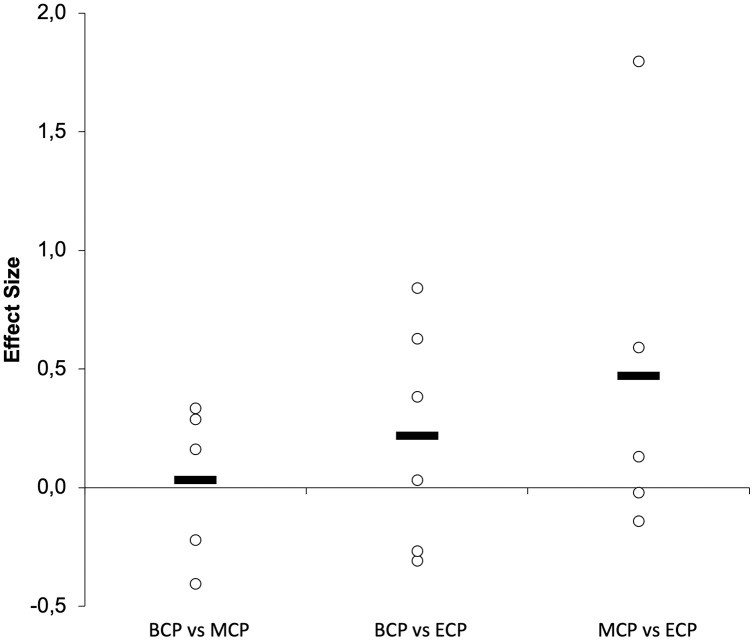
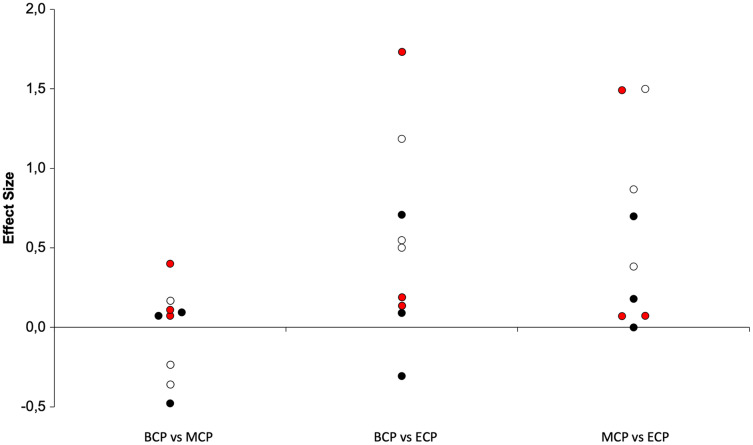
The physiological demands of soccer challenge the entire spectrum of the response capacity of the biological systems and fitness requirements of the players. In this review we examined variations and evolutionary trends in body composition, neuromuscular and endurance-related parameters, as well as in game-related physical parameters of professional players. Further, we explore aspects relevant for training monitoring and we reference how different training stimulus and situational variables (e.g., competition exposure) affect the physiological and performance parameters of players. Generally, improvements of small magnitude in non- (non-CMJ) and countermovement-based jumps (CMJBased) and in the sprint acceleration (ACCPhase) and maximal velocity phase (MVPhase) are observed from start of preparation phase (PPS) to beginning of competition phase (BCP). A greater magnitude of increases is observed in physiological and endurance performance measures within this period; moderate magnitude in sub-maximal intensity exercise (velocity at fixed blood lactate concentrations; V2-4mmol/l) and large magnitude in VO2max, maximal aerobic speed (MAS) and intense intermittent exercise performance (IE). In the middle of competition phase (MCP), small (CMJBased and ACCPhase), moderate (non-CMJ; MVPhase; VO2max; sub-maximal exercise) and large (MAS and IE) improvements were observed compared to PPS. In the end of competition period (ECP), CMJBased and MVPhase improve to a small extent with non-CMJ, and ACCPhase, VO2max, MAS, sub-maximal intensity exercise and IE revealing moderate increments compared to PPS. Although less investigated, there are generally observed alterations of trivial magnitude in neuromuscular and endurance-related parameters between in-season assessments; only substantial alterations are examined for IE and sub-maximal exercise performance (decrease and increase of small magnitude, respectively) from BCP to MCP and in VO2max and IE (decrements of small magnitude) from MCP to ECP. Match performance may vary during the season. Although, the variability between studies is clear for TD, VHSR and sprint, all the studies observed substantial increments in HSR between MCP and ECP. Finally, studies examining evolutionary trends by means of exercise and competition performance measures suggests of a heightened importance of neuromuscular factors. In conclusion, during the preseason players "recover" body composition profile and neuromuscular and endurance competitive capacity. Within in-season, and more robustly towards ECP, alterations in neuromuscular performance seem to be force-velocity dependent, and in some cases, physiological determinants and endurance performance may be compromised when considering other in-season moments. Importantly, there is a substantial variability in team responses that can be observed during in-season. Consequently, this informs on the need to both provide a regular training stimulus and adequate monitorization throughout the season.

Keywords: Body composition; Endurance training; Football; Match activity; Neuromuscular training; Power; Soccer physiology; Time-motion analysis; Training and testing; Training monitoring.


Conflict of interest statement

The authors declare that they have no competing interests.

Figures

Figure 1
Figure 1. Seasonal variations in body composition (average weighted effect sizes).
BM, body mass; BF, absolute and relative body fat; LBM, lean body mass; PPS, prior preseason phase; BCP, beginning competition phase; MCP, middle competition phase; ECP, end of competition phase.
Figure 2
Figure 2. Seasonal variations in absolute and relative body fat (weighted effect sizes).
PPS, prior preseason phase; BCP, beginning competition phase; MCP, middle competition phase; ECP, end of competition phase; dashed line represents average values.
Figure 3
Figure 3. Seasonal variations in lean body mass (weighted effect sizes).
PPS, prior preseason phase; BCP, beginning competition phase; MCP, middle competition phase; ECP, end of competition phase; dashed line represents average values.
Figure 4
Figure 4. Seasonal variations in neuromuscular performance (average weighted effect sizes).
CMJBased, single actions including countermovement (countermovement jump with and without arm swing); Non-CMJ, single actions not including a countermovement (squat jump with and without arm swing); ACCPhase, acceleration phase (5-10-15 and 20 m distances); MVPhase, maximal velocity phase (30 and 50 m distances); PPS, prior preseason phase; BCP, beginning competition phase; MCP, middle competition phase; ECP, end of competition phase.
Figure 5
Figure 5. Seasonal variations in non-countermovement jumps within the different studies (weighted effect sizes).
PPS, prior preseason phase; BCP, beginning competition phase; MCP, middle competition phase; ECP, end of competition phase; gray filled circles (squat jump with arm swing); white filled circles, squat jump without arm swing; dashed line represents average values.
Figure 6
Figure 6. Seasonal variations in countermovement-based jumps (weighted effect sizes).
PPS, prior preseason phase; BCP, beginning competition phase; MCP, middle competition phase; ECP, end of competition phase; gray filled circles (countermovement-jump with arm swing); white filled circles, countermovement-jump without arm swing; dashed line represents average values.
Figure 7
Figure 7. Seasonal variations in the acceleration phase of the sprint (weighted effect sizes).
PPS, prior preseason phase; BCP, beginning competition phase; MCP, middle competition phase; ECP, end of competition phase; dashed line represents average values.
Figure 8
Figure 8. Seasonal variations in the maximal velocity phase of the sprint (weighted effect sizes).
PPS, prior preseason phase; BCP, beginning competition phase; MCP, middle competition phase; ECP, end of competition phase; dashed line represents average values.
Figure 9
Figure 9. Seasonal variations in physiological determinants and endurance performance (average weighted effect sizes).
VO2Max, maximal oxygen consumption; Speed at sub-maximal intensities- speed recorded at blood lactate concentrations of 2 and 4 mmol−1; MAS, maximal aerobic speed; IE, high-intensity intermittent exercise (30–15 and YO-YO tests); PPS, prior preseason phase; BCP, beginning competition phase; MCP, middle competition phase; ECP, end of competition phase.
Figure 10
Figure 10. Seasonal variations in VO2Max (weighted effect sizes).
PPS, prior preseason phase; BCP, beginning competition phase; MCP, middle competition phase; ECP, end of competition phase; dashed line represents average values.
Figure 11
Figure 11. Seasonal variations in maximal aerobic speed (weighted effect sizes).
PPS, prior preseason phase; BCP, beginning competition phase; MCP, middle competition phase; ECP, end of competition phase; Dashed line represents average values.
Figure 12
Figure 12. Seasonal variations in intense intermittent endurance performance (weighted effect sizes).
PPS, prior preseason phase; BCP, beginning competition phase; MCP, middle competition phase; ECP, end of competition phase; white filled circles (YYIR1); blue filled circles (YYIR2); green filled circles (YYIE2); red filled circles (30–15 test); Dashed line represents average values.
Figure 13
Figure 13. Seasonal variations in game-related physical parameters (average weighted effect sizes).
TD, total distance covered; HSR, high-speed running distance; VHSR, very-high-speed running distance; Sprint, sprint distance. BCP, beginning competition phase; MCP, middle competition phase; ECP, end of competition phase.
Figure 14
Figure 14. Seasonal variations in total distance covered (weighted effect sizes).
BCP, beginning competition phase; MCP, middle competition phase; ECP, end of competition phase; Dashed line represents average values.
Figure 15
Figure 15. Seasonal variations in high-intensity speed zones (weighted effect sizes).
BCP, beginning competition phase; MCP, middle competition phase; ECP, end of competition phase; white filled circles (HSR); black filled circles (VHSR); red filled circles (Sprint).

References

    1. Abt G, Lovell R. The use of individualized speed and intensity thresholds for determining the distance run at high-intensity in professional soccer. Journal of Sports Sciences. 2009;27(9):893–898. doi: 10.1080/02640410902998239. - DOI - PubMed
    1. Akyildiz Z, Nobari H, Gonzalez-Fernandez FT, Praca GM, Sarmento H, Guler AH, Saka EK, Clemente FM, Figueiredo AJ. Variations in the physical demands and technical performance of professional soccer teams over three consecutive seasons. Scientific Reports. 2022;12(1):2412. doi: 10.1038/s41598-022-06365-7. - DOI - PMC - PubMed
    1. Al Attar WSA, Soomro N, Sinclair PJ, Pappas E, Sanders RH. Effect of injury prevention programs that include the nordic hamstring exercise on hamstring injury rates in soccer players: a systematic review and meta-analysis. Sports Medicine. 2017;47(5):907–916. doi: 10.1007/s40279-016-0638-2. - DOI - PubMed
    1. Allen WJC, De Keijzer KL, Raya-Gonzalez J, Castillo D, Coratella G, Beato M. Chronic effects of flywheel training on physical capacities in soccer players: a systematic review. Research in Sports Medicine. 2021;11(1):1–21. doi: 10.1080/15438627.2021.1958813. - DOI - PubMed
    1. Altmann S, Kuberczyk M, Ringhof S, Neumann R, Woll A. Relationships between performance test and match-related physical performance parameters. German Journal of Exercise and Sport Research. 2018;48(2):218–227. doi: 10.1007/s12662-018-0519-y. - DOI

LinkOut - more resources