

Development and validation of a nomogram for predicting the overall survival of prostate cancer patients: a large population-based cohort study
- PMID: 36217401
- PMCID: PMC9547153
- DOI: 10.21037/tau-22-498
Development and validation of a nomogram for predicting the overall survival of prostate cancer patients: a large population-based cohort study
Abstract
Background: Prostate cancer (PC) is the second most common malignant tumor, and its survival is of great concern. However, the assessment of survival risk in current studies is limited. This study is to develop and validate a nomogram for the prediction of survival in PC patients using data from the Surveillance, Epidemiology, and End Results (SEER) database.
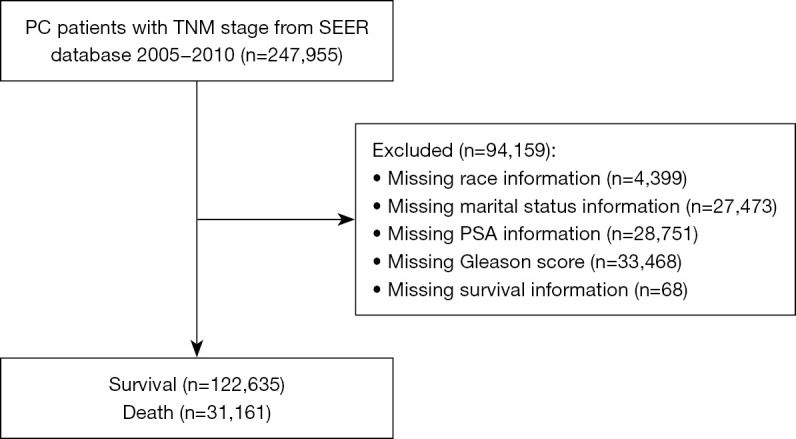
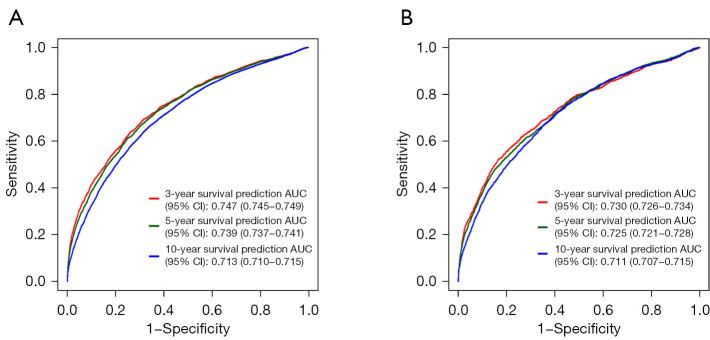
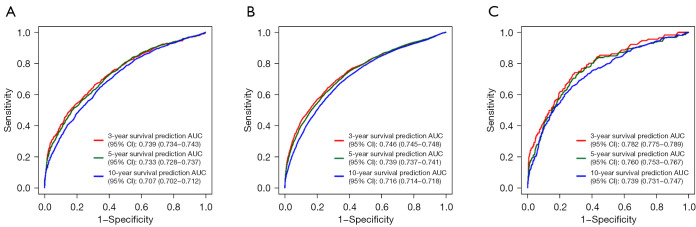
Methods: A total of 153,796 PC patients were included in this cohort study. Patients were divided into a training set (n=107,657) and a testing set (n=46,139). The 3-, 5- and 10-year survival of the PC patients were regarded as the outcomes. Predictors based on the demographic and pathological data for survival were identified by multivariate Cox regression analysis to develop the predictive nomogram. Internal and subgroup validations were performed to assess the predictive performance of the nomogram. The C-index, time-dependent receiver operating characteristic (ROC) curves, and corresponding areas under the ROC curves (AUCs) were used to estimate the predictive performance of the nomogram.
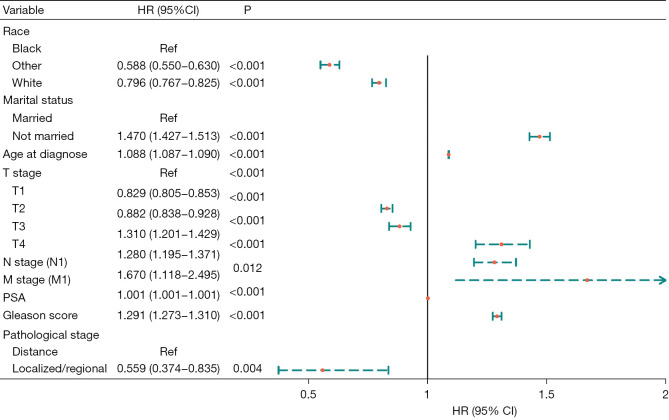
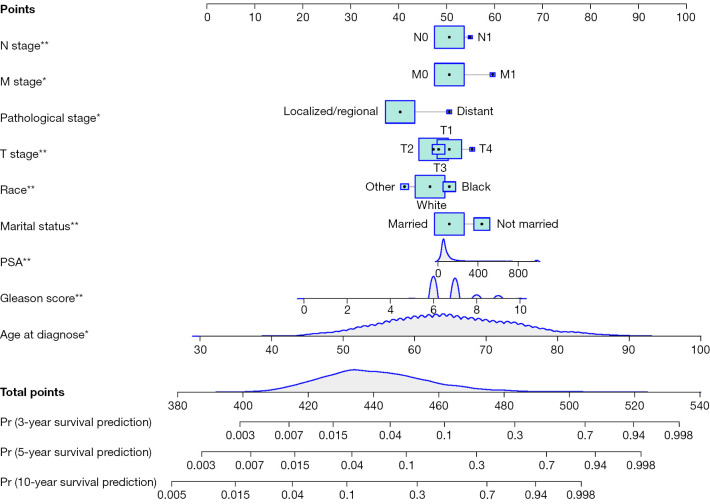
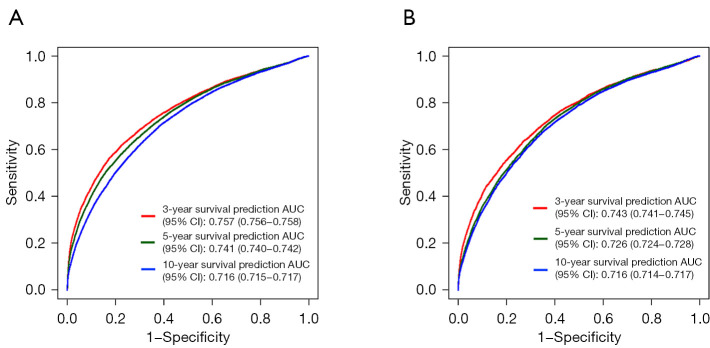
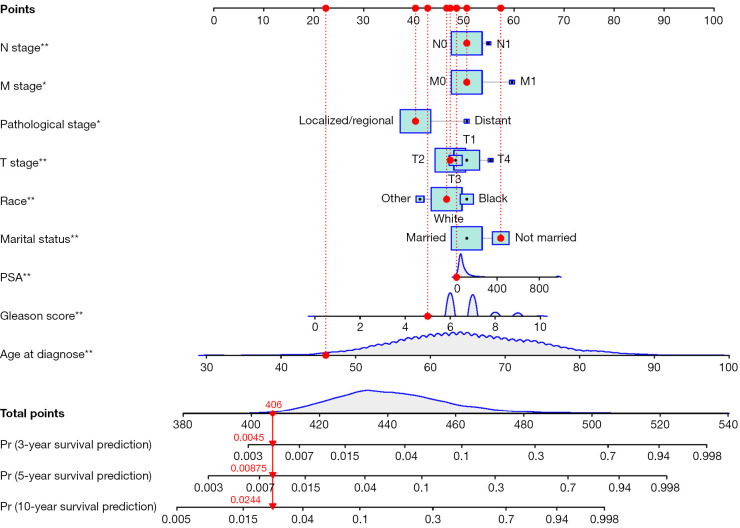
Results: Age at diagnosis, race, marital status, tumor node metastasis (TNM) stage, prostate specific antigen (PSA) status, Gleason score, and pathological stage were identified as significantly associated with the survival of PC patients (P<0.05). The C-index of the nomogram indicated a moderate predictive ability [training set: C-index =0.782, 95% confidence interval (CI): 0.779-0.785; testing set: C-index =0.782, 95% CI: 0.777-0.787]. The AUCs of this nomogram for the 3-, 5-, and 10-year survival were 0.757 (95% CI: 0.756-0.758), 0.741 (95% CI: 0.740-0.742), and 0.716 (95% CI: 0.715-0.717), respectively. The results of subgroup validation showed that all the AUCs for the nomogram at 3, 5, and 10 years were more than 0.70, regardless of marital status and race.
Conclusions: We developed a nomogram with the moderate predictive ability for the long-term survival (3-, 5-, and 10-year survival) of patients with PC.
Keywords: Prostate cancer; SEER database; nomogram; survival.
2022 Translational Andrology and Urology. All rights reserved.
Conflict of interest statement
Conflicts of Interest: All authors have completed the ICMJE uniform disclosure form (available at https://tau.amegroups.com/article/view/10.21037/tau-22-498/coif). The authors have no conflicts of interest to declare.
Figures
Similar articles
-
A Web-Based Prediction Model for Cancer-Specific Survival of Elderly Patients Undergoing Surgery With Prostate Cancer: A Population-Based Study.Front Public Health. 2022 Jul 12;10:935521. doi: 10.3389/fpubh.2022.935521. eCollection 2022. Front Public Health. 2022. PMID: 35903379 Free PMC article. Clinical Trial.
-
Development and validation of a survival prediction model for 113,239 patients with colon cancer: a retrospective cohort study.J Gastrointest Oncol. 2022 Oct;13(5):2393-2405. doi: 10.21037/jgo-22-878. J Gastrointest Oncol. 2022. PMID: 36388692 Free PMC article.
-
A nomogram for survival prediction in 275,812 U.S. patients with breast cancer: a population-based cohort study based on the SEER database.Gland Surg. 2022 Jul;11(7):1166-1179. doi: 10.21037/gs-22-321. Gland Surg. 2022. PMID: 35935563 Free PMC article.
-
Development and Validation of Nomograms to Predict Cancer-Specific Survival and Overall Survival in Elderly Patients With Prostate Cancer: A Population-Based Study.Front Oncol. 2022 Jun 23;12:918780. doi: 10.3389/fonc.2022.918780. eCollection 2022. Front Oncol. 2022. PMID: 35814387 Free PMC article.
-
Gender-specific nomogram models to predict the prognosis of male and female lung adenocarcinoma patients: a population-based analysis.Ann Transl Med. 2021 Nov;9(22):1654. doi: 10.21037/atm-21-5367. Ann Transl Med. 2021. PMID: 34988163 Free PMC article.
Cited by
-
Development and external validation of a nomogram to predict the prognosis of patients with metastatic prostate cancer who underwent radiotherapy.Gland Surg. 2024 Nov 30;13(11):2137-2147. doi: 10.21037/gs-24-313. Epub 2024 Nov 26. Gland Surg. 2024. PMID: 39678407 Free PMC article.
References
LinkOut - more resources
Full Text Sources
Research Materials
Miscellaneous