

Concurrent training and interindividual response in women with a high number of metabolic syndrome risk factors
- PMID: 36217503
- PMCID: PMC9546759
- DOI: 10.3389/fphys.2022.934038
Concurrent training and interindividual response in women with a high number of metabolic syndrome risk factors
Abstract
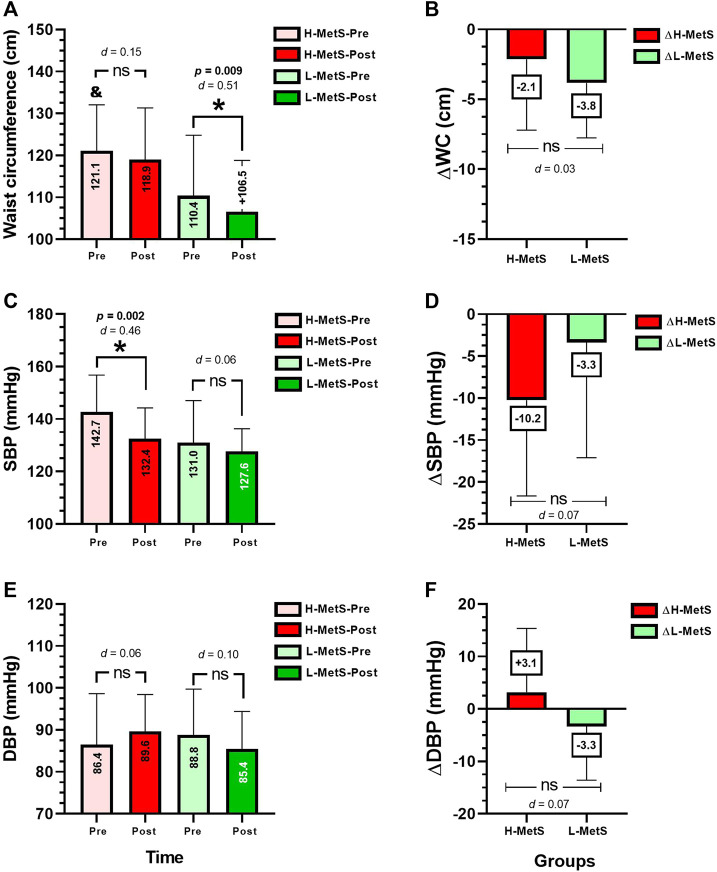
The non-responders (NRs) after exercise training have been poorly studied in populations with morbid obesity. The purpose of this study was to determine the NR prevalence after 20 weeks of concurrent training of morbidly obese women with a high or low number of metabolic syndrome (MetS) risk factors. Twenty-eight women with morbid obesity participated in an exercise training intervention and were allocated into two groups distributed based on a high (≥3, n = 11) or low number (<3, n = 17) of MetS risk factors. The main outcomes were waist circumference (WC), fasting plasma glucose (FPG), high-density lipids (HDL-c), triglycerides (Tg), and systolic (SBP) and diastolic (DBP) blood pressure, and secondary outcomes were body composition, anthropometric and physical fitness, determined before and after 20 weeks of concurrent training. NRs were defined as previously used technical error cut-off points for the MetS outcomes. Significantly different (all p < 0.05) prevalences of NRs between the H-MetS vs. L-MetS groups (respectively) in WC (NRs 18.2 % vs. 41.1 %, p < 0.0001), SBP (NRs 72.7 % vs. 47.0 %, p = 0.022), DBP (NRs 54.5 % vs. 76.4 %, p < 0.0001), FPG (NRs 100% vs. 64.8 %, p < 0.0001), and HDL-c (NRs 90.9 % vs. 64.7 %, p = 0.012) were observed. In addition, the H-MetS group evidenced significant changes on ΔSBP (-10.2 ± 11.4 mmHg), ΔFPG (-5.8 ± 8.2 mg/dl), ΔHDL-c (+4.0 ± 5.9 mg/dl), and ΔTg (-8.8 ± 33.8 mg/dl), all p < 0.05. The L-MetS group only showed significant changes in ΔWC (-3.8 ± 5.0 cm, p = 0.009). Comparing H-MetS vs. L-MetS groups, significant differences were observed in ∆FPG (-5.8 ± 8.2 vs. +0.3 ± 3.2 mg/dl, p = 0.027), but not in other MetS outcomes. In conclusion, 20 weeks of concurrent training promotes greater beneficial effects in morbidly obese patients with a high number of MetS risk factors. However, the NR prevalence for improving MetS outcomes was significantly superior in these more-diseased groups in SBP, FPG, and HDL-c, independent of their major training-induced effects.
Keywords: exercise; morbid obesity; physical activity; quality of life; sleep quality.
Copyright © 2022 Delgado-Floody, Chirosa-Ríos, Caamaño-Navarrete, Valdés-Badilla, Herrera-Valenzuela, Monsalves-Álvarez, Núñez-Espinosa, Castro-Sepulveda, Guzmán-Muñoz, Andrade and Álvarez.
Conflict of interest statement
The authors declare that the research was conducted in the absence of any commercial or financial relationships that could be construed as a potential conflict of interest.
Figures


Similar articles
-
The Effects of Two Different Concurrent Training Configurations on Markers of Metabolic Syndrome and Fitness in Women With Severe/Morbid Obesity: A Randomised Controlled Trial.Front Physiol. 2021 Sep 21;12:694798. doi: 10.3389/fphys.2021.694798. eCollection 2021. Front Physiol. 2021. PMID: 34621181 Free PMC article.
-
The Social Distance Impacts from COVID-19 Pandemic on the Development of Two Orders of a Concurrent Training Programme for Morbidly Obese Patients.Int J Environ Res Public Health. 2022 Oct 17;19(20):13408. doi: 10.3390/ijerph192013408. Int J Environ Res Public Health. 2022. PMID: 36293985 Free PMC article. Clinical Trial.
-
Characterizing the interindividual postexercise hypotension response for two order groups of concurrent training in patients with morbid obesity.Front Physiol. 2022 Oct 10;13:913645. doi: 10.3389/fphys.2022.913645. eCollection 2022. Front Physiol. 2022. PMID: 36299263 Free PMC article.
-
Effects of exercise training on metabolic syndrome risk factors in post-menopausal women - A systematic review and meta-analysis of randomised controlled trials.Clin Nutr. 2023 Mar;42(3):337-351. doi: 10.1016/j.clnu.2023.01.008. Epub 2023 Jan 10. Clin Nutr. 2023. PMID: 36736057
-
Effect of vegetarian diets on the presentation of metabolic syndrome or its components: A systematic review and meta-analysis.Clin Nutr. 2019 Jun;38(3):1117-1132. doi: 10.1016/j.clnu.2018.05.021. Epub 2018 Jun 6. Clin Nutr. 2019. PMID: 29907356
Cited by
-
Effects of concurrent continuous aerobic and short rest resistance exercise training on metabolic biomarkers in type 2 diabetes patients: a systematic review and meta-analysis.Diabetol Metab Syndr. 2025 Jul 21;17(1):290. doi: 10.1186/s13098-025-01838-x. Diabetol Metab Syndr. 2025. PMID: 40691799 Free PMC article. Review.
-
Average and Interindividual Effects to a Comprehensive Cardiovascular Rehabilitation Program.Int J Environ Res Public Health. 2022 Dec 24;20(1):261. doi: 10.3390/ijerph20010261. Int J Environ Res Public Health. 2022. PMID: 36612584 Free PMC article.
-
Interindividual Variability Response to Resistance and High-Intensity Interval Training on Blood Pressure Reduction in Hypertensive Older Adults.J Cardiovasc Dev Dis. 2025 Jan 16;12(1):30. doi: 10.3390/jcdd12010030. J Cardiovasc Dev Dis. 2025. PMID: 39852308 Free PMC article.
References
-
- Alberti K., Eckel R., Grundy S., Zimmet P., Cleeman J., Donato K., et al. (2009). Harmonizing the metabolic syndrome: A joint interim statement of the international diabetes federation task force on epidemiology and prevention; national heart, lung, and blood Institute; American heart association; world heart federation; international atherosclerosis society; and international association for the study of obesity. Circulation 120, 1640–1645. 10.1161/CIRCULATIONAHA.109.192644 - DOI - PubMed
-
- Álvarez C., Ramírez-Campillo R., Ramírez-Vélez R., Izquierdo M. (2017). Effects and prevalence of nonresponders after 12 weeks of high-intensity interval or resistance training in women with insulin resistance: A randomized trial. J. Appl. Physiol. 122, 985–996. 10.1152/japplphysiol.01037.2016 - DOI - PubMed
-
- Álvarez C., Ramírez-Campillo R., Cristi-Montero C., Ramírez-Vélez R., Izquierdo M. (2018). Prevalence of non-responders for blood pressure and cardiometabolic risk factors among prehypertensive women after long-term high-intensity interval training. Front. Physiol. 9, 1443. 10.3389/fphys.2018.01443 - DOI - PMC - PubMed
LinkOut - more resources
Full Text Sources
Miscellaneous