. 2022 Dec;21(12):e13726.
doi: 10.1111/acel.13726. Epub 2022 Oct 10.

High-fat diet-induced obesity augments the deleterious effects of estrogen deficiency on bone: Evidence from ovariectomized mice

Affiliations

High-fat diet-induced obesity augments the deleterious effects of estrogen deficiency on bone: Evidence from ovariectomized mice

Dalia Ali et al. Aging Cell. 2022 Dec.

Abstract

Several epidemiological studies have suggested that obesity complicated with insulin resistance and type 2 diabetes exerts deleterious effects on the skeleton. While obesity coexists with estrogen deficiency in postmenopausal women, their combined effects on the skeleton are poorly studied. Thus, we investigated the impact of high-fat diet (HFD) on bone and metabolism of ovariectomized (OVX) female mice (C57BL/6J). OVX or sham operated mice were fed either HFD (60%fat) or normal diet (10%fat) for 12 weeks. HFD-OVX group exhibited pronounced increase in body weight (~86% in HFD and ~122% in HFD-OVX, p < 0.0005) and impaired glucose tolerance. Bone microCT-scanning revealed a pronounced decrease in trabecular bone volume/total volume (BV/TV) (-15.6 ± 0.48% in HFD and -37.5 ± 0.235% in HFD-OVX, p < 0.005) and expansion of bone marrow adipose tissue (BMAT; +60.7 ± 9.9% in HFD vs. +79.5 ± 5.86% in HFD-OVX, p < 0.005). Mechanistically, HFD-OVX treatment led to upregulation of genes markers of senescence, bone resorption, adipogenesis, inflammation, downregulation of gene markers of bone formation and bone development. Similarly, HFD-OVX treatment resulted in significant changes in bone tissue levels of purine/pyrimidine and Glutamate metabolisms, known to play a regulatory role in bone metabolism. Obesity and estrogen deficiency exert combined deleterious effects on bone resulting in accelerated cellular senescence, expansion of BMAT and impaired bone formation leading to decreased bone mass. Our results suggest that obesity may increase bone fragility in postmenopausal women.

Keywords: Aging, bone fragility; accelerated aging; bone marrow adiposity; menopause; obesity; osteoporosis; senescence.


Conflict of interest statement

The authors declare that there is no conflict of interest.

Figures
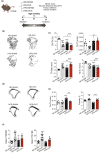
FIGURE 1
FIGURE 1
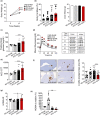
Effect of HFD‐induced obesity on bone parameters. (a) Study design. Bone parameters as evaluated by μCT, 8 weeks after the surgery, (b) Representative images for μCT 3D reconstruction of trabecular compartment (c) trabecular bone parameters were evaluated as bone volume per total volume (BV/TV), trabecular number (Tb.N), trabecular thickness (Tb.Th), and trabecular separation (Tb.Sep). (d) Representative images for μCT 3D reconstruction of cortical compartment. (e) Cortical diaphysis bone measurements as cortical thickness (Co.Th) and porosity %. (f) Markers for bone turnover, ratio P1NP/BS (bone surface‐ mm2; n = 10 per group) for bone formation (left panel) and ratio CTX‐1/BS (n = 9 per group) for bone resorption (right panel) were measured in serum. Data are presented as mean ± SEM (n = 7–10 mice/group). One‐way ANOVA, *p < 0.05, **p < 0.005; ***p < 0.0005
FIGURE 2
FIGURE 2
Effect of HFD on body composition and glucose metabolism. Evaluation of the body composition at the endpoint of the study (eight mice/group). (a) Body weight (b) Fat mass percentage and lean mass (absolute value). Glucose metabolism as evaluated by (c) Fasting blood glucose (mg/dl), (d) GTT and (e) area of the curve (AOC). (f) Representative photomicrographs of insulin staining of pancreas of ND‐SHAM, ND‐OVX, HFD‐SHAM &HFD‐OVX mice (left panel). Scale bar: 500 μm. Quantified β‐cell area expressed as percentage of total area (right panel). (g) HOMA‐IR as calculated [(fasting blood glucose (mg/dl) * fasting insulin (mIU/L))/405]. (H) Relative HOMA‐β = 20 × [FI (mIU/L)/(FBG [mmol/L] − 3.5) (%)]. Data are presented as mean ± SEM (n = 17 for (a) to (e) and n = 5 to 8 for (f) to (h)), *p < 0.05, **p < 0.005; ***p < 0.005; 1‐way ANOVA
FIGURE 3
FIGURE 3
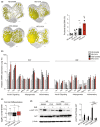
Effect of HFD on bone marrow and peripheral fat depot. (a) Left panel, representative images for μCT‐3D reconstruction of proximal tibia bone marrow adiposity from the side of the primary spongiosa, scale bar = 250 μm. Right panel, quantification of bone marrow adiposity in proximal tibia (%). (b) Quantification of mRNA expression levels of insulin signaling‐related genes (Irs1, Irs2, Insr), adipogenic genes (Adipoq, Cebpα, Pparγ2) and inflammatory genes (Tnfa, Il1β) in SAT (left panel) and VAT (right panel) (ND‐SHAM (n = 6), ND‐OVX (n = 8), HFD‐SHAM (n = 8) and HFD‐OVX (n = 8)). (c) Box plot showing the log fold change in expression levels of genes linked to fat cell differentiation in BMSCs from ND‐OVX, HFD‐SHAM and HFD‐OVX mice compared to control mice ND‐SHAM. Mann‐Whitney test with **p < 0.01. (d) Western blot of AKT, pS473‐AKT and β‐actin and densitometry evaluation of p‐S473‐AKT versus AKT in undifferentiated BMSCs with and without 15 min of insulin stimulation (100 nM). Data are presented as mean ± SEM from three independent experiments (***p < 0.0005)[Correction added on 25 October 2022, after first online publication: the figure caption related to part figure (c) was missing and it has been included in this version.]
FIGURE 4
FIGURE 4
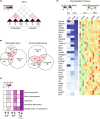
Effect of HFD‐induced obesity and estrogen deficiency on osteogenic molecular signature in BMSCs. (a) Heat map showing a Jaccard index based on the overlap of up‐and downregulated genes (p < 0.05) in BMSCs from ND‐OVX, HFD‐SHAM, and HFD‐OVX mice compared to control mice ND‐SHAM. (b) Venn diagram showing the overlap among genes that are up‐or downregulated (p < 0.05) in BMSCs from ND‐OVX, HFD‐SHAM, and HFD‐OVX mice compared to control mice ND‐SHAM. (c) Heat map showing the enrichment of gene ontology terms related to bone development, bone morphogenesis, ossification, osteoblast differentiation and skeletal system morphogenesis among the up and down‐regulated genes in BMSCs from ND‐OVX, HFD‐SHAM, and HFD‐OVX mice compared to control mice ND‐SHAM. (d) Heat map showing the log fold change of genes from the indicated gene ontology pathways
FIGURE 5
FIGURE 5
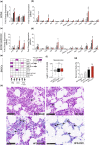
HFD‐induced obesity upregulated senescence in bone, bone marrow and BMSCs. Quantification of mRNA expression levels using qPCR (n = 10) of (a, c) senescence‐associated markers and (b, d) SASP markers in bone (a, b) and bone marrow (c, d) of ND‐SHAM, ND‐OVX, HFD‐SHAM, and HFD‐OVX mice at the end of the experiment. (e) Heat map showing enrichment analysis of genes, up and down regulated, in BMSCs of ND‐OVX, HFD‐SHAM, and HFD‐OVX mice that are under control of the indicated pathways (SPEED pathway analysis). (f) Box plot showing the log fold change in expression levels of genes linked to senescence in BMSCs from ND‐OVX, HFD‐SHAM, and HFD‐OVX mice compared to control mice ND‐SHAM. Mann–Whitney test with **p < 0.01. (g) Senescent cells percentage (cells not immunostained for LMNB1). (h) Immunostaining for Lamin B1 (LMNB1; a negative marker of cellular senescence) performed on tibial sections. Lack of staining is indicating senescent cells (black arrow). Scale bar: 50 μm. Data are presented as mean ± SEM, *p < 0.05, **p < 0.005; ***p < 0.0005. Two‐tailed unpaired Student's t‐test and 1‐way ANOVA.
FIGURE 6
FIGURE 6
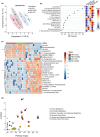
Full bone metabolic profiling. Composition in metabolites of full bones from ND‐SHAM, ND‐OVX, HFD‐SHAM, and HFD‐OVX groups. Global metabolomic analyses of metabolites from full femurs using liquid chromatography‐mass spectrometry (LC–MS). (a) PLS‐DA score plot of the ND‐SHAM, ND‐OVX, HFD‐SHAM, and HFD‐OVX groups in metabolomic analysis. (b) Variable importance in projection (VIP) from PLS‐DA analysis, colored boxes on the right indicate the relative concentrations of the corresponding metabolites in each group under study (black arrows are indicating those with gradual variation following the modelization pattern suggested by the PLS‐DA). (c) Heat map of the top 25 metabolites that are differentially expressed in the full bones of ND‐SHAM, ND‐OVX, HFD‐SHAM, and HFD‐OVX mice. (d) Metabolic pathway analysis. Matched pathways are displayed as circles and color and size of each circle are based on p value and pathway impact value, respectively. The pathways with the highest statistical significance scores are indicated as follows: (i) Purine metabolism, (ii) Pyrimidine metabolism, (iii) Alanine, Aspartate and Glutamate metabolism, (iv) Arginine biosynthesis, (v) Taurine and Hypotaurine metabolism, and (vi) TCA cycle

References

    1. Almeida, M. , Kim, H. N. , Han, L. , Zhou, D. , Thostenson, J. , Porter, R. M. , Ambrogini, E. , Manolagas, S. C. , & Jilka, R. L. (2020). Increased marrow adipogenesis does not contribute to age‐dependent appendicular bone loss in female mice. Aging Cell, 19, e13247. - PMC - PubMed
    1. Ambrosi, T. H. , Scialdone, A. , Graja, A. , Gohlke, S. , Jank, A. M. , Bocian, C. , Woelk, L. , Fan, H. , Logan, D. W. , Schurmann, A. , Saraiva, L. R. , & Schulz, T. J. (2017). Adipocyte accumulation in the bone marrow during obesity and aging impairs stem cell‐based hematopoietic and bone regeneration. Cell Stem Cell, 20, 771–784.e6. - PMC - PubMed
    1. Andreoli, A. , Bazzocchi, A. , Celi, M. , Lauro, D. , Sorge, R. , Tarantino, U. , & Guglielmi, G. (2011). Relationship between body composition, body mass index and bone mineral density in a large population of normal, osteopenic and osteoporotic women. La Radiologia Medica, 116, 1115–1123. - PubMed
    1. Anerillas, C. , Abdelmohsen, K. , & Gorospe, M. (2020). Regulation of senescence traits by MAPKs. Geroscience, 42, 397–408. - PMC - PubMed
    1. Baar, M. P. , Brandt, R. M. C. , Putavet, D. A. , Klein, J. D. D. , Derks, K. W. J. , Bourgeois, B. R. M. , Stryeck, S. , Rijksen, Y. , van Willigenburg, H. , Feijtel, D. A. , van der Pluijm, I. , Essers, J. , van Cappellen, W. A. , van IJcken, W. F. , Houtsmuller, A. B. , Pothof, J. , De Bruin, R. W. F. , Madl, T. , Hoeijmakers, J. H. J. , … De Keizer, P. L. J. (2017). Targeted apoptosis of senescent cells restores tissue homeostasis in response to chemotoxicity and aging. Cell, 169, 132–147.e16. - PMC - PubMed