

Autophagy regulates neuronal excitability by controlling cAMP/protein kinase A signaling at the synapse
- PMID: 36217825
- PMCID: PMC9670194
- DOI: 10.15252/embj.2022110963
Autophagy regulates neuronal excitability by controlling cAMP/protein kinase A signaling at the synapse
Abstract
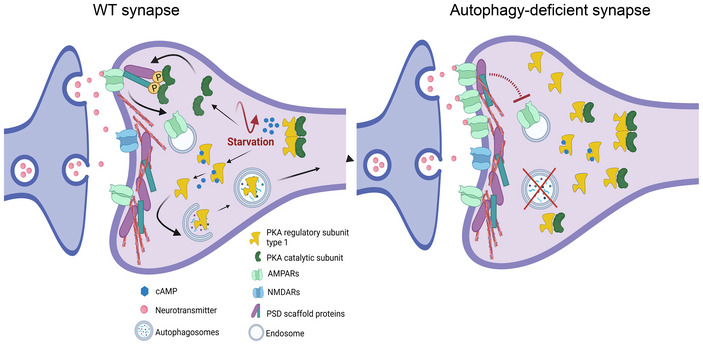
Autophagy provides nutrients during starvation and eliminates detrimental cellular components. However, accumulating evidence indicates that autophagy is not merely a housekeeping process. Here, by combining mouse models of neuron-specific ATG5 deficiency in either excitatory or inhibitory neurons with quantitative proteomics, high-content microscopy, and live-imaging approaches, we show that autophagy protein ATG5 functions in neurons to regulate cAMP-dependent protein kinase A (PKA)-mediated phosphorylation of a synapse-confined proteome. This function of ATG5 is independent of bulk turnover of synaptic proteins and requires the targeting of PKA inhibitory R1 subunits to autophagosomes. Neuronal loss of ATG5 causes synaptic accumulation of PKA-R1, which sequesters the PKA catalytic subunit and diminishes cAMP/PKA-dependent phosphorylation of postsynaptic cytoskeletal proteins that mediate AMPAR trafficking. Furthermore, ATG5 deletion in glutamatergic neurons augments AMPAR-dependent excitatory neurotransmission and causes the appearance of spontaneous recurrent seizures in mice. Our findings identify a novel role of autophagy in regulating PKA signaling at glutamatergic synapses and suggest the PKA as a target for restoration of synaptic function in neurodegenerative conditions with autophagy dysfunction.
Keywords: PKA; autophagy; brain; phosphorylation; synapse.
© 2022 The Authors. Published under the terms of the CC BY NC ND 4.0 license.
Figures

- A, B
Immunoblot analysis of ATG5‐ATG12 protein levels in cortical brain lysates of 13‐week‐old Atg5flox:CamKIIα‐Cre WT/KO mice (WT set to 100%, KO: 28.13 ± 8.18%; P = 0.0005, n WT = 3, n KO = 3, one‐tailed unpaired t‐test).
- C, D
Immunoblot analysis of ATG5‐ATG12 protein level in striatal brain lysates of 13‐week‐old Atg5flox:Slc32a1‐Cre WT/KO mice (WT set to 100%, KO: 21.71 ± 0.41%; P < 0.0001, n WT = 3, n KO = 3, one‐tailed unpaired t‐test).
- E, F
Protein levels of p62 are significantly increased in cortical lysates of Atg5flox:CamKIIα‐Cre KO mice compared to the WT set to 100% (KO: 4,855 ± 587.4%; P < 0.0001, n = 4, one‐tailed unpaired t‐test).
- G, H
Protein levels of p62 are significantly increased in striatal lysates of Atg5flox:Slc32a1‐Cre KO mice compared to the WT set to 100% (KO: 2956 ± 839.3%; P = 0.0072, n = 4, one‐tailed unpaired t‐test).
- I, J
Startle response analysis of Atg5flox:CamKIIα‐Cre WT/KO (I) (WT: 0.88 ± 0.125, KO: 1.56 ± 0.176; P = 0.0204, n WT = 8, n KO = 9) and Atg5flox:Slc32a1‐Cre WT/KO mice (J) (WT: 1.11 ± 0.111, KO: 2.00 ± 0.000; P < 0.0001, n WT = 9, n KO = 11, two‐tailed Mann–Whitney test).
- K, L
Behavioral seizure analysis in Atg5flox:CamKIIα‐Cre KO and heterozygous (HET) mice (K), as well as in Atg5flox:Slc32a1‐Cre KO/HET mice (L). Mice were observed twice a week during 4 months after birth (the number animals and the age of seizure onset are indicated in the graph). No seizures were detected in WT mice.
- M, N
Examples of electrocorticogram (ECoG) traces (top) and corresponding wavelet spectrograms (bottom, warm colors indicate high power) from Atg5flox:CamKIIα‐Cre KO mice during a spontaneous generalized tonic–clonic seizure (M), or during a focal seizure associated with repetitive grooming and head‐nodding (N). Representative example from n = 4 recordings for each genotype. All data represent mean ± SEM.
- A, B
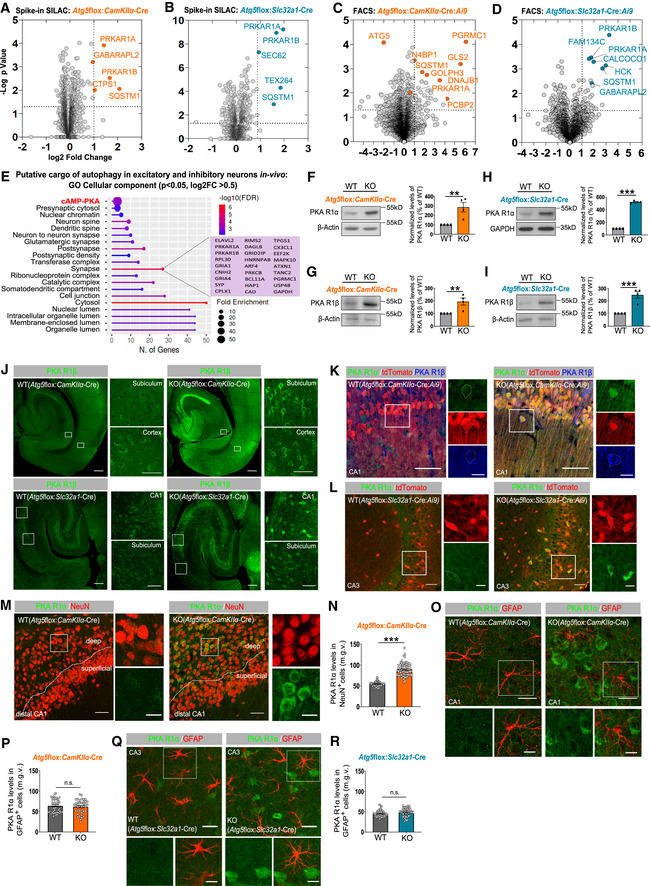
Volcano plot of differentially expressed proteins in Atg5flox:CamKIIα‐Cre KO cortical brain lysates (A) and Atg5flox:Slc32a1‐Cre KO striatal brain lysates (B), analyzed using a SILAC‐based proteomic approach (n Atg5flox:CamKIIα‐Cre = 3, n Atg5flox:Slc32a1‐Cre = 5 mice per genotype). Orange‐ and blue‐color‐coded circles indicate all protein deregulated at P < 0.05 and log2 fold change of > 1.
- C, D
Volcano plot of differentially expressed proteins in FACS‐sorted Atg5flox:CamKIIα‐Cre:Ai9 (C) and Atg5flox:Slc32a1‐Cre:Ai9 (D) KO neurons, analyzed using label‐free proteomic analysis (n Atg5flox:CamKIIα‐Cre:Ai9 = 4, n Atg5flox:Slc32a1‐Cre:Ai9 = 5 mice per genotype). Orange‐ and blue‐color‐coded circles highlight highly deregulated proteins at P < 0.05 and log2 fold change of > 1. See also Dataset EV1.
- E
ShinyGO v0.741‐based GO analysis of “cellular component” ‐enriched terms in the proteome (cut‐off P < 0.05, log2FC > 0.5) of FACS sorted Atg5flox:CamKIIα‐Cre:Ai9 KO and Atg5flox:Slc32a1‐Cre:Ai9 KO neurons.
- F, G
PKA R1α (F) and PKA R1β (G) protein levels are significantly increased in cortical brain lysates from 13‐week‐old Atg5flox:CamKIIα‐Cre KO mice compared to the WT set to 100% (KOPKA R1α: 286.1 ± 50.53%, P = 0.005, KOPKA R1β: 194.7 ± 27.82%, P = 0.007, one‐tailed unpaired t‐test). n = 4 for each genotype.
- H, I
PKA R1α (H) and PKA R1β (I) protein levels are significantly increased in striatal lysates of Atg5flox:Slc32a1‐Cre KO mice compared to the WT set to 100% (KOPKA R1α: 524.1 ± 8.35%, P < 0.0001, KOPKA R1β: 247.9 ± 26.26%, P = 0.0007, one‐tailed unpaired t‐test). n = 4 for each genotype.
- J
Immunohistochemistry for PKA R1β on horizontal brain sections from Atg5flox:CamKIIα‐Cre WT/KO and Atg5flox:Slc32a1‐Cre WT/KO mice. White rectangular boxes indicate areas magnified to the right. Scale bars: 200 μM in large panels, 50 μM in small panels.
- K, L
Immunohistochemistry for PKA R1β and PKA R1α on horizontal brain sections from Atg5flox:CamKIIα‐Cre:Ai9 (K) and Atg5flox:Slc32a1‐Cre:Ai9 WT/KO (L) mice. White rectangular boxes indicate areas magnified to the right. Scale bars: 50 μm, 25 μm (small panels in K), 20 μm (small panels in L). Drawn contours indicate representative WT or KO neuronal cell body.
- M, N
Immunohistochemistry analysis of PKA R1α levels in NeuN‐posititve neurons in the hippocampus of Atg5flox:CamKIIα‐Cre WT/KO mice. Scale bar: 50 μm, 20 μm (small panels). WT: 54.70 ± 0.693, KO: 89.79 ± 1.831; P < 0.0001, two‐tailed unpaired t‐test. n WT = 64; n KO = 71 neurons from n = 3 mice per genotype.
- O, P
Immunohistochemistry analysis of PKA R1α levels in GFAP‐positive cells in the hippocampus of Atg5flox:CamKIIα‐Cre WT/KO mice. Scale bar: 50 μm, 30 μm (small panels). WT: 63.86 ± 2.477, KO: 61.71 ± 2.653; P = 0.5549, two‐tailed unpaired t‐test. n WT = 45; n KO = 40 cells from n = 3 mice per genotype.
- Q, R
Immunohistochemistry analysis of PKA R1α in GFAP‐positive cells in the hippocampus of Atg5flox:Slc32a1‐Cre WT and KO mice. Scale bar: 50 μm, 30 μm (small panels). WT: 45.28 ± 1.018, KO: 48.50 ± 1.440; P = 0.0636, two‐tailed unpaired t‐test. n WT = 61; n KO = 48 cells from n = 3 mice per genotype.

- A
AMIRA‐based 3D‐visualization of PKA R1α distribution in Atg5flox:CamKIIα‐Cre WT/KO cell soma and neuropil in the cortex. Scale bar 20 μm. Drawn contours indicate somata of WT or KO neurons.
- B–D
Immunohistochemical analysis and surface rendering of Amira 3D reconstructions of PKA R1α and bassoon colocalization in Atg5flox:CamKIIα‐Cre WT (B, C) and KO (D) cortical neuropil. In 3D analysis, the PKA R1α neuropil staining is represented by 3D reconstruction of its surface in red and PKA R1α/bassoon contacts are color coded, with the cold to warm colors spreading from 0‐ to 250‐nm distance between the surface of either bassoon‐positive synapses and/or PKA R1α‐positive neuropil (see color‐coded horizontal bar for the distance definition). Scale bar 5 μm in dual‐channel, 1 μm in 3D‐reconstruction zoom.
- E
Mander's overlap coefficient of PKA R1α and bassoon colocalization in Atg5flox:CamKIIα‐Cre WT/KO cortex (WT: 0.32 ± 0.023, KO: 0.43 ± 0.018; P = 0.0002, two‐tailed unpaired t‐test). n WT = 33; n KO = 39 from n = 3 mice.
- F
Mander's overlap coefficient of PKA R1β and bassoon colocalization in Atg5flox:CamKIIα‐Cre WT/KO cortex (WT: 0.20 ± 0.014, KO: 0.34 ± 0.021; P < 0.0001, two‐tailed unpaired t‐test). n WT = 27; n KO = 27 from n = 3 mice (see also Appendix Fig S5A).
- G
Immunohistochemistry for PKA R1α and postsynaptic density marker PSD95 on horizontal brains sections from Atg5flox:CamKIIα‐Cre WT/KO mice. White rectangular boxes indicate areas magnified below with arrows indicating PKA R1α and PSD95 colocalization. Scale bar: 20 μm, 5 μm (insert).
- H
Mander's overlap coefficient of PKA R1α and PSD95 colocalization in Atg5flox:CamKIIα‐Cre WT/KO hippocampus (WT: 0.29 ± 0.009, KO: 0.40 ± 0.012; P < 0.0001, two‐tailed unpaired t‐test). n WT = 31; n KO = 38 from n = 3 mice.
- I
Electron microscopy‐based analysis of immunogold‐labeled PKA R1α/β on Tokuyasu cryosections of the CA1 neuropil area of the hippocampus of Atg5flox:CamKIIα‐Cre KO mice. No immunogold labelling was detected in samples where the PKA R1α/β antibody were omitted (negative control). Scale bar: upper row 50 nm, 500 nm lower picture. (J) PKA R1α/β is enriched at mitochondria (WT: 1.10 ± 0.266, KO: 2.73 ± 0.515; P = 0.0082, two‐tailed unpaired t‐test) and synapses (WT: 0.52 ± 0.131, KO: 1.14 ± 0.221; P = 0.0234, two‐tailed unpaired t‐test) of KO mice. Values display the mean number of gold particles counted per structure in n WT = 21 and n KO = 22 pictures per genotype.

- A
Western Blot analysis of PKA R1α protein levels in NSC34 cells, treated with 250 nM Torin1 or deprived of amino‐acids and serum for 16 h. Lysosomal degradation was blocked in the last 4 h using 67 nM of Bafilomycin A (BafA).
- B
Starvation significantly reduced PKA R1α protein levels in NSC34 cells (vehicle set to 100%, starvation: 31.19 ± 5.085%, P < 0.0001, one‐tailed unpaired t‐test). n = 5.
- C
Application of 67 nM BafA for 4 h before harvesting was sufficient to stabilize the PKA R1α protein levels in starved NSC34 cells (starvation set to 100%, starvation + BafA: 155.5 ± 13.93%, P = 0.002, one‐tailed unpaired t‐test). n = 5.
- D, E
16 h starvation significantly increased intracellular cAMP level measured as mean intensity in MAP2‐positive cultured primary neurons (Vehicle: 212.4 ± 5.619, Starvation: 255.1 ± 5.715; P < 0.0001, two‐tailed paired t‐test). n Vehicle = 314, n Starvation = 306 neurons from n = 3.
- F, G
Phosphorylation state of proteins containing PKA substrate RRXS/T motif was increased upon 16 h of amino‐acid and serum starvation in primary cortico‐hippocampal neurons at DIV14 and was suppressed by 1 μM H89 supplementation in the media (Vehicle set to 100%, Starvation: 326.60 ± 94.53%, H89: 214.80 ± 56.87%, P = 0.033, one‐way ANOVA with Dunn's multiple comparison test). n = 4. The pPKA substrate levels were normalized to the total protein amount stained with Ponceau S.
- H, I
Treatment of NSC34 cells with BafA (67 nM) for 6 h significantly increased PKA R1α protein levels compared to the DMSO‐treated group set to 100% (BafA: 198.9 ± 28.44%, P = 0.003, one‐tailed unpaired t‐test). n = 6.
- J
Western blot analysis of purified autophagosomes (AVs) (50 μg AVs/lane) with and without Proteinase K (PK) treatment. TX‐100 (1% final) was used as a positive control for the activity of PK. Synaptosome lysates (Syn, 30 μg/lane) were used as a positive control for the signal of antibodies.
- K, L
Representative confocal images of the hippocampus CA1 area from Atg5flox:CamKIIα‐Cre (K) and Atg5flox:Slc32a1‐Cre (L) KO mice, immunostained for PKA R1‐α/β and co‐immunostained for p62 and/or NBR1. White rectangular boxes indicate areas magnified to the right. White arrows indicate p62/NBR1 inclusion bodies positive for PKA R1. Scale bar: large panel 15 μm, small panel: 5 μm. Representative pictures for WT controls are shown in Appendix Fig S6D–F.
- M, N
Representative fluorescent images and subsequent analysis of PKA R1‐ α/p62 colocalization (Pearson's correlation coefficient) in primary cortico‐hippocampal neurons, which have undergone 16 h amino‐acids and serum starvation and were additionally treated with BafA (67 nM) to visualize the lysosomes (control: 0.68 ± 0.019, starvation: 0.58 ± 0.015, starvation + BafA: 0.83 ± 0.014; P control vs starvation < 0.0001, P control vs starvation+BafA < 0.0001, P starvation vs starvation+BafA < 0.0001 Ordinary one‐way ANOVA with Tukey's multiple comparison test). n control = 36, n starvation = 38, n starvation+BafA = 36 neurons from n = 3. Scale bar: 5 μm.
- O, P
3D‐reconstruction of Atg5flox:CamKIIα‐Cre KO soma (O), as well as the immunohistochemical profile and the 3D surface rendering of Atg5flox:CamKIIα‐Cre KO neuropil (P) revealing the PKA R1‐β/p62 colocalization in the soma (white arrows), but not in processes (yellow arrows). Scale bar: 10 μM.
- Q, R
Co‐immunoprecipitation of endogenous PKA R1‐β with PKA‐Cα from Atg5flox:CamKIIα‐Cre WT/KO mouse brain lysates (WT set to 100%, KO: 170.3 ± 14.88%, P = 0.005, one‐tailed unpaired t‐test, n = 3). Input, 1.5% of the total lysate was added to the assay.

- A, B
Western Blot analysis of pCREB protein levels in Atg5flox:CAG‐CreTmx WT/ KO cultured neurons at DIV14, treated with forskolin (WTDMSO set to 100%, WTForskolin: 214.17 ± 48.87%, KODMSO: 63.26 ± 15.85%, KOForskolin: 33.50 ± 10.84%, P WT DMSO/WT Forskolin = 0.042, P WT Forskolin/KO Forskolin = 0.002, two‐way ANOVA with Tukey's multiple comparisons). n = 4. The same lysates were run in parallel to detect pCREB and CREB and normalized to their respective loading control before calculating the pCREB/CREB ratio.
- C, D
High‐content screening microscopy analysis of pCREB fluorescence intensity in neurons isolated from 8 to 12‐week‐old Atg5flox:CamKIIα‐Cre:Ai9 WT/KO mice, treated either with DMSO or with 2 μM, 10 μM Forskolin or 40 mM KCl (WTDMSO set to 1, KODMSO: 0.76 ± 0.07, WTForskolin 2 μM: 1.31 ± 0.34, KOForskolin 2 μM: 0.68 ± 0.04, WTForskolin 10 μM: 1.78 ± 0.31, KOForskolin 10 μM: 0.87 ± 0.15, WTKCl 40 mM: 1.64 ± 0.23, KOKCl 40 mM: 0.66 ± 0.13, P WT Forskolin 10 μM/KO Forskolin 10 μM = 0.047, P WT KCl 40 mM/KO KCl 40 mM = 0.034, two‐way ANOVA with Tukey's multiple comparisons test). n = 3.
- E
Next‐generation RNA sequencing‐based Kallisto transcriptome output of FACS‐sorted neurons isolated from 3‐week‐old Atg5flox:Slc32a1‐Cre:Ai9 WT/KO mice (cut‐off P < 0.02, FC < −2/> 2; n WT = 4, n KO = 5). See also Dataset EV2 and Appendix Fig S7D for differential gene expression analysis.
- F, G
EnrichR‐based analysis of transcription factor‐binding site enrichment using ChEA2016 databank. Analysis was applied to differentially downregulated (F) and upregulated (G) gene sets (cut off P < 0.01, log2FC < −1/> 1), obtained using Sleuth‐based algorithm for gene expression analysis of RNA transcriptome shown in (E).
- H
Top downregulated CREB1 target genes in autophagy‐deficient FACS‐sorted Atg5flox:Slc32a1‐Cre:Ai9 KO neurons.
- I, J
Representative fluorescent images and subsequent analysis of primary cortico‐hippocampal neurons containing nuclear pCREB either under DMSO‐treated condition or under condition when amino acids and serum starvation was induced for 16 h in the absence or presence of 1 μM of PKA inhibitor H89. Neurons were identified by their polarized morphology in DIC. White rectangular boxes indicate panel magnified to the right. In the inserts, LUT gradient was added to highlight the pCREB intensity in the nucleus. Scale bar: 50 μm. DMSO: 52.50 ± 2.757, starvation: 70.00 ± 2.697, starvation + H89: 53.92 ± 3.147; P DMSO/starvation < 0.0001, P starvation/starvation&H89 = 0.0004, one‐way ANOVA with Tukey's multiple comparisons test, n = 30 images from n = 3 independent experiments.

- A, B
Western Blot analysis of PKA substrates carrying RRXS/T motif in primary cortico‐hippocampal Atg5flox:CAG‐CreTmx WT/KO neurons at DIV14, treated with Forskolin (WTDMSO set to 100%, WTForskolin: 291.85 ± 17.02%, KODMSO: 152.97 ± 25.26%, KOForskolin: 182.56 ± 31.89%, P WTDMSO/WTForskolin: 0.001, P WTForskolin/KOForskolin: 0.033, two‐way ANOVA with Tukey's multiple comparisons). n = 3.
- C
The top downregulated phosphopeptides (cut‐off P < 0.05, Fold change < −1.5) in either cortical lysates of Atg5flox:CamKIIα‐Cre KO (n = 3) or striatal lysates of Atg5flox:Slc32a1‐Cre KO mice (n = 5), identified by global phosphoproteome analysis. The levels of phosphopeptides were normalized to their total protein levels. See also Dataset EV3.
- D
WebGestalt‐ based GO analysis of “cellular component”‐enriched terms among significantly downregulated phosphopeptides (cut‐off P < 0.05, Fold change < −1.2) in Atg5flox:CamKIIα‐Cre KO (left) and Atg5flox:Slc32a1‐Cre KO (right) brains.
- E
Volcano plot of phosphopeptides identified using label‐free phosphoproteome analysis of acute cortico‐hippocampal slices from Atg5flox:CamKIIα‐Cre WT mice treated either with DMSO or 50 μM Forskolin for 15 min (n = 5). Phosphopeptides significantly upregulated (P < 0.05) upon Forskolin treatment are highlighted in dark gray.
- F
Heat map representation of LFQ intensities of common phosphopeptides, identified in (E) and containing putative PKA phosphorylation motif (predicted by Perseus software) in Atg5flox:CamKIIα‐Cre WT and KO acute slices, treated either with DMSO or 50 μM Forskolin for 15 min (n = 5).
- G
Venn diagram showing the number of phosphopeptides significantly downregulated in Atg5flox:CamKIIα‐Cre KO and Atg5flox:Slc32a1‐Cre KO brains (cut‐off P < 0.05, Fold‐change < −1.2) and the phosphophopeptides, which were “irresponsive” to Forskolin treatment in Atg5flox:CamKIIα‐Cre KO acute slices (P > 0.05).
- H
Top three enriched “cellular component” terms obtained by GO analysis of common phosphopeptides identified in (G).
- I
Fluorescence lifetime images of AKARet‐PSD at spines of ATG5 WT and KO cortico‐hippocampal neurons before and 4 min after Forskolin and IBMX administration. Scale bar: 1 μm. Drawn contours represent single spines of WT or KO neurons.
- J
Averaged timecourses of fluorescence lifetime change of AKARet‐PSD in WT and ATG5 KO spines (WT6 min: −0.053 ± 0.018, KO6 min: 0.009 ± 0.015; P = 0.026, two‐tailed unpaired t‐test. n WT: 50/5, n KO: 58/6 (spines/neurons) from n = 3 independent experiments).
- K–M
Representative STED images and Pearson's colocalization coefficient analysis of SHANK3 (K) and CASKIN1 (L) and PSD95 in Atg5flox:CamKIIα‐Cre:Ai9 WT/KO neurons. Scale bar: 5 μm, 1 μm (small panels). WTSHANK3: 0.324 ± 0.022, KOSHANK3: 0.415 ± 0.024; P = 0.0067, two‐tailed unpaired t‐test. n WT = 46, n KO = 46. WTCASKIN1: 0.255 ± 0.024, KOCASKIN1: 0.326 ± 0.025; P = 0.0432, two‐tailed unpaired t‐test. n WT = 39, n KO = 43 from n = 2 independent experiments.

- A
g:Profiler‐based analysis of GO molecular function and human phenotype enriched terms of “irresponsive” PKA target proteins in autophagy‐deficient neurons identified in Fig 6G (cut‐off P < 0.05, FC < −1.2). See also Dataset EV4.
- B
Representation of proteins from GO molecular function term “cytoskeletal protein binding” shown in (A). Highlighted in blue are proteins with a published function in GLUR1 function and trafficking.
- C, D
Analysis of GLUR1 fluorescent levels at the spines of 10–11 week‐old Atg5wt/wt:Ai9 and Atg5flox/flox:Ai9 mice injected with CamKIIα‐Cre AAV into the hippocampus. Scale bar: 5 μm. GLUR1 level at PSD95‐positve spines were assessed measuring mean gray values after background subtraction (WT: 64.55 ± 7.988%, KO: 99.14 ± 6.863%; P = 0.0029, two‐tailed unpaired t‐test). n WT = 13, n KO = 14 images from n = 3 mice (> 31 dendritic spines analyzed per each mouse). sp, spine.
- E
AMIRA‐based color coded 3D‐reconstrution of GLUR1 localization in dendrites of excitatory neurons of Atg5wt/wt:Ai9 and Atg5flox/flox:Ai9 mice injected with CamKIIα‐Cre AAV into the hippocampus. sp, spine. Scale bar: 5 μm.
- F
Analysis of GLUR1 concentration in the dendritic spines versus shaft. The mean gray value of GLUR1 at spines and shafts was measured separately and the spine value was divided by the shaft (WT: 0.778 ± 0.030, KO: 1.012 ± 0.046; P = 0.0003, n WT: 13, n KO: 12 images from n = 3 mice [> 31 dendritic spines/shaft analyzed per mouse]).
- G
Representative fluorescence images of Atg5flox:CAG‐CreTmx WT/KO neurons transfected with eGFP or eGFP‐ATG5 and immunostained for GLUR1, PSD95 and GFP. Scale bar: 5 μm.
- H
The overexpression of eGFP‐ATG5 in Atg5flox:CAG‐CreTmx KO neurons diminished the of GLUR1/PSD95 colocalization compared to the eGFP‐overexpressing KO neurons (KOeGFP: 70.07 ± 1.473%, KOeGFP‐ATG5: 65.42 ± 1.721%; P = 0.048, two‐tailed unpaired t‐test). n KO + GFP = 42, n KO + GFP‐ATG5 = 50 images from n = 5.
- I, J
The coexpression of eGFP‐PKA R1α and eGFP‐PKA R1β in cultured Atg5flox:CAG‐CreTmx WT neurons results in significantly increased colocalization between GLUR1 and PSD95 compared to the eGFP‐expressing neurons (WT: 42.30 ± 2.453%, KO: 51.32 ± 2.624%, P = 0.014, two‐tailed unpaired t‐test). n WT + GFP = 46, n WTGFP + PKA R1 OE = 46 images from n = 3. Analysis in (H, J) is performed using a unbiased custom‐written Plugin for ImageJ.
- K–M
GCAMP7f responses to tetanic stimulation (four tetani, 100 APs at 100 Hz, 3 s interval) in cell bodies of CamKIIα‐Cre‐transduced primary cortico‐hippocampal Atg5wt:wt/Ai9 (WT) and Atg5flox:flox/Ai9 (KO) neurons expressing mCamKIIα‐jGCaMP7f and treated either with DMSO (K) or with 10 μM CNQX for 5 min (L). Autophagy deficient cells showed significantly increased facilitation of GCAMP7f signal to electrical stimulation (ΔF/Fpeak1) compared to the WT, a phenotype which was blocked by the application of CNQX (WTDMSO: 0.28 ± 0.12, WTCNQX: −0.07 ± 0.03, KODMSO: 3.74 ± 0.86, KOCNQX: −0.014 ± 0.13, P WT DMSO/ KO DMSO < 0.0001, P KO DMSO/KO CNQX < 0.0001, two‐way ANOVA with Tukey's multiple comparisons test). n WT DMSO = 25, n WT CNQX = 27, n KO DMSO = 33, n KO CNQX = 30 neurons from n = 3. See also Appendix Fig S9L for changes in calcium signals in dendrites.
- N, O
GCAMP7f responses to tetanic stimulation (four tetani, 100 APs at 100 Hz, 3 s interval) in primary cortico‐hippocampal neurons expressing mCamKIIα‐jGCaMP7f and treated either with DMSO or with 10 μM of H89 for 20 min (DMSO: 0.069 ± 0.042, H89: 1.668 ± 0.28, P < 0.0001, unpaired two‐tailed t‐test). n DMSO = 48, n H89 = 47 neurons from n = 3 independent experiments.
- P
Example traces of the network activity of primary cortico‐hippocampal CamKIIα‐eGFP AAV (WT)/ CamKIIα‐Cre‐eGFP AAV (KO)‐transduced Atg5flox:flox neurons analyzed using the MEA system.
- Q, R
Increased spike rate in ATG5 KO excitatory neurons is rescued by long‐term application of Forskolin (10 μM for 72 h; WTDMSO: 0.59 ± 0.29, WTForskolin: 1.35 ± 0.88, KODMSO: 1.27 ± 0.62, KOForskolin: 0.02 ± 0.001, P KO DMSO/KO Forskolin = 0.027, unpaired two‐tailed t‐test). n WT DMSO = 9, n WT Forskolin = 8, n KO DMSO: 7, n KO Forskolin = 10 MEA chambers from three mice.
- S, T
AMPAR‐mediated sEPSCs in cortical pyramidal neurons of 12‐week‐old mice Atg5flox:flox mice, which were stereotactically injected either with CamKIIα‐eGFP AAV (WT) or with CamKIIα‐Cre‐eGFP AAV (KO) into the perirhinal cortex layer II/III. (S) Amplitude of AMPAR sEPSC is increased in pyramidal KO neurons compared to the WT (WT: 7.75 ± 0.72 pA, KO: 9.79 ± 2.75 pA; n WT = 11, n KO = 9; unpaired mean difference between WT and KO (ΔWT‐KO): 2.04 [95%CI: 0.629, 4.22]; P WT/KO = 0.0152 [two‐sided permutation t‐test]). Inset: representative traces of a WT sEPSC (petrol) and a KO sEPSC (ochre). (T) Frequency of AMPAR sEPSC is increased in pyramidal KO neurons compared to the WT (WT: 5.27 ± 2.66 Hz, KO: 9.47 ± 5.16 Hz; n WT = 11, n KO = 9; ΔWT‐KO: 4.19 [95%CI: 0.57, 7.56]; P WT/KO = 0.0326 [two‐sided permutation t‐test]). Each data point represents the mean of a 1 min recording interval of an individual neuron. The filled curve indicates the resampled Δ distribution (5,000 bootstrap samples), given the observed data. Horizontally aligned with the mean of the test group, the Δ is indicated by the black circle. The 95% confidence interval of the mean difference is illustrated by the black vertical line.
References
Publication types
MeSH terms
Substances
LinkOut - more resources
Full Text Sources
Molecular Biology Databases
Research Materials
