. 2023 Jan;597(2):246-261.
doi: 10.1002/1873-3468.14511. Epub 2022 Oct 27.

Rapid fractionation of mitochondria from mouse liver and heart reveals in vivo metabolite compartmentation

Affiliations

Rapid fractionation of mitochondria from mouse liver and heart reveals in vivo metabolite compartmentation

Fay M Allen et al. FEBS Lett. 2023 Jan.

Abstract

The compartmentation and distribution of metabolites between mitochondria and the rest of the cell is a key parameter of cell signalling and pathology. Here, we have developed a rapid fractionation procedure that enables us to take mouse heart and liver from in vivo and within ~ 30 s stabilise the distribution of metabolites between mitochondria and the cytosol by rapid cooling, homogenisation and dilution. This is followed by centrifugation of mitochondria through an oil layer to separate mitochondrial and cytosolic fractions for subsequent metabolic analysis. Using this procedure revealed the in vivo compartmentation of mitochondrial metabolites and will enable the assessment of the distribution of metabolites between the cytosol and mitochondria during a range of situations in vivo.

Keywords: in vivo; compartmentation; ischemia; metabolites; mitochondria; rapid fractionation.


Figures

Fig. 1
Fig. 1
Rapid tissue fractionation procedures for mouse liver and heart. (A) The liver is removed and homogenised in 5 mL of Liver homogenisation Buffer (200 mm sucrose, 5 mm Tris–HCl, 1 mm EGTA, pH 7.4, supplemented with 100 μg·mL−1 digitonin). 1 mL portions are centrifuged (1000  g for 1 min), and 200 μL supernatant is mixed with 500 μL Spin Buffer (150 mm sucrose, 5 mm Tris–HCl, 1 mm EGTA, 25 mm ammonium bicarbonate pH 7.4). Seven hundred microliter of this mixture is layered onto 300 μL of oil (60 : 40 (v/v) poly(dimethylsiloxane‐co‐methyl‐phenyl siloxane) oil (DSMPS)/dioctyl phthalate (DOP)) and centrifuged for 1 min at 9727  g . For LC–MS analysis, the lower layer was 23% formic acid (FA), and for protein analysis, it was 23% glycerol. (B) The heart is removed and homogenised in 3 mL of Heart homogenisation Buffer (25 mm sucrose, 87.5 mm ammonium bicarbonate, 5 mm Tris–HCl, 1 mm EGTA, pH 7.4 supplemented with 100 μg·mL−1 digitonin. One milliliter portions were centrifuged at 1000  g for 1 min and 650 μL of this supernatant was layered directly onto 300 μL of oil (38 : 62 (v/v) DSMPS : DOP) and centrifuged for 1 min at 9727  g . For LC–MS analysis, the lower layer was 15% FA, and for protein analysis, it was 15% glycerol. The timeline starts at the point of cervical dislocation with it taking 20–35 s to achieve organ removal and homogenisation in ice‐cold buffer.
Fig. 2
Fig. 2
Optimisation of tissue fractionation. (A) Typical experiment to optimise the digitonin concentration in rat heart. A rat heart was homogenised using the indicated concentrations of digitonin and the cytosolic and mitochondrial fractions separated as shown in Fig. 1B. The fractions were analysed by immunoblotting using Protein Plus Dual Color standard and the following primary antibodies: anti‐GAPDH, rabbit, 1 in 10 000; anti‐PDH mouse, 1 in 2000; anti‐NDUFB8 mouse, 1 in 2000. This is compared with rat heart mitochondria isolated by conventional differential centrifugation (RHM). (B) Illustration of a typical separation of mouse heart mitochondria from cytosol by centrifugation as described in Fig. 1B. For this experiment, tetramethylrhodamine (3 μm) was added to the homogenate to facilitate visualisation of the mitochondrial pellet. (C) The optimised densities at room temperature for the phases used in fractionating mouse liver and heart by centrifugation through oil. (D) Optimised compositions for the buffers and phases used in homogenising and fractionating mouse liver and heart.
Fig. 3
Fig. 3
Analysis of mitochondrial enrichment following tissue fractionation. (A, B) During the fractionation of mouse liver or heart tissues by the procedures shown in Fig. 1, samples were taken at all stages and the volume, protein concentration and CS specific activities were determined for the liver (A) and heart (B). Data are means ± SEM, n = 4 (liver) or n = 3 (heart). (C) Mouse liver mitochondria were isolated by conventional homogenisation followed by differential centrifugation, or by rapid fractionation. For rapid fractionation, the procedure was as described in Fig. 1A, except that the lower layer below the oil was replaced with 100 μL 300 mm sucrose, 220 mm mannitol, 10 mm KH2PO4, 5 mm MgCl2, 2 mm HEPES, 1 mm EGTA, 0.2% (w/v) fatty acid‐free BSA, pH 7.2. The mitochondrial pellet from rapid fractionation was resuspended in the same buffer. The mitochondria from both isolation procedures were then analysed using a Seahorse respirometer in the presence of succinate (5 mm) with additions of FCCP (4 μm) and antimycin (3 μm) where indicated. Data are typical traces showing means ± SEM of four technical replicates. (D) Mouse heart and liver mitochondria were isolated via the rapid procedure described in Fig. 1. After resuspension of the mitochondrial pellets in glycerol, the amounts of total GSH equivalents were determined by the GSH recycling assay and the protein concentration was determined in parallel. Data are means ± SEM, n = 3.
Fig. 4
Fig. 4
Effect of mitochondrial transport inhibitors on mitochondrial metabolite distribution. Mouse heart (A) and liver (B) tissues were rapidly processed as described in Fig. 1, ±500 μm butylmalonate and the taurine‐normalised levels of succinate and malate determined in the tissue homogenate, initial supernatant, cytosol and mitochondrial fractions. Data are mean ± range for control samples (n = 2) and mean ± SEM for butylmalonate samples (n = 3). (C) Mouse livers were rapidly processed as described in Fig. 1, in the presence or absence of 500 μm N‐ethylmaleimide (NEM) or 200 μm pyridoxal‐5‐phosphate (P5P) and the taurine‐normalised levels of succinate, malate and fumarate determined in the tissue homogenate, initial supernatant, cytosol and mitochondrial fractions. Data are means ± SEM, n = 3. Data were analysed by 2‐way ANOVA and no significant differences were found.
Fig. 5
Fig. 5
Metabolite distribution between heart mitochondria and cytosol. Metabolites from the control heart data set were normalised to taurine (Tables S5 and S6). For A and B, data are presented as Log2 of the ratio of mitochondrial : cytosolic levels normalised to taurine ion intensity, arranged in order of accumulation in the mitochondria. Data are average of six biological replicates. Metabolites which were assigned an adjusted zero value, due to no detection in the cytosolic or mitochondrial fraction, are placed above (cytosolic adjusted zero) or below (mitochondrial adjusted zero) the gaps in the heat map. (A) Metabolites analysed on the ZIC‐pHILIC column. (B) Metabolites analysed on the ZIC‐HILIC. (C) The distribution of glycolytic intermediates normalised to taurine in control mouse heart homogenates, supernatant, cytosol and mitochondria. Data are from a ZIC‐pHILIC column and are mean ± SEM of six biological replicates. (D, E) The distribution of TCA cycle intermediates normalised to taurine in control mouse heart homogenate, supernatant, cytosol and mitochondria. Data are from a ZIC‐pHILIC column, except for succinate which is from a ZIC‐HILIC column. Data are mean ± SEM of six biological replicates. NF, not found.
Fig. 6
Fig. 6
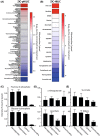
Metabolite distribution between liver mitochondria and cytosol. Metabolites from the control liver data set were normalised to taurine (Tables S7 and S8). For A and B, data are presented as Log2 of the ratio of mitochondrial:cytosolic levels normalised to taurine ion intensity, arranged in order of accumulation in the mitochondria. Data are average of six biological replicates. Metabolites that were assigned an adjusted zero value, due to no detection in the cytosolic or mitochondrial fraction, are placed above (cytosolic adjusted zero) or below (mitochondrial adjusted zero) the gaps in the heat map. (A) Metabolites analysed on the ZIC‐pHILIC column. (B) Metabolites analysed on the ZIC‐HILIC. (C) The distribution of the glycolytic intermediates normalised to taurine, in control mouse liver homogenate, supernatant, cytosol and mitochondria. Data are from ZIC‐pHILIC column and is mean ± SEM of six biological replicates. (D, E) the distribution of the TCA cycle intermediates normalised to taurine in control mouse liver homogenate, supernatant, cytosol and mitochondria. Data are from a ZIC‐pHILIC column, except for succinate which is from a ZIC‐HILIC column. Data are mean ± SEM of six biological replicates. NF, not found.
Fig. 7
Fig. 7
Metabolite enrichment in mouse heart mitochondria after 30 min warm ischaemia compared to that during normoxia. Metabolites from the control and ischaemic heart data sets are presented as Log2 of the ratio of mitochondrial : cytosolic levels normalised to taurine ion intensity, arranged in order of accumulation in the mitochondria. (A) Metabolites analysed on the ZIC‐pHILIC column. (B) Metabolites analysed on the ZIC‐HILIC column. *Metabolites that were not detected in the cytosolic (red) or mitochondrial (blue) fractions and were assigned an adjusted zero value. Crosses: blank values in both fractions. Data are average of six biological replicates.
Fig. 8
Fig. 8
Metabolite enrichment in mouse liver mitochondria after 30 min warm ischaemia compared to that during normoxia. Metabolites from the control and ischaemic liver data sets are presented as Log2 of the ratio of mitochondrial:cytosolic levels normalised to taurine ion intensity, arranged in order of accumulation in the mitochondria. (A) Metabolites analysed on the ZIC‐pHILIC column. (B) Metabolites analysed on the ZIC‐HILIC column. *Metabolites that were not detected in the cytosolic (red) or mitochondrial (blue) fractions and were assigned an adjusted zero value. Crosses: blank values in both fractions. Data are average of three biological replicates.

Similar articles

Cited by

References

    1. Ryan DG, Murphy MP, Frezza C, Prag HA, Chouchani ET, O'Neill LA, et al. Coupling Krebs cycle metabolites to signalling in immunity and cancer. Nat Metab. 2019;1:16–33. - PMC - PubMed
    1. Murphy MP, O'Neill LAJ. How should we talk about metabolism? Nat Immunol. 2020;21:713–5. - PubMed
    1. Murphy MP, O'Neill LAJ. Krebs cycle reimagined: the emerging roles of succinate and itaconate as signal transducers. Cell. 2018;174:780–4. - PubMed
    1. Williams NC, O'Neill LAJ. A role for the Krebs cycle intermediate citrate in metabolic reprogramming in innate immunity and inflammation. Front Immunol. 2018;9:141. - PMC - PubMed
    1. Murphy MP, Chouchani ET. Why succinate? Physiological regulation by a mitochondrial coenzyme Q sentinel. Nat Chem Biol. 2022;18:461–9. - PMC - PubMed