

Plasma proteomics identify potential severity biomarkers from COVID-19 associated network
- PMID: 36217943
- PMCID: PMC9874836
- DOI: 10.1002/prca.202200070
Plasma proteomics identify potential severity biomarkers from COVID-19 associated network
Abstract
Purpose: Coronavirus disease 2019 (COVID-19) continues to threaten public health globally. Severe acute respiratory coronavirus type 2 (SARS-CoV-2) infection-dependent alterations in the host cell signaling network may unveil potential target proteins and pathways for therapeutic strategies. In this study, we aim to define early severity biomarkers and monitor altered pathways in the course of SARS-CoV-2 infection.
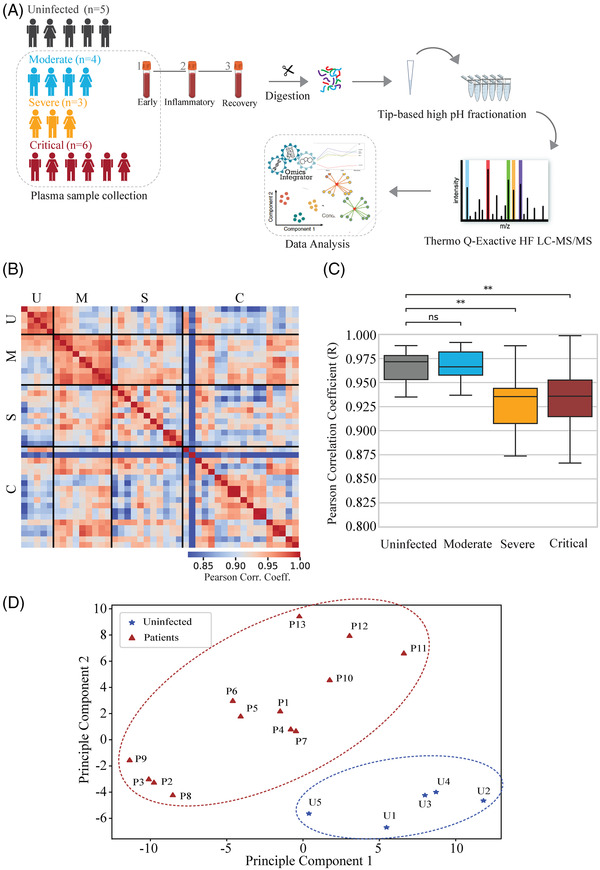
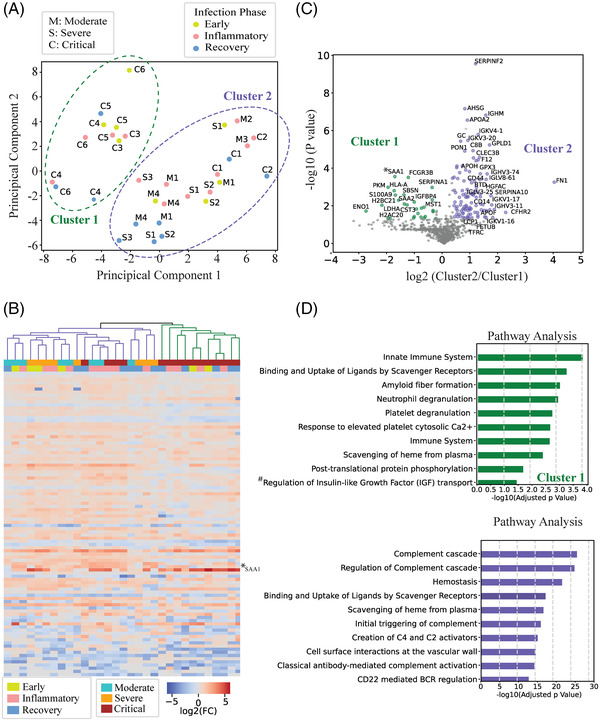
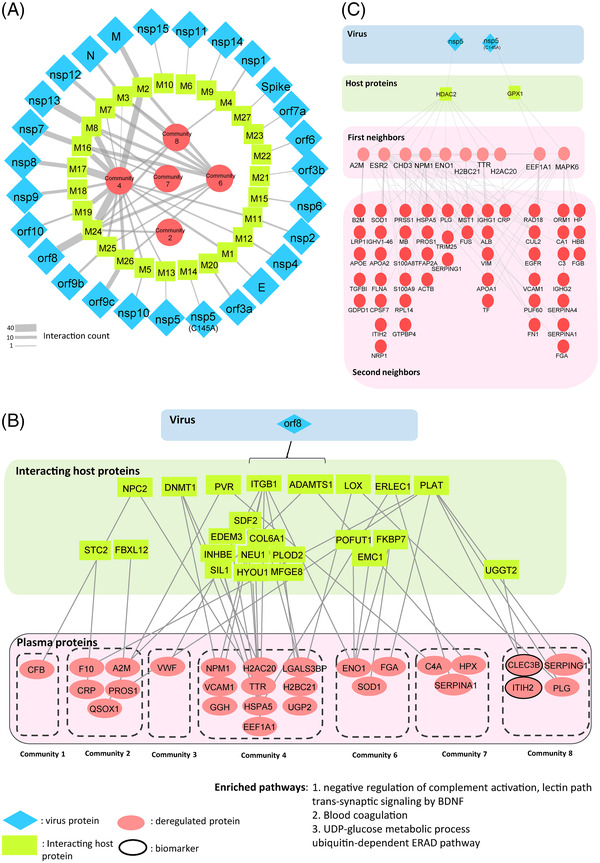
Experimental design: We systematically analyzed plasma proteomes of COVID-19 patients from Turkey by using mass spectrometry. Different severity grades (moderate, severe, and critical) and periods of disease (early, inflammatory, and recovery) are monitored. Significant alterations in protein expressions are used to reconstruct the COVID-19 associated network that was further extended to connect viral and host proteins.
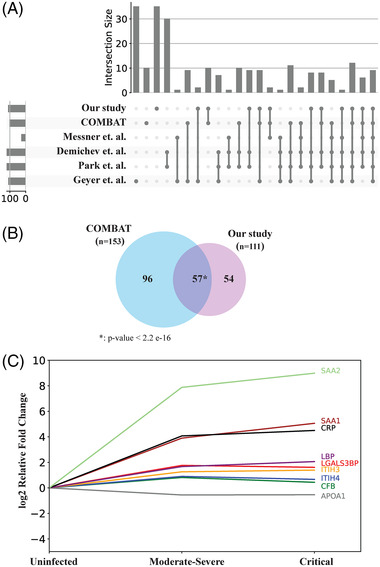
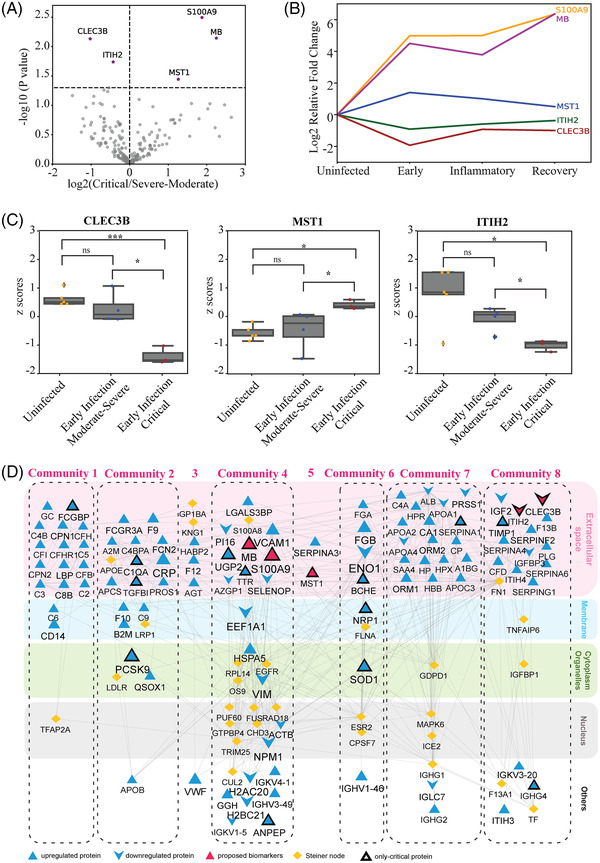
Results: Across all COVID-19 patients, 111 differentially expressed proteins were found, of which 28 proteins were unique to our study mainly enriching in immunoglobulin production. By monitoring different severity grades and periods of disease, CLEC3B, MST1, and ITIH2 were identified as potential early predictors of COVID-19 severity. Most importantly, we extended the COVID-19 associated network with viral proteins and showed the connectedness of viral proteins with human proteins. The most connected viral protein ORF8, which has a role in immune evasion, targets many host proteins tightly connected to the deregulated human plasma proteins.
Conclusions and clinical relevance: Plasma proteomes from critical patients are intrinsically clustered in a distinct group than severe and moderate patients. Importantly, we did not recover any grouping based on the infection period, suggesting their distinct proteome even in the recovery phase. The new potential early severity markers can be further studied for their value in the clinics to monitor COVID-19 prognosis. Beyond the list of plasma proteins, our disease-associated network unravels altered pathways, and the possible therapeutic targets in SARS-CoV-2 infection by connecting human and viral proteins. Follow-up studies on the disease associated network that we propose here will be useful to determine molecular details of viral perturbation and to address how the infection affects human physiology.
Keywords: SARS-CoV-2 infection; data integration; early severity biomarker; plasma proteome; turkey patient profile.
© 2022 Wiley-VCH GmbH.
Conflict of interest statement
The authors declare no conflict of interest.
Figures
Similar articles
-
Looking for pathways related to COVID-19: confirmation of pathogenic mechanisms by SARS-CoV-2-host interactome.Cell Death Dis. 2021 Aug 12;12(8):788. doi: 10.1038/s41419-021-03881-8. Cell Death Dis. 2021. PMID: 34385425 Free PMC article.
-
Proteomic Approaches to Study SARS-CoV-2 Biology and COVID-19 Pathology.J Proteome Res. 2021 Feb 5;20(2):1133-1152. doi: 10.1021/acs.jproteome.0c00764. Epub 2021 Jan 19. J Proteome Res. 2021. PMID: 33464917 Free PMC article.
-
Multilevel proteomics reveals host perturbations by SARS-CoV-2 and SARS-CoV.Nature. 2021 Jun;594(7862):246-252. doi: 10.1038/s41586-021-03493-4. Epub 2021 Apr 12. Nature. 2021. PMID: 33845483
-
Proteomics-based mass spectrometry profiling of SARS-CoV-2 infection from human nasopharyngeal samples.Mass Spectrom Rev. 2024 Jan-Feb;43(1):193-229. doi: 10.1002/mas.21813. Epub 2022 Sep 29. Mass Spectrom Rev. 2024. PMID: 36177493 Free PMC article. Review.
-
Lost in deletion: The enigmatic ORF8 protein of SARS-CoV-2.Biochem Biophys Res Commun. 2021 Jan 29;538:116-124. doi: 10.1016/j.bbrc.2020.10.045. Epub 2020 Oct 21. Biochem Biophys Res Commun. 2021. PMID: 33685621 Free PMC article. Review.
Cited by
-
Longitudinal plasma proteomics reveals biomarkers of alveolar-capillary barrier disruption in critically ill COVID-19 patients.Nat Commun. 2024 Jan 25;15(1):744. doi: 10.1038/s41467-024-44986-w. Nat Commun. 2024. PMID: 38272877 Free PMC article.
-
Alterations in plasma proteome during acute COVID-19 and recovery.Mol Med. 2024 Aug 25;30(1):131. doi: 10.1186/s10020-024-00898-5. Mol Med. 2024. PMID: 39183264 Free PMC article.
-
Comprehensive proteomics and meta-analysis of COVID-19 host response.Nat Commun. 2023 Sep 22;14(1):5921. doi: 10.1038/s41467-023-41159-z. Nat Commun. 2023. PMID: 37739942 Free PMC article.
-
Differences in biomarker levels and proteomic survival prediction across two COVID-19 cohorts with distinct treatments.iScience. 2025 Feb 17;28(3):112046. doi: 10.1016/j.isci.2025.112046. eCollection 2025 Mar 21. iScience. 2025. PMID: 40124495 Free PMC article.
-
Deep Plasma Proteomics with Data-Independent Acquisition: Clinical Study Protocol Optimization with a COVID-19 Cohort.J Proteome Res. 2024 Sep 6;23(9):3806-3822. doi: 10.1021/acs.jproteome.4c00104. Epub 2024 Aug 19. J Proteome Res. 2024. PMID: 39159935 Free PMC article.
References
-
- WHO . (2022). WHO coronavirus (COVID‐19). WHO. https://covid19.who.int/
-
- NIH . (2022). Clinical spectrum of SARS‐CoV‐2 infection. NIH. https://www.covid19treatmentguidelines.nih.gov/overview/clinical‐spectrum/
-
- Middeldorp, S. , Coppens, M. , van Haaps, T. F. , Foppen, M. , Vlaar, A. P. , Muller, M. C. A. , Bouman, C. C. S. , Beenen, L. F. M. , Kootte, R. S. , Heijmans, J. , Smits, L. P. , Bonta, P. I. , & van Es, N. (2020). Incidence of venous thromboembolism in hospitalized patients with COVID‐19. Journal of Thrombosis and Haemostasis, 18(8), 1995–2002. 10.1111/jth.14888 - DOI - PMC - PubMed
Publication types
MeSH terms
Substances
Grants and funding
LinkOut - more resources
Full Text Sources
Medical
Research Materials
Miscellaneous
