. 2022 Oct 11:11:e77419.
doi: 10.7554/eLife.77419.

EZ Clear for simple, rapid, and robust mouse whole organ clearing

Affiliations

EZ Clear for simple, rapid, and robust mouse whole organ clearing

Chih-Wei Hsu et al. Elife. .

Abstract

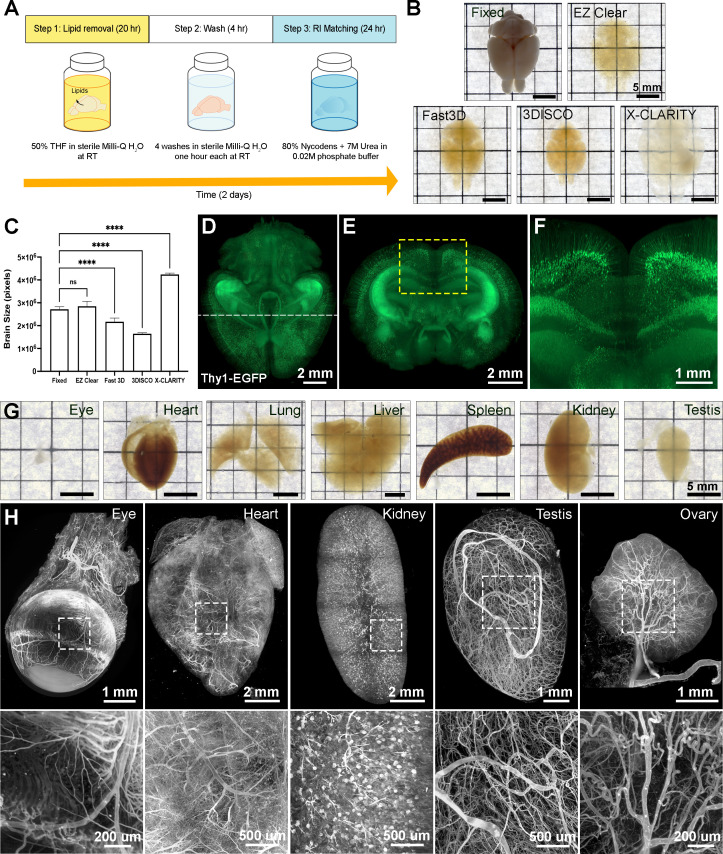
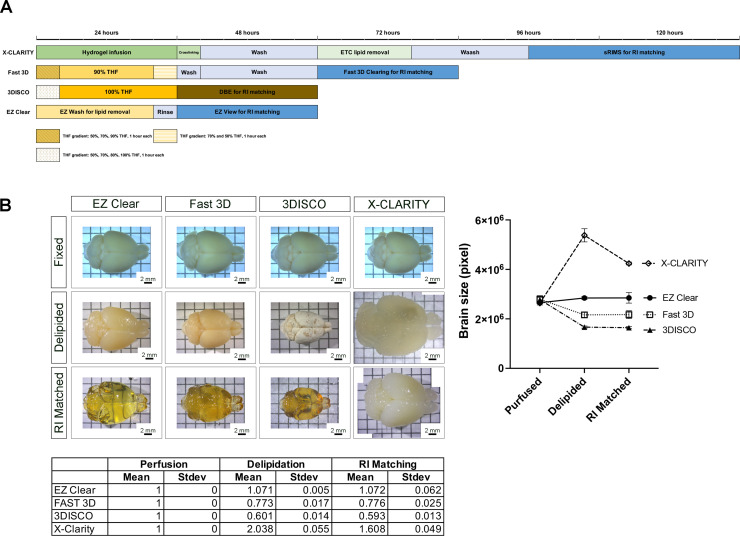
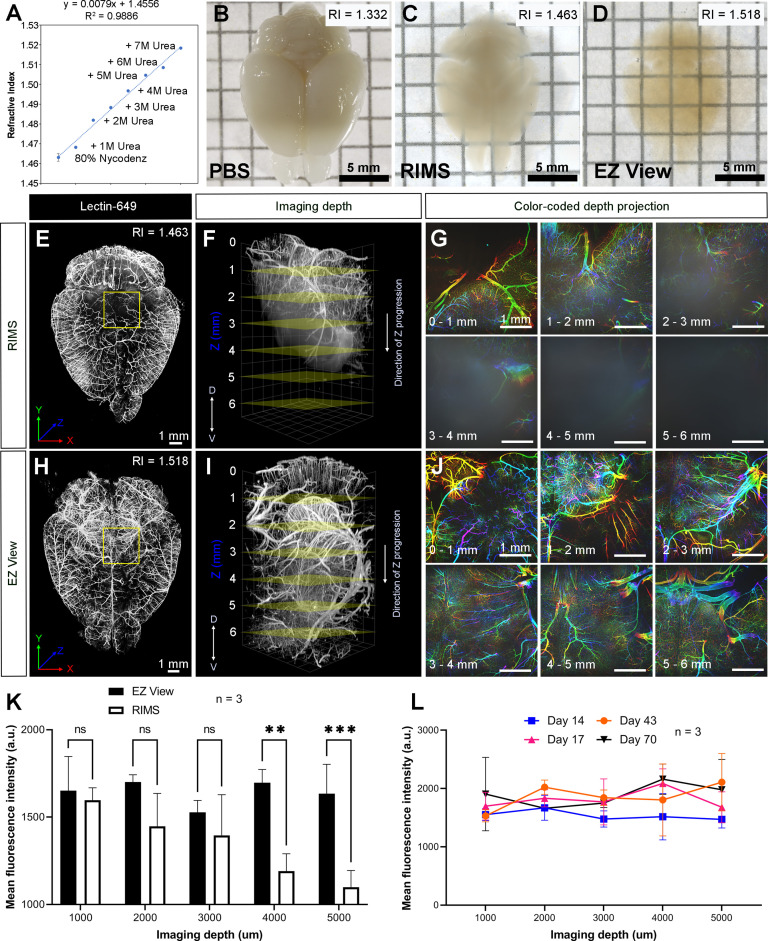
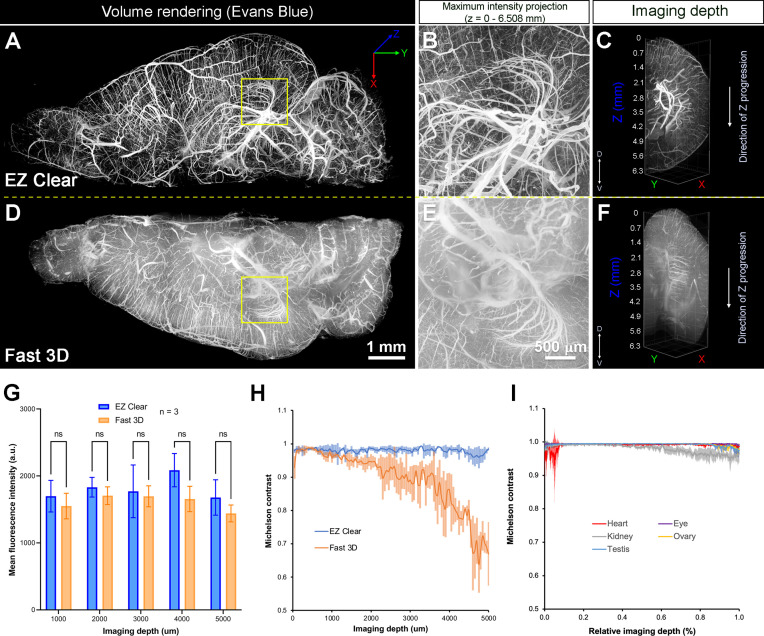
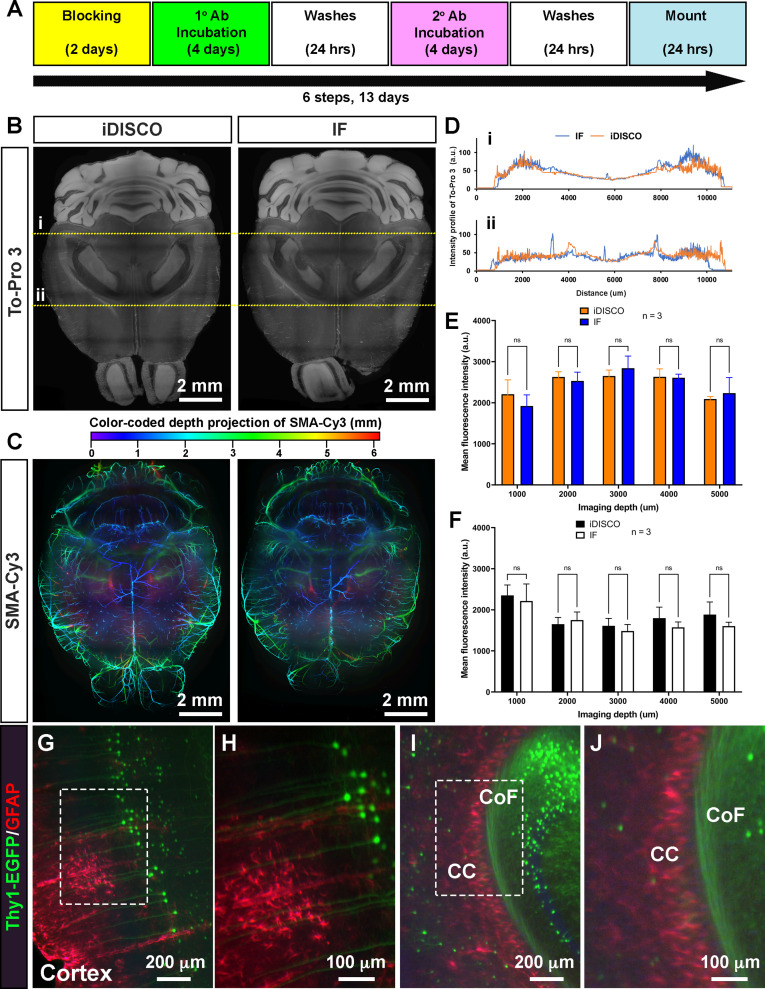
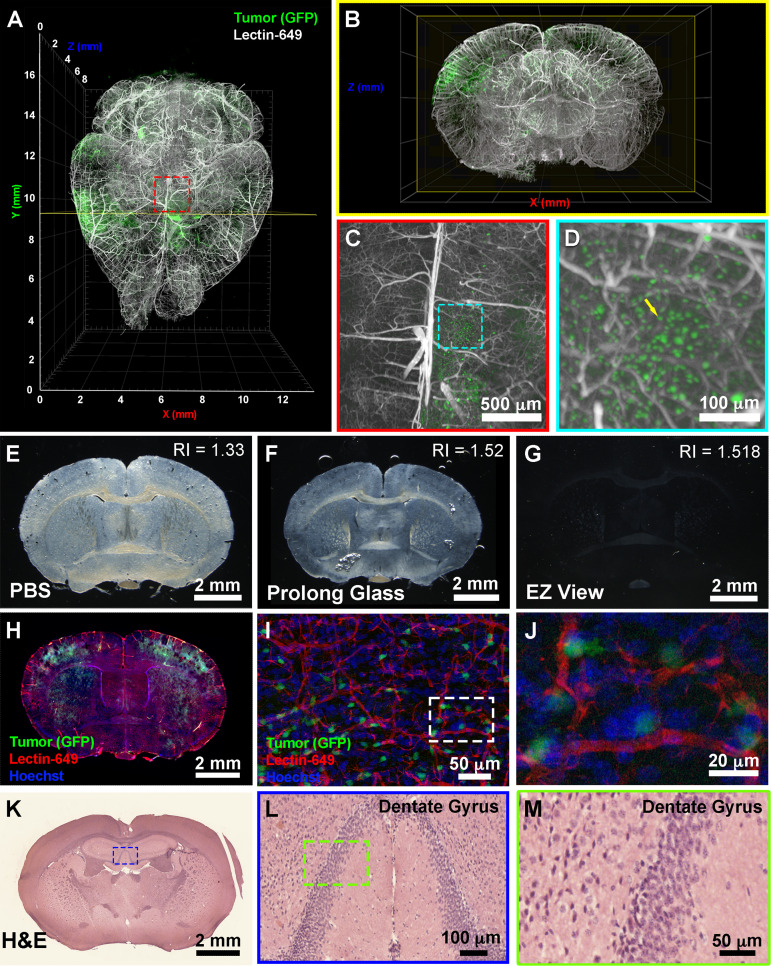
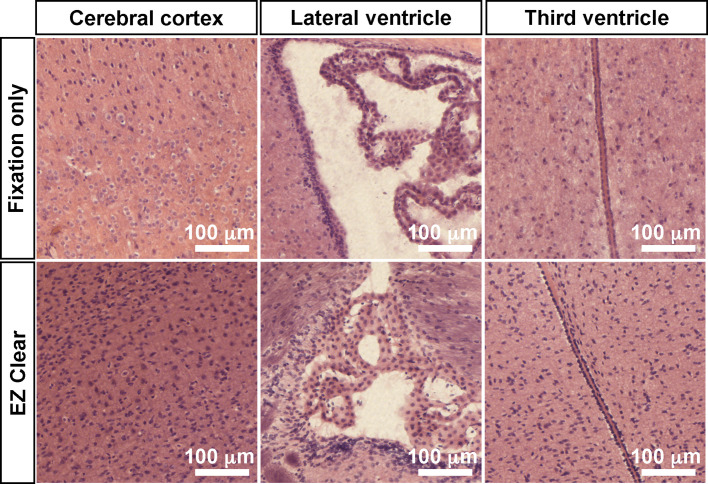
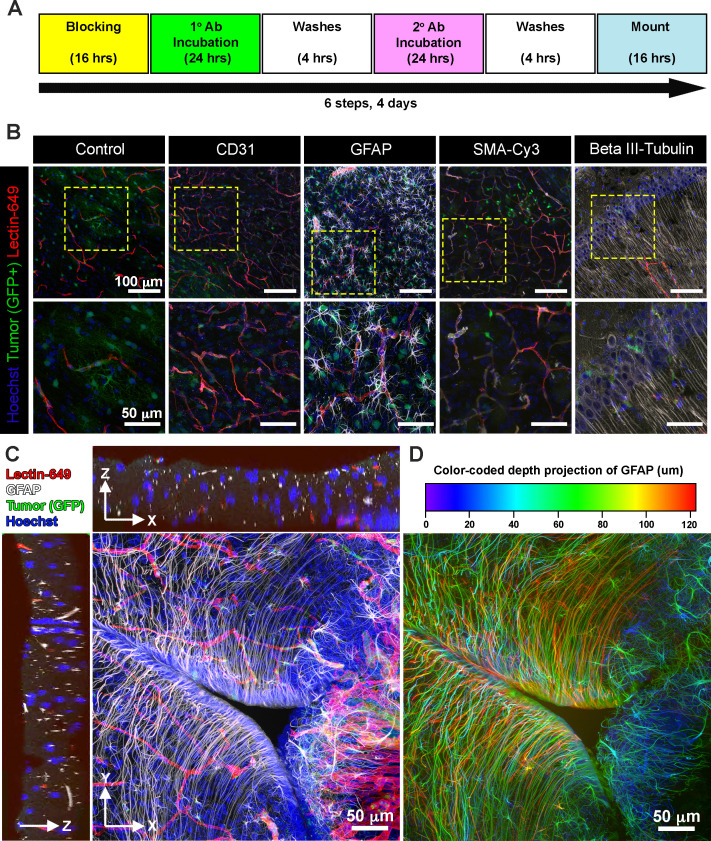
Tissue clearing for whole organ cell profiling has revolutionized biology and imaging for exploration of organs in three-dimensional space without compromising tissue architecture. But complicated, laborious procedures, or expensive equipment, as well as the use of hazardous, organic solvents prevent the widespread adoption of these methods. Here, we report a simple and rapid tissue clearing method, EZ Clear, that can clear whole adult mouse organs in 48 hr in just three simple steps. Samples stay at room temperature and remain hydrated throughout the clearing process, preserving endogenous and synthetic fluorescence, without altering sample size. After wholemount clearing and imaging, samples processed with EZ Clear can be subjected to downstream applications, such as tissue embedding and cryosectioning followed by standard histology or immunofluorescent staining without loss of fluorescence signal from endogenous or synthetic reporters. Furthermore, we demonstrate that wholemount adult mouse brains processed with EZ Clear can be successfully immunolabeled for fluorescent imaging while still retaining signal from endogenous fluorescent reporters. Overall, the simplicity, speed, and flexibility of EZ Clear make it easy to adapt and implement in diverse imaging modalities in biomedical research.

Keywords: 3D imaging; cancer biology; developmental biology; mouse; neuroscience; tissue clearing.


Conflict of interest statement

CH, JC, JK, WT, TR, CF, MD, JW No competing interests declared

Figures

Figure 1.
Figure 1.. EZ Clear is a simple, rapid, and efficient tissue clearing process.
(A) The three steps, requiring 48 hr of the EZ Clear tissue clearing protocol. (B) Brightfield representative images of adult mouse brains (9 weeks of age) fixed in 4% paraformaldehyde (PFA) only, or fixed and cleared using EZ Clear, Fast 3D, 3DISCO, or X-CLARITY. (C) Quantitative comparison of the volume changes of the mouse brains before and after processing with different clearing protocols. (n=4, one-way ANOVA. Error bars represent standard deviation (SD). ns – not significant, ****p<0.0001.) (D–F) Volume rendering of a wholemount, 4-month-old Thy1-EGFP-M mouse brain processed with EZ Clear and imaged by lightsheet fluorescence microscopy across a total imaging depth of 5 mm, dorsal to ventral axis and presented at (D) dorsal view and (E and F) sectioned digitally at the transverse (coronal) axis. (G) Brightfield representative images of adult mouse organs (eye, heart, lung, liver, spleen, kidney, and testis) processed by EZ Clear. (H) Maximum intensity projections of EZ Clear processed, wholemount lightsheet fluorescent microscopy imaged mouse organs (eye, heart, kidney, testis, and ovary) with the endothelium labeled by fluorescently conjugated Lycopersicon esculentum lectin (lectin-DyLight 649).
Figure 1—figure supplement 1.
Figure 1—figure supplement 1.. Comparison of EZ Clear to solvent- and aqueous-based clearing methods.
(A) Schematic of required steps and time for tissue clearing with X-CLARITY, Fast 3D, 3DISCO, and EZ Clear. (B) Representative images of brains cleared by X-CLARITY, Fast 3D, 3DISCO, and EZ Clear after 4% paraformaldehyde (PFA) fixation, delipidation, and refractive index (RI) matching with EZ View (EZ Clear), Fast 3D imaging solution (Fast 3D), DEB (3DISCO), and sRIMS (X-CLARITY). The outlined boundary of the brain from each of the captured brightfield images was used to quantify the total pixel number and thus brain size at each step (n=4 brains measured for each solution, error bars represent standard deviation).
Figure 2.
Figure 2.. High refractive index imaging buffer EZ View achieves deeper imaging depth and maintains fluorescence stability.
(A) Refractive index (RI) of 80% Nycodenz increases linearly with increasing concentrations of urea (n=3). (B–D) Comparison of transparency of adult mouse brains processed with EZ Clear lipid removal, washing, and then equilibration in (B) PBS (RI = 1.332), (C) refractive index matching solution (RIMS) (RI = 1.463), and (D) EZ View (RI = 1.518) for 24 hr at room temperature. Comparison of 3.5-month-old mouse brains perfused with lectin-649, then treated with delipidation, water washes, equilibrated in (E–G) RIMS and (H–J) EZ View, and imaged by lightsheet fluorescence microscopy (LSFM). (E and H) Comparison of volume rendered whole mouse brains, transverse view, and (F and I) across the imaging axis starting from dorsal to ventral, and (G and J) color-coded depth projection at 1 mm intervals beginning from dorsal (0 mm) to ventral (6 mm) side. (K) Quantitative comparison of mean fluorescence intensity of lectin-694 at different imaging depths (dorsal to ventral) shows the signal intensity gradually decreases along with the imaging depth when the brains were equilibrated in RIMS, unlike those equilibrated in EZ View. (n=3, error bars represent standard deviation [SD]. Two-way ANOVA and multiple comparisons. ns – not significant, **p<0.01, ***p<0.001.) (I) The fluorescence intensity of lectin-694 remain stable when stored in EZ View up to 70 days (n=3, two-way ANOVA and multiple comparisons).
Figure 3.
Figure 3.. Quantitative comparison of fluorescence intensity and contrast between samples processed by EZ Clear and Fast 3D.
(A–F) Lightsheet imaging of a mouse brain perfused with Evans blue dye and cleared by EZ Clear (right hemisphere, A–C) and Fast 3D (left hemisphere, D–F) shows that tissue processed with EZ Clear has cleaner signal and less light scattering. (G) Quantitative comparison of mean fluorescence intensity of lectin-649 at different imaging depths (dorsal to ventral axis) shows no significant difference between hemispheres treated with EZ Clear and Fast 3D (n=3, two-way ANOVA and multiple comparisons, error bars represent standard deviation [SD], ns – not significant). However, (H) while the lectin-649 fluorescence signal contrast remains sharp in EZ Clear treated brain hemispheres (n=3), the contrast of the signal gradually decreases along with imaging depth in the Fast 3D processed brains. (I) Contrast of the lectin-649 fluorescence signal also remains sharp in EZ Clear treated eye, heart, kidney, testis, and ovary.
Figure 4.
Figure 4.. EZ Clear processed samples are compatible with wholemount immunofluorescent staining.
(A) Six-step, standard wholemount immunofluorescent staining procedure for EZ Clear treated mouse brains. (B) Whole organ immunostaining of EZ Clear processed mouse brains using iDISCO or standard immunostaining (direct IHC) protocols along with To-Pro 3 staining to label nuclei (digital sectioned transversely at 2.5 mm) and (C) anti-smooth muscle α-actin conjugated to Cy3 to label smooth muscle cells and arteries (color-coded depth projection). (D) Comparison of the To-Pro 3 penetrance across the lateral axis between iDISCO and standard IHC processed samples. Quantitative comparison of mean fluorescence intensity of (E) To-Pro 3 and (F) αSMA-Cy3 at different imaging depths (dorsal to ventral) shows no significant difference between EZ Clear treated brains stained with iDISCO and standard IHC protocols (n=3, two-way ANOVA and multiple comparisons, error bars represent standard deviation [SD], ns = not significant.). (G–J) Thy1-EGFP-M mouse brain processed with EZ Clear, wholemount immunostained using a standard immunofluorescent protocol with antibodies raised against GFAP (red, glia) and wholemount imaged by lightsheet fluorescence microscopy (LSFM) at the (G and H) cortex and the intersection of the (I and J) corpus callosum (CC) and the commissure of the fornix (CoF).
Figure 5.
Figure 5.. EZ Clear processed and imaged samples can be further processed for downstream cryosection, histology, and immunofluorescence staining.
(A) Volume rendering of a wholemount lightsheet fluorescence microscopy (LSFM) imaged, EZ Clear processed postnatal day 104 (P104) glioblastoma multiforme (GBM) mouse brain with GFP+ tumor cells and lectin-649 labeled vasculature at (A) dorsal view and (B) sectioned digitally in the transverse (coronal) axis. GFP+ tumor cells can be identified in large clusters (A and B), as well as sparse single cells (C and D) from wholemount imaged data. (E–G) EZ Clear processed and imaged brains processed for cryosectioning in the coronal plane, and then mounted in (E) PBS, (F) Prolong Glass Antifade medium (n=1.52), or (G) EZ View. Sections mounted in EZ View are compatible with fluorescence (H) and confocal (I and J) imaging and the signals from GFP+ tumor cells and fluorescent lectin labeled vasculature are preserved. (K–M) Tissues processed for EZ Clear are also compatible with downstream histological applications, as cryosections stained with hematoxylin and eosin (H&E) yielded robust nuclear and cytoplasmic labeling.
Figure 5—figure supplement 1.
Figure 5—figure supplement 1.. EZ Clear processed and imaged samples processed for cryosectioning and hematoxylin and eosin (H&E) staining.
(A) Comparison of H&E staining of sections from brains that were either fixed in 4% paraformaldehyde (PFA) or processed with EZ Clear and imaged by lightsheet fluorescence microscopy (LSFM) at the cerebral cortex, lateral ventricle, and third ventricle regions.
Figure 6.
Figure 6.. EZ Clear processed and imaged samples are compatible with cryosectioning and immunofluorescent staining.
(A) Six-step immunostaining procedure for processing tissues after EZ Clearing and imaging. (B) Cryosections in the coronal plane from an EZ Clear processed and imaged postnatal day 104 (P104) glioblastoma multiforme (GBM) mouse brain with GFP+ tumor cells and lectin-649 labeled vessels were directly imaged (control) or immunostained to detect CD31 (endothelial), GFAP (astrocytes, glia), smooth muscle α-actin (smooth muscle cells), and β-III tubulin (neurons). Stained sections were mounted on slides with EZ View and imaged on an 880 Airyscan FAST confocal microscope at ×20. (C) Orthogonal and (D) color-coded depth projection views of GFP+ tumor cells and lectin-649 labeled vessels section labeled with GFAP (astrocytes, glia) and Hoechst (nuclei). The GFAP signal was constant throughout the 100 μm section.
Figure 7.
Figure 7.. Preparing a cleared mouse brain for imaging on the Zeiss Lightsheet Z.1 platform.
(A) A custom-designed sample holder with a magnetic nut. (B) A cleared brain sample was attached to the head of the plastic screw using superglue. (C) A 5 mL syringe is used as a casting mold for embedding the cleared brain and the tip of the sample holder in melted 1% agarose. (D) A cleared brain and sample holder embedded in 1% agarose. (E) Custom-made Optical Imaging and Vital Microscopy core (OiVM) ×5 lightsheet chamber. Comparison of the imaging chambers between (F) Zeiss ×5 and (G) OiVM ×5. (H) Sample mounting probe with a recessed magnet. (I) Demonstration of how the sample mounting probe and sample holder attach. To load the sample into the lightsheet Z.1 chamber, first (J) the embedded sample and holder are placed in the custom-designed imaging chamber by hanging with a PTFE chamber cover with 3 mm opening (Zeiss) by the magnetic nut, then (K) the imaging chamber with sample hanging was assembled onto lightsheet. (L and M) The sample holder was then attached to the probe by lifting the sample, the cover, and attached the magnetic nut to the magnet in the probe (yellow arrow). The chamber cover is removed and then the sample may be imaged.

References

    1. Ahrens MB, Orger MB, Robson DN, Li JM, Keller PJ. Whole-Brain functional imaging at cellular resolution using light-sheet microscopy. Nature Methods. 2013;10:413–420. doi: 10.1038/nmeth.2434. - DOI - PubMed
    1. Amat F, Höckendorf B, Wan Y, Lemon WC, McDole K, Keller PJ. Efficient processing and analysis of large-scale light-sheet microscopy data. Nature Protocols. 2015;10:1679–1696. doi: 10.1038/nprot.2015.111. - DOI - PubMed
    1. Ariel P. A beginner ’ S guide to tissue clearing. The International Journal of Biochemistry & Cell Biology. 2017;84:35–39. doi: 10.1016/j.biocel.2016.12.009. - DOI - PMC - PubMed
    1. Carlson JC, Cantu Gutierrez M, Lozzi B, Huang-Hobbs E, Turner WD, Tepe B, Zhang Y, Herman AM, Rao G, Creighton CJ, Wythe JD, Deneen B. Identification of diverse tumor endothelial cell populations in malignant glioma. Neuro-Oncology. 2021;23:932–944. doi: 10.1093/neuonc/noaa297. - DOI - PMC - PubMed
    1. Chen F, Rosiene J, Che A, Becker A, LoTurco J. Tracking and transforming neocortical progenitors by CRISPR/Cas9 gene targeting and piggyBac transposase lineage labeling. Development. 2015;142:3601–3611. doi: 10.1242/dev.118836. - DOI - PMC - PubMed

Publication types