Association Between Medicaid Dental Payment Policies and Children's Dental Visits, Oral Health, and School Absences
- PMID: 36218932
- PMCID: PMC9463610
- DOI: 10.1001/jamahealthforum.2022.3041
Association Between Medicaid Dental Payment Policies and Children's Dental Visits, Oral Health, and School Absences
Abstract
Importance: Although all state Medicaid programs cover children's dental services, less than half of publicly insured children receive recommended care.
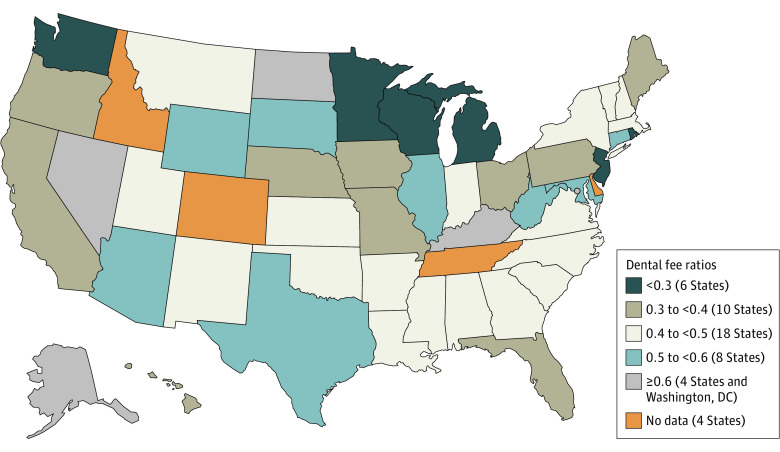
Objective: To evaluate the association between the ratio of Medicaid payment rates to dentist charges for an index of services (fee ratio) and children's preventive dental visits, oral health, and school absences.
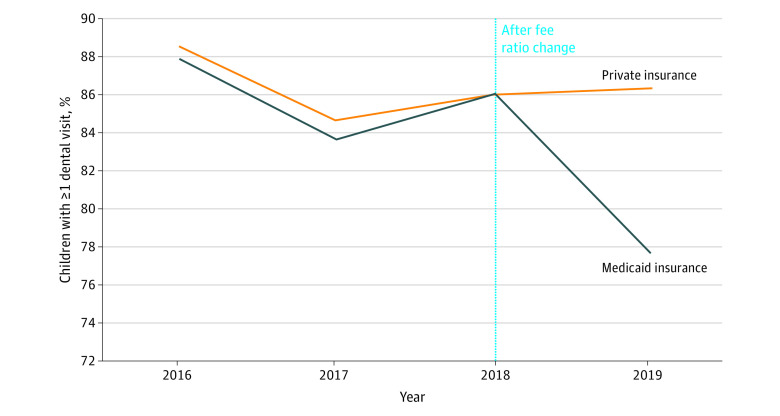
Design, setting, and participants: In this cross-sectional study, a difference-in-differences analysis was conducted between September 2021 and April 2022 of 15 738 Medicaid-enrolled children and a control group of 16 867 privately insured children aged 6 to 17 years who participated in the 2016-2019 National Survey of Children's Health. Exploratory subgroup analyses by sex and race and ethnicity were also performed. A 2-sided P < .05 was considered significant.
Main outcomes and measures: Past-year preventive dental visits (at least 1 and at least 2), parent-reported excellent oral health, and number of days absent from school (at least 4 days and at least 7 days).
Results: The Medicaid-enrolled sample included a weighted estimate of 51.20% boys and 48.80% girls (mean age, 11.24 years; Black, 21.65%; Hispanic, 37.75%; White, 31.45%). By weighted baseline estimates, 87% and 48% of Medicaid-enrolled children had at least 1 and at least 2 past-year dental visits, respectively, and 29% had parent-reported excellent oral health. Increasing the fee ratio by 1 percentage point was associated with percentage point increases of 0.18 in at least 1 dental visit (95% CI, 0.07-0.30), 0.27 in at least 2 visits (95% CI, 0.04-0.51), and 0.19 in excellent oral health (95% CI, 0.01-0.36). Increases in at least 2 visits were larger for Hispanic children than for White children. By weighted baseline estimates, 28% and 15% of Medicaid-enrolled children had at least 4 and at least 7 past-year school absences, respectively. Regression estimates for school absences were not statistically significant for the full sample but were estimated to be significantly reduced among girls.
Conclusions and relevance: This cross-sectional study found that more generous Medicaid payment policies were associated with significant but modest increases in children's preventive dental visits and excellent oral health. Further research is needed to understand the potential association between policies that improve access to dental care and children's academic success.
Conflict of interest statement
Figures
References
-
- Centers for Disease Control and Prevention . Oral Health Surveillance Report: Trends in Dental Caries and Sealants, Tooth Retention, and Edentulism, United States, 1999-2004 to 2011-2016. US Department of Health and Human Services; 2019.
Publication types
MeSH terms
Grants and funding
LinkOut - more resources
Full Text Sources
Medical
Miscellaneous