. 2022 Oct 4;22(11):4.
doi: 10.1167/jov.22.11.4.

Visual stream connectivity predicts assessments of image quality

Affiliations

Visual stream connectivity predicts assessments of image quality

Elijah F W Bowen et al. J Vis. .

Abstract

Despite extensive study of early vision, new and unexpected mechanisms continue to be identified. We introduce a novel formal treatment of the psychophysics of image similarity, derived directly from straightforward connectivity patterns in early visual pathways. The resulting differential geometry formulation is shown to provide accurate and explanatory accounts of human perceptual similarity judgments. The direct formal predictions are then shown to be further improved via simple regression on human behavioral reports, which in turn are used to construct more elaborate hypothesized neural connectivity patterns. It is shown that the predictive approaches introduced here outperform a standard successful published measure of perceived image fidelity; moreover, the approach provides clear explanatory principles of these similarity findings.


Figures

Figure 1.
Figure 1.
(a) As an original (non-degraded) image (s) becomes increasingly compressed (via a lossy method such as JPEG), how dissimilar are the images judged to be? Equal physical changes, in terms of average luminance, will not be perceived as equal to humans. (b) A reduced example of three pixels in isolation (sa) with degraded counterpart sa'; for comparison, an alternate example (sb) with degraded counterpart sb'. (c) We can convert each image into a pixel vector of luminances (zero for black, one for white), as is often done. Euclidean distances can be computed between a pair of such image vectors by measuring luminance differences across each row and then combining the results. (d) The Euclidean distance between original and degraded images in both images is 0.1; however, humans overwhelmingly perceive change to be greater in the second (sbsb') case, presumably due to the context of surrounding pixels.
Figure 2.
Figure 2.
Vector space account of perceptual strain. Each possible image can be considered a point (i.e., a vector from the origin; black arrows) in pixelated image space, where each Cartesian coordinate is the luminance of one pixel. Here, we plot only two such coordinate axes for simplicity. When humans perceive images, cells form population codes that change the representations of the light patterns. Therefore, an image s and its degraded counterpart s' are displaced to new coordinates sP and s'P. This perceptual strain is quantified as a vector field u(s) that can be evaluated at any image (green arrows). Approach I defines u(s) in terms of biological connectivity patterns. Approach II triangulates the vector field of perceptual strain from Euclidean (dE) and perceived (dP) distance measurements. Crucially, in our hands, perceived distance is Euclidean after the correct perceptual displacement field is applied to images. The new image positions (sP) are left as an internal property of neural representations.
Figure 3.
Figure 3.
Principles formalized from neural connectivity. (a) Caricature of neural projections from cells in the lower population (where each cell represents light at one location, much like pixels) to downstream cells, with a topographic connectivity pattern. Neighboring cells represent neighboring pixels. These cells connect with their neighbors (solid arrows). Downstream, cells again receive projections from neighbors (dashed arrows). See text. (b) A Gaussian connectivity function (see text). Such connectivity is often found in (left to right) retinal ganglion cells (De Monasterio, 1978; Young, 1987) and visual cortex (Young & Lesperance, 2001). (c) A difference-of-Gaussian connectivity function (see text). Such connectivity is found in, for example, OFF-center retinal bipolar cells (i, midget; ii, diffuse (Dacey et al., 2000)). Similar connectivity is also found in retinal ganglion cells that project to the parvocellular (iii, 0°–5°; iv, 10°–20° from visual center) (Croner & Kaplan, 1995) or magnocellular (v, 0°–10°; vi, 10°–20° from visual center) (Croner & Kaplan, 1995) pathways, across the visual field: vii, peripheral (Dacey, 1996; Dacey, 2000) and viii < 10° from fixation (Rodieck, 1965). (d) Instead of drawing connectivity patterns from documented biology, we can use tools such as regression to find the pattern of connectivity that, given simplicity assumptions, best explains the relationship between images and human ratings.
Figure 4.
Figure 4.
Characteristics of the SceneIQ dataset. (a) Example images. (b) Layout of the experimental paradigm. (c) Mean of the subject-wise standard deviation across all images and quality levels for three sets of data (left to right): the CSIQ (JPEG) dataset's original DMOS scores, DMOS scores for CSIQ non-degraded images degraded at the same quality levels used on the SceneIQ dataset and scored on MTurk, and the SceneIQ scores. (d) SceneIQ Online dataset. Mean DMOS score increased as the JPEG quality decreased (humans rate lower fidelity images as being lower fidelity). Bars are standard error across images (N = 2080).
Figure 5.
Figure 5.
Determination of an approach II Jacobian by way of regression. A Jacobian is initialized. Second, the Jacobian is used to measure the distance between each image pair. Third, the error of this Jacobian is computed based on how well its distances correlate with human subject ratings. If this Jacobian produces reduced error, it is marked as the best working hypothesis. Finally, new Jacobians are generated with slight deviations from the best working hypothesis.
Figure 6.
Figure 6.
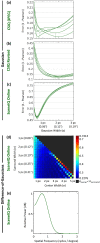
Approach I optimality with various Gaussian widths. A range of Gaussian widths (σ) was evaluated for each of five random folds of the (a) CSIQ (JPEG) dataset, (b) CSIQ Revised dataset, and (c) SceneIQ Online dataset using Pearson correlation. Dashed lines mark the global minima of each fold. (d) Difference-of-Gaussians training error as a combined function of σcenter and σsurround, on SceneIQ Online fold 1 of 2. For visualization, the third parameter (α) was eliminated by selecting its optimal value for each combination of σcenter and σsurround. (e) Contrast sensitivity function computed from the best difference-of-Gaussians parameters (see text).
Figure 7.
Figure 7.
Correlation of Euclidean and approach II with DMOS. Half (first fold) of the full SceneIQ Online dataset. Machine ratings are on the x-axis, and human DMOS ratings are on the y-axis. We have plotted lines of best fit. (a) Pearson's correlation: Euclidean r = 0.44; approach II r = 0.76. Euclidean and approach II ratings were z-scored separately so they could be more usefully superimposed. (b) Approach II against human ratings, reproduced on log–log axes. Pearson's correlation on these axes was r = 0.85. Logistic fits and comparisons with SSIM are available in Supplementary Materials.

References

    1. Ashby, F. G., & Perrin, N. A. (1988). Toward a unified theory of similarity and recognition. Psychological Review, 95, 124.
    1. Berardino, A., Laparra, V., Ballé, J., & Simoncelli, E. (2017). Eigen-distortions of hierarchical representations. Advances in Neural Information Processing Systems, 2017-December, 3531–3540.
    1. Bowen, E. F., Felch, A., Granger, R., & Rodriguez, A. (2018) Computer-implemented perceptual apparatus . U.S. Patent No. PCT/US18/43963.
    1. Bradley, A. P. (1999). A wavelet visible difference predictor. IEEE Transactions on Image Processing, 8, 717–730. - PubMed
    1. Buhrmester, M., Kwang, T., & Gosling, S. D. (2011). Amazon's Mechanical Turk a new source of inexpensive, yet high-quality, data? Perspectives on Psychological Science, 6, 3–5. - PubMed

Publication types