. 2022 Nov 1;15(11):755-766.
doi: 10.1158/1940-6207.CAPR-22-0258.

Epigenome-Wide Study Identifies Epigenetic Outliers in Normal Mucosa of Patients with Colorectal Cancer

Affiliations

Epigenome-Wide Study Identifies Epigenetic Outliers in Normal Mucosa of Patients with Colorectal Cancer

Jayashri Ghosh et al. Cancer Prev Res (Phila). .

Abstract

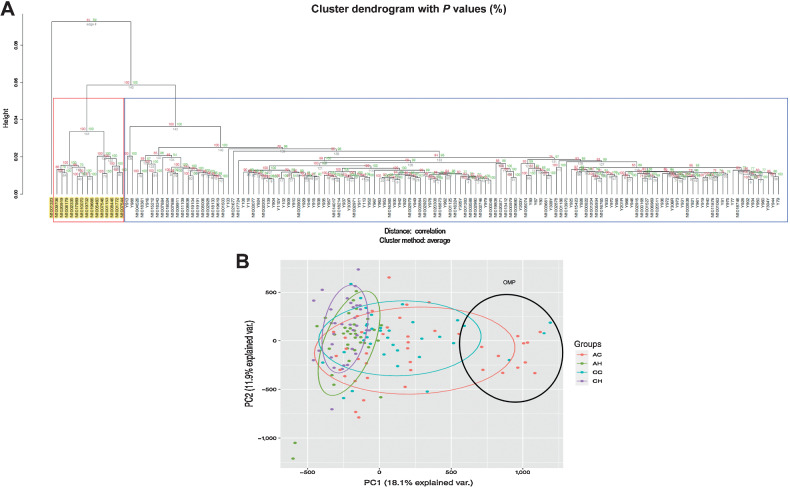
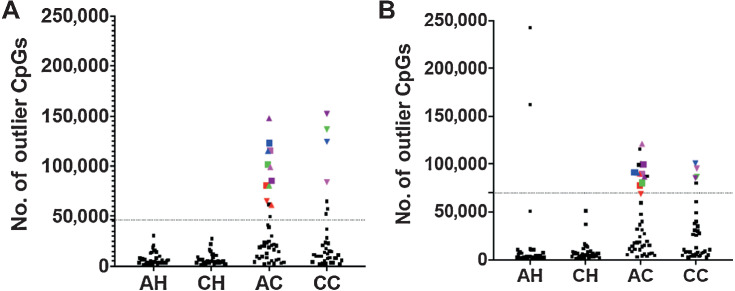
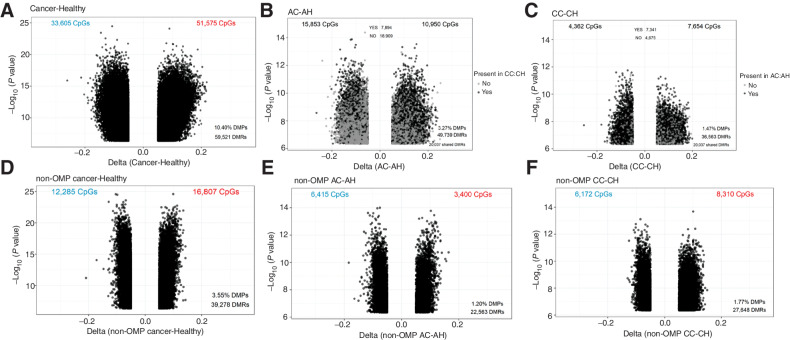
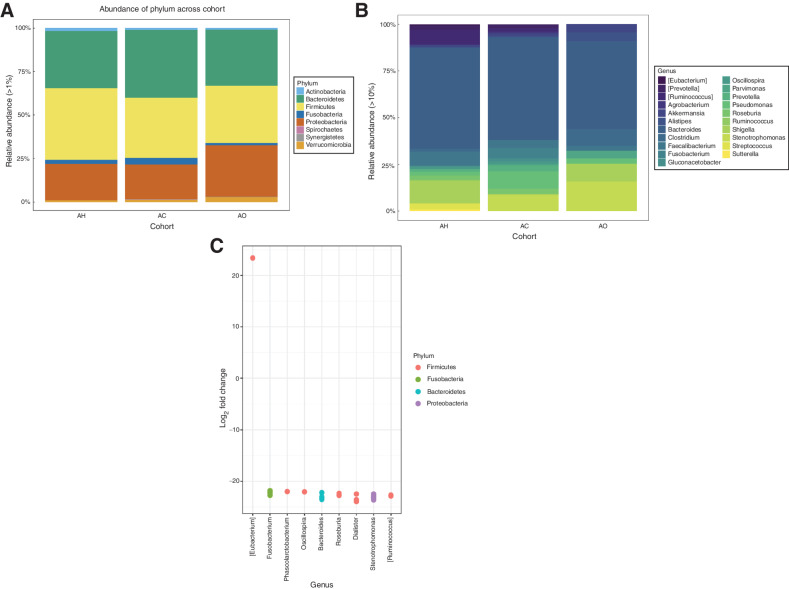
Nongenetic predisposition to colorectal cancer continues to be difficult to measure precisely, hampering efforts in targeted prevention and screening. Epigenetic changes in the normal mucosa of patients with colorectal cancer can serve as a tool in predicting colorectal cancer outcomes. We identified epigenetic changes affecting the normal mucosa of patients with colorectal cancer. DNA methylation profiling on normal colon mucosa from 77 patients with colorectal cancer and 68 controls identified a distinct subgroup of normally-appearing mucosa with markedly disrupted DNA methylation at a large number of CpGs, termed as "Outlier Methylation Phenotype" (OMP) and are present in 15 of 77 patients with cancer versus 0 of 68 controls (P < 0.001). Similar findings were also seen in publicly available datasets. Comparison of normal colon mucosa transcription profiles of patients with OMP cancer with those of patients with non-OMP cancer indicates genes whose promoters are hypermethylated in the OMP patients are also transcriptionally downregulated, and that many of the genes most affected are involved in interactions between epithelial cells, the mucus layer, and the microbiome. Analysis of 16S rRNA profiles suggests that normal colon mucosa of OMPs are enriched in bacterial genera associated with colorectal cancer risk, advanced tumor stage, chronic intestinal inflammation, malignant transformation, nosocomial infections, and KRAS mutations. In conclusion, our study identifies an epigenetically distinct OMP group in the normal mucosa of patients with colorectal cancer that is characterized by a disrupted methylome, altered gene expression, and microbial dysbiosis. Prospective studies are needed to determine whether OMP could serve as a biomarker for an elevated epigenetic risk for colorectal cancer development.

Prevention relevance: Our study identifies an epigenetically distinct OMP group in the normal mucosa of patients with colorectal cancer that is characterized by a disrupted methylome, altered gene expression, and microbial dysbiosis. Identification of OMPs in healthy controls and patients with colorectal cancer will lead to prevention and better prognosis, respectively.


Figures

Figure 1. Analysis of methylation data. A, Unsupervised cluster analysis of study samples. Hierarchial cluster plots using unsupervised cluster analysis showing separate cluster for the OMPs. B, Principal component analyses. Principal component analyses of study groups using 819,239 CpGs.
Figure 1.
Analysis of methylation data. A, Unsupervised cluster analysis of study samples. Hierarchial cluster plots using unsupervised cluster analysis showing separate cluster for the OMPs. B, Principal component analyses. Principal component analyses of study groups using 819,239 CpGs.
Figure 2. Identification of samples with OMP. Number of CpGs in which a sample is hypermethylated outlier (A) or Hypomethylated outlier (B). Dotted line indicates outlier boundary. Each symbol is a sample. Symbols above the dotted lines are outliers in respective plots. Colored symbols indicate samples that are outliers in both the plots and are termed as “OMPs”. Samples represented by colored symbols are OMPs. Same color and shape show the same individuals in both the plots.
Figure 2.
Identification of samples with OMP. Number of CpGs in which a sample is hypermethylated outlier (A) or Hypomethylated outlier (B). Dotted line indicates outlier boundary. Each symbol is a sample. Symbols above the dotted lines are outliers in respective plots. Colored symbols indicate samples that are outliers in both the plots and are termed as “OMPs”. Samples represented by colored symbols are OMPs. Same color and shape show the same individuals in both the plots.
Figure 3. Volcano plots showing differential methylation analyses. Colon cancer versus healthy in all samples (A), AAs (B), and Caucasians (C). Non-outlier colon cancer versus healthy in all samples (D), AAs (E), and Caucasians (F). DMPs, differentially methylated positions; DMRs, differentially methylated regions.
Figure 3.
Volcano plots showing differential methylation analyses. Colon cancer versus healthy in all samples (A), AAs (B), and Caucasians (C). Non-outlier colon cancer versus healthy in all samples (D), AAs (E), and Caucasians (F). DMPs, differentially methylated positions; DMRs, differentially methylated regions.
Figure 4. Analysis of the microbiome from AA samples. A, Taxonomic composition of colon tissue microbiomes at the phylum level. B, Taxonomic composition of colon tissue microbiomes at the genus level. C, Differential abundance analysis between microbiome samples of AC and AO cohorts. Each point represents ASV belonging to respective bacteria species. ASVs were considered significant if their false discovery rate-corrected P value was < 0.05. Multiple points visualized under the same genus represent ASVs that are classified within the same genus but differ by one or more nucleotides. Taxa in square brackets are annotations for proposed taxonomy supplied by the Greengenes database.
Figure 4.
Analysis of the microbiome from AA samples. A, Taxonomic composition of colon tissue microbiomes at the phylum level. B, Taxonomic composition of colon tissue microbiomes at the genus level. C, Differential abundance analysis between microbiome samples of AC and AO cohorts. Each point represents ASV belonging to respective bacteria species. ASVs were considered significant if their false discovery rate-corrected P value was < 0.05. Multiple points visualized under the same genus represent ASVs that are classified within the same genus but differ by one or more nucleotides. Taxa in square brackets are annotations for proposed taxonomy supplied by the Greengenes database.

References

    1. Siegel RL, Miller KD, Goding Sauer A, Fedewa SA, Butterly LF, Anderson JC, et al. Colorectal cancer statistics, 2020. CA Cancer J Clin 2020;70:145–64. - PubMed
    1. Guinney J, Dienstmann R, Wang X, de Reyniès A, Schlicker A, Soneson C, et al. The consensus molecular subtypes of colorectal cancer. Nat Med 2015;21:1350–6. - PMC - PubMed
    1. Silviera ML, Smith BP, Powell J, Sapienza C. Epigenetic differences in normal colon mucosa of cancer patients suggest altered dietary metabolic pathways. Cancer Prev Res 2012;5:374–84. - PMC - PubMed
    1. Cesaroni M, Powell J, Sapienza C. Validation of methylation biomarkers that distinguish normal colon mucosa of cancer patients from normal colon mucosa of patients without cancer. Cancer Prev Res 2014;7:717–26. - PMC - PubMed
    1. Leclerc D, Pham DN, Lévesque N, Truongcao M, Foulkes WD, Sapienza C, et al. Oncogenic role of PDK4 in human colon cancer cells. Br J Cancer 2017;116:930–6. - PMC - PubMed

Publication types

Substances