. 2022 Dec 16;82(24):4604-4623.
doi: 10.1158/0008-5472.CAN-22-1247.

SMAD4 Loss Induces c-MYC-Mediated NLE1 Upregulation to Support Protein Biosynthesis, Colorectal Cancer Growth, and Metastasis

Affiliations

SMAD4 Loss Induces c-MYC-Mediated NLE1 Upregulation to Support Protein Biosynthesis, Colorectal Cancer Growth, and Metastasis

Leon P Loevenich et al. Cancer Res. .

Abstract

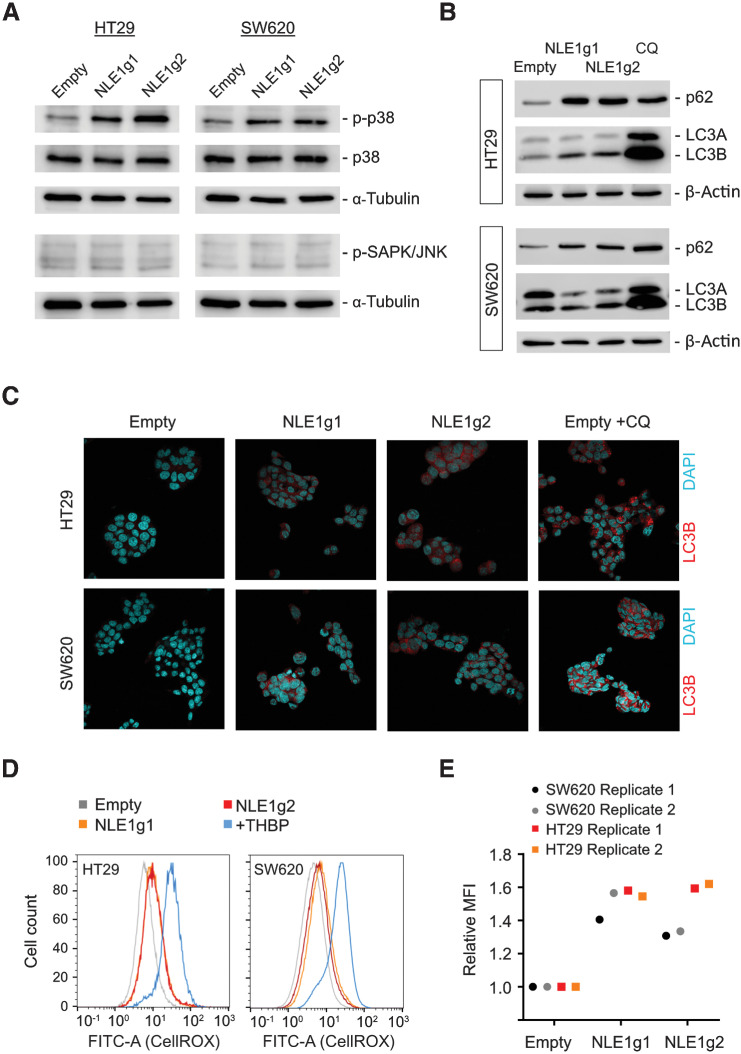
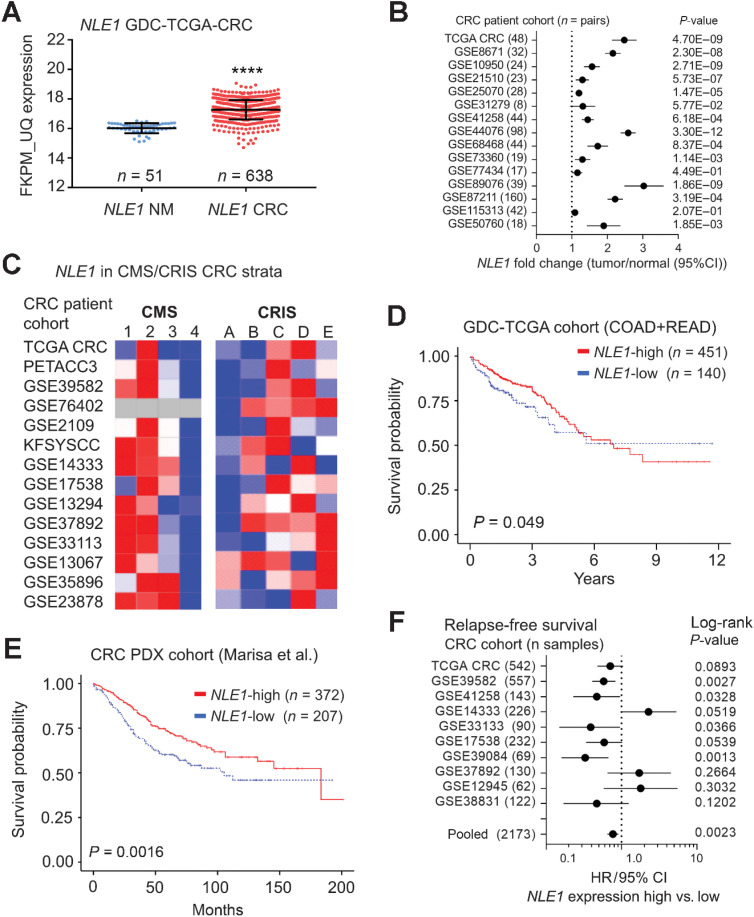
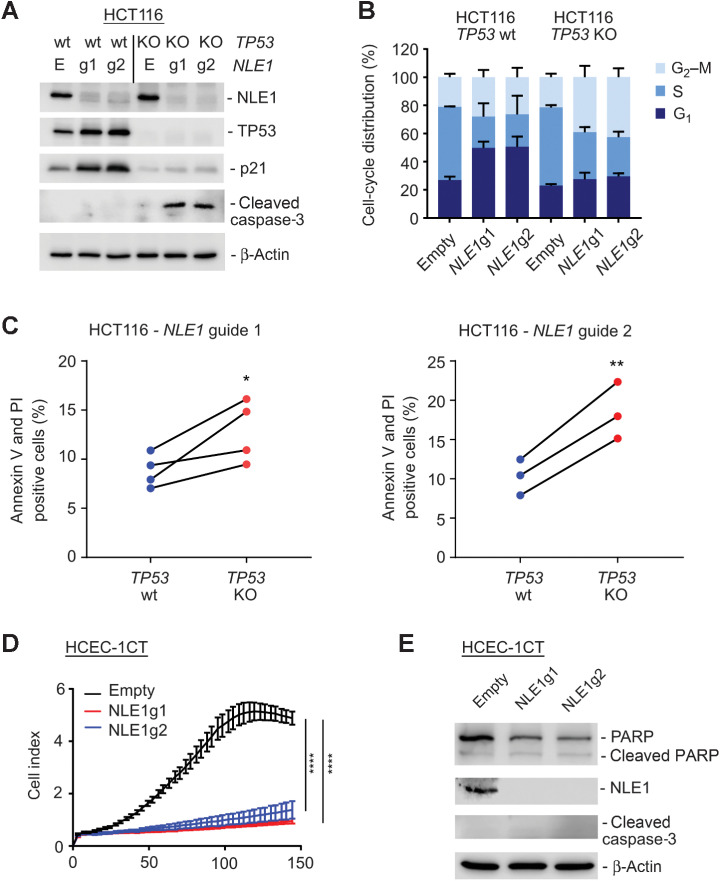
Growth and metastasis of colorectal cancer is closely connected to the biosynthetic capacity of tumor cells, and colorectal cancer stem cells that reside at the top of the intratumoral hierarchy are especially dependent on this feature. By performing disease modeling on patient-derived tumor organoids, we found that elevated expression of the ribosome biogenesis factor NLE1 occurs upon SMAD4 loss in TGFβ1-exposed colorectal cancer organoids. TGFβ signaling-mediated downregulation of NLE1 was prevented by ectopic expression of c-MYC, which occupied an E-box-containing region within the NLE1 promoter. Elevated levels of NLE1 were found in colorectal cancer cohorts compared with normal tissues and in colorectal cancer subtypes characterized by Wnt/MYC and intestinal stem cell gene expression. In colorectal cancer cells and organoids, NLE1 was limiting for de novo protein biosynthesis. Upon NLE1 ablation, colorectal cancer cell lines activated p38/MAPK signaling, accumulated p62- and LC3-positive structures indicative of impaired autophagy, and displayed more reactive oxygen species. Phenotypically, knockout of NLE1 inhibit.ed proliferation, migration and invasion, clonogenicity, and anchorage-independent growth. NLE1 loss also increased the fraction of apoptotic tumor cells, and deletion of TP53 further sensitized NLE1-deficient colorectal cancer cells to apoptosis. In an endoscopy-guided orthotopic mouse transplantation model, ablation of NLE1 impaired tumor growth in the colon and reduced primary tumor-derived liver metastasis. In patients with colorectal cancer, NLE1 mRNA levels predicted overall and relapse-free survival. Taken together, these data reveal a critical role of NLE1 in colorectal cancer growth and progression and suggest that NLE1 represents a potential therapeutic target in colorectal cancer patients.

Significance: NLE1 limits de novo protein biosynthesis and the tumorigenic potential of advanced colorectal cancer cells, suggesting NLE1 could be targeted to improve the treatment of metastatic colorectal cancer.


Figures

Figure 1. Effect of SMAD4 ablation in colorectal cancer organoids on tumor growth and gene expression. A, Mutation detection assay on genomic DNA obtained from PDTO cells edited via CRISPR/Cas9 to achieve SMAD4 KO (S4) or on a SMAD4 wild-type parental control (P). M, Marker. B, Immunoblot analysis of SMAD4 protein levels in parental SMAD4 wild-type (WT) and CRISPR/Cas9-targeted (S4-KO) PDTO lines 2 and 4. β-Actin served as a loading control. C, Enhanced focal images of 50 μL Matrigel droplets containing SMAD4 wild-type (S4-WT) or SMAD4 knockout (S4-KO) organoid lines maintained in tumor organoid culture (TOC) medium with (+TGFβ) or without (Ctrl) 20 nmol/L recombinant TGFβ1 for 7 (PDTO2) or 10 (PDTO4) days. D, ATP content measurement–based cell viability assessment (CellTiter-Glo 3D) of SMAD4 wild-type (WT) and SMAD4 knockout (S4-KO) PDTO lines maintained in TOC medium (Ctrl) or TOC medium supplemented with 20 nmol/L recombinant TGFβ1 for 7 (PDTO2) or 10 (PDTO4) days. Statistical significance between all samples was assessed by one-way ANOVA plus Tukey multiple comparisons test and is indicated by asterisks (****, P ≤ 0.0001). Shown is the mean ± SD (n = 4). E, GSEA on gene signatures derived from RNA-sequencing data generated from SMAD4 knockout versus SMAD4 wild-type colorectal cancer organoids (PDTO4S4 vs. PDTO4) maintained in TGFβ1-containing TOC medium. Shown are enrichments of the gene sets c-MYC targets V2, TGFβ signaling (MSigDB Collections, Broad Institute) and EPBH2high human colonic stem cells (HsCoSC, Jung et al., 2011). NES, normalized enrichment score; NOM P value, nominal P value; FDR-q, false discovery rate q-value. F, qRT-PCR analysis of LGR5, SMOC2, and PMEPA1 gene expression in SMAD4 wild-type (WT) and SMAD4 knockout (S4-KO) PDTO lines maintained in TOC medium (Ctrl) or TOC medium supplemented with 20 nmol/L recombinant TGFβ1 (TGFβ) for 72 hours. G, qRT-PCR analysis of NLE1 and c-MYC gene expression in SMAD4 wild-type (WT) and SMAD4 knockout (S4-KO) PDTO lines maintained in TOC medium (Ctrl) or TOC medium supplemented with 20 nmol/L recombinant TGFβ1 (TGFβ) for 72 hours. Statistical significance between all samples in F and G was assessed by ordinary two-way ANOVA plus Tukey multiple comparison test and is indicated by asterisks (***, P <0.001; ****, P ≤ 0.0001) for the PDTOS4 versus PDTO comparison in the presence of TGFβ1. Shown is the mean ± SD (n = 3).
Figure 1.
Effect of SMAD4 ablation in colorectal cancer organoids on tumor growth and gene expression. A, Mutation detection assay on genomic DNA obtained from PDTO cells edited via CRISPR/Cas9 to achieve SMAD4 KO (S4) or on a SMAD4 wild-type parental control (P). M, marker. B, Immunoblot analysis of SMAD4 protein levels in parental SMAD4 wild-type (WT) and CRISPR/Cas9-targeted (S4-KO) PDTO lines 2 and 4. β-Actin served as a loading control. C, Enhanced focal images of 50 μL Matrigel droplets containing SMAD4 wild-type (S4-WT) or SMAD4 knockout (S4-KO) organoid lines maintained in tumor organoid culture (TOC) medium with (+TGFβ) or without (Ctrl) 20 nmol/L recombinant TGFβ1 for 7 (PDTO2) or 10 (PDTO4) days. D, ATP content measurement–based cell viability assessment (CellTiter-Glo 3D) of SMAD4 wild-type and SMAD4 knockout (S4-KO) PDTO lines maintained in TOC medium (Ctrl) or TOC medium supplemented with 20 nmol/L recombinant TGFβ1 for 7 (PDTO2) or 10 (PDTO4) days. Statistical significance between all samples was assessed by one-way ANOVA plus Tukey multiple comparisons test. ****, P ≤ 0.0001. Shown is the mean ± SD (n = 4). E, GSEA on gene signatures derived from RNA-sequencing data generated from SMAD4 knockout versus SMAD4 wild-type colorectal cancer organoids (PDTO4S4 vs. PDTO4) maintained in TGFβ1-containing TOC medium. Shown are enrichments of the gene sets c-MYC targets V2, TGFβ signaling (MSigDB Collections, Broad Institute) and EPBH2high human colonic stem cells (HsCoSC; ref. 27). NES, normalized enrichment score; NOM P value, nominal P value; FDR-q, false discovery rate q value. F, qRT-PCR analysis of LGR5, SMOC2, and PMEPA1 gene expression in SMAD4 wild-type and SMAD4 knockout (S4-KO) PDTO lines maintained in TOC medium (Ctrl) or TOC medium supplemented with 20 nmol/L recombinant TGFβ1 (TGFβ) for 72 hours. G, qRT-PCR analysis of NLE1 and c-MYC gene expression in SMAD4 wild-type and SMAD4 knockout PDTO lines maintained in TOC medium (Ctrl) or TOC medium supplemented with 20 nmol/L recombinant TGFβ1 (TGFβ) for 72 hours. Statistical significance between all samples in F and G was assessed by ordinary two-way ANOVA plus Tukey multiple comparison test (***, P <0.001; ****, P ≤ 0.0001) for the PDTOS4 versus PDTO comparison in the presence of TGFβ1. Shown is the mean ± SD (n = 3).
Figure 2. Regulation of NLE1 expression by c-MYC and TGFβ signaling in colorectal cancer. A, Meta-analysis of NLE1 mRNA expression in public datasets (NCBI Gene Expression Omnibus, GEO) representing studies with c-MYC overexpression (OE, red bars) or c-MYC knockdown by RNA interference (siRNA, blue bars) in indicated cell lines. GEO accession numbers for each of the depicted experiments are indicated. B, qRT-PCR analysis of NLE1 gene expression in PDTO4 cells stably transduced with lentiviral particles encoding for a doxycycline-inducible c-MYC allele (pTz-MYC) or with a control lentivirus (pTz-Empty). Cells were left untreated or treated with either 20 nmol/L recombinant TGFβ1 (TGFβ) for 5 days alone or 500 ng/mL doxycycline was added simultaneously with 20 nmol/L recombinant TGFβ1 (βDOX) 48 hours prior to analysis. Statistical significance between all samples was assessed by ordinary two-way ANOVA plus Tukey multiple comparison test and is indicated by asterisks (****, P ≤ 0.0001). Shown is the mean ± SD (n = 3). C, Immunoblot analysis of c-MYC and NLE1 protein levels in PDTO4 cell lines described and treated as in B. Note that for pTz-MYC virus–transduced PDTOs, whole protein lysates of two independent experiments were analyzed. β-Actin served as a loading control. D, Binding of c-MYC to the NLE1 promoter region in the indicated cell lines as represented by c-MYC ChIP-seq signals. Note that the genomic NLE1 sequence covered by ChIP seq peaks contains one consensus c-MYC binding sequence (E-box, CACGTG). Numbers on the y-axis indicate ChIP-Seq reads. Source: The Encyclopedia of DNA Elements (ENCODE) Consortium. Visualization of the ChIP-seq peaks located in the NLE1 promoter region was done with the Integrative Genomics Viewer (IGV, Broad Institute). E, ChIP combined with qRT-PCR (qChIP) analysis on genomic DNA from SW620 cells. The amount of DNA immunoprecipitated with anti-MYC antibody or a rabbit IgG-control in each sample is shown as percentage of chromatin input. Note enrichment of the NLE1 gene promoter (NLE1p) amplicon in contrast to an amplicon located approximately 5 kb downstream within NLE1 (NLE1_ctrl). Amplified regions of the DKC1 and NPM1 promoters have been shown previously to contain c-MYC binding sites (Zeller et al., 2006) and served as positive controls. Statistical significance between c-MYC IgG and rabbit control IgG groups was assessed by multiple t tests corrected for multiple comparison using the Holm–Sidak method and is indicated by asterisks (**, P < 0.01; ****, P < 0.0001). Mean ± SD (n = 3). F, GSEA on NLE1 colorectal cancer gene signatures derived from GDC-TCGA-COAD plus GDC-TCGA-READ RNA-sequencing data sets (n = 638 colorectal cancer samples, see Materials and Methods for details). Shown are enrichments of c-MYC targets V1 and TGFβ signaling gene sets (MSigDB collections, Broad Institute). NES, normalized enrichment score; NOM P value, nominal P value; FDR-q, false discovery rate q-value.
Figure 2.
Regulation of NLE1 expression by c-MYC and TGFβ signaling in colorectal cancer. A, Meta-analysis of NLE1 mRNA expression in public datasets (NCBI GEO) representing studies with c-MYC overexpression (OE; red bars) or c-MYC knockdown by RNA interference (siRNA; blue bars) in indicated cell lines. GEO accession numbers for each of the depicted experiments are indicated. B, qRT-PCR analysis of NLE1 gene expression in PDTO4 cells stably transduced with lentiviral particles encoding for a doxycycline-inducible c-MYC allele (pTz-MYC) or with a control lentivirus (pTz-Empty). Cells were left untreated or treated with either 20 nmol/L recombinant TGFβ1 (TGFβ) for 5 days alone or 500 ng/mL doxycycline was added simultaneously with 20 nmol/L recombinant TGFβ1 (βDOX) 48 hours prior to analysis. Statistical significance between all samples was assessed by ordinary two-way ANOVA plus Tukey multiple comparison test. ****, P ≤ 0.0001. Shown is the mean ± SD (n = 3). n.s., nonsignificant. C, Immunoblot analysis of c-MYC and NLE1 protein levels in PDTO4 cell lines described and treated as in B. Note that for pTz-MYC virus–transduced PDTOs, whole protein lysates of two independent experiments were analyzed. β-Actin served as a loading control. D, Binding of c-MYC to the NLE1 promoter region in the indicated cell lines as represented by c-MYC ChIP-seq signals. Note that the genomic NLE1 sequence covered by ChIP seq peaks contains one consensus c-MYC binding sequence (E-box, CACGTG). Numbers on the y-axis indicate ChIP-Seq reads. Source: The Encyclopedia of DNA Elements (ENCODE) Consortium. Visualization of the ChIP-seq peaks located in the NLE1 promoter region was done with the Integrative Genomics Viewer (IGV, Broad Institute). E, ChIP combined with qRT-PCR (qChIP) analysis of genomic DNA from SW620 cells. The amount of DNA immunoprecipitated with anti-MYC antibody or a rabbit IgG-control in each sample is shown as percentage of chromatin input. Note enrichment of the NLE1 gene promoter (NLE1p) amplicon in contrast to an amplicon located approximately 5 kb downstream within NLE1 (NLE1_ctrl). Amplified regions of the DKC1 and NPM1 promoters have been shown previously to contain c-MYC binding sites (33) and served as positive controls. Statistical significance between c-MYC IgG and rabbit control IgG groups was assessed by multiple t tests corrected for multiple comparison using the Holm–Sidak method. **, P < 0.01; ****, P < 0.0001. Mean ± SD (n = 3). F, GSEA on NLE1 colorectal cancer gene signatures derived from GDC-TCGA-COAD plus GDC-TCGA-READ RNA-seq data sets (n = 638 colorectal cancer samples; see Materials and Methods for details). Shown are enrichments of c-MYC targets V1 and TGFβ signaling gene sets (MSigDB collections, Broad Institute). NES, normalized enrichment score; NOM P value, nominal P value; FDR-q, false discovery rate q value.
Figure 3. NLE1 is important for de novo protein biosynthesis in colorectal cancer cell lines and PDTOs. A, Immunoblot analysis of NLE1 protein levels in SW620 (left) and HT29 (right) cells transduced with either pLentiCRISPR-E (Empty) control lentiviral particles or lentiviral particles encoding for two different guide RNAs targeting NLE1 (NLE1g1, NLE1g2). β-Actin served as a loading control. B, Immunoblot analysis of NLE1 protein levels in PDTO4 S4KO cells (PDTO4S4) transduced with either pLentiCRISPR-E (Empty) control lentiviral particles or lentiviral particles encoding for two different guide RNAs targeting NLE1 (NLE1g1, NLE1g2). β-Actin served as a loading control. C, Representative flow cytometry plot showing OPP incorporation in SW620 Empty cells (blue), SW620 Empty cells treated with cycloheximide (CHX; gray), and SW620 NLE1 knockout cells (NLE1g1 in orange, NLE1g2 in red). D, Mean fluorescence intensity (MFI) of OPP incorporation in SW620 and HT29 control cells (EMPTY, blue), control cells treated with CHX (gray) and NLE1 knockout cells (NLE1g1 in orange, NLE1g2 in red). MFI was normalized to control cells and served as a control (relative MFI = 1.0). n = 2 replicates per cell line. E, Representative flow cytometry plot showing OPP incorporation in PDTO4S4 control organoids (Empty, blue), PDTO4S4 control organoids treated with cycloheximide (gray), and PDTO4S4 NLE1 knockout organoids (NLE1g2 in red). F, Mean fluorescence intensity (MFI) of OPP incorporation in PDTO4S4 Empty (blue), Empty treated with cycloheximide (gray) and NLE1 knockout organoids (NLE1g2 in red). MFI was normalized to Empty organoids and served as a control (relative MFI = 1.0).
Figure 3.
NLE1 is important for de novo protein biosynthesis in colorectal cancer cell lines and PDTOs. A, Immunoblot analysis of NLE1 protein levels in SW620 (left) and HT29 (right) cells transduced with either pLentiCRISPR-E (Empty) control lentiviral particles or lentiviral particles encoding for two different guide RNAs targeting NLE1 (NLE1g1, NLE1g2). β-Actin served as a loading control. B, Immunoblot analysis of NLE1 protein levels in PDTO4 SMAD4-knockout cells (PDTO4S4) transduced with either pLentiCRISPR-E (Empty) control lentiviral particles or lentiviral particles encoding for two different guide RNAs targeting NLE1 (NLE1g1, NLE1g2). β-Actin served as a loading control. C, Representative flow cytometry plot showing OPP incorporation in SW620 empty cells (blue), SW620 empty cells treated with cycloheximide (CHX; gray), and SW620 NLE1 knockout cells (NLE1g1, orange; NLE1g2, red). D, Mean fluorescence intensity (MFI) of OPP incorporation in SW620 and HT29 control cells (Empty; blue), control cells treated with cycloheximide (gray) and NLE1 knockout cells (NLE1g1, orange; NLE1g2, red). MFI was normalized to control cells and served as a control (relative MFI = 1.0). n = 2 replicates per cell line. E, Representative flow cytometry plot showing OPP incorporation in PDTO4S4 control organoids (Empty; blue), PDTO4S4 control organoids treated with cycloheximide (gray), and PDTO4S4 NLE1 knockout organoids (NLE1g2; red). F, MFI of OPP incorporation in PDTO4S4 empty cells (blue), empty-treated cells with cycloheximide (gray) and NLE1 knockout organoids (NLE1g2; red). MFI was normalized to empty organoids and served as a control (relative MFI = 1.0).
Figure 4. Effects of NLE1 ablation on growth and clonogenicity in colorectal cancer cell lines and PDTOs. A, Representative graph from xCELLigence system comparing the growth curve of SW620 Empty (black), NLE1g1 (red) and NLE1g2 (blue) cells. Statistical significance between all samples at each analyzed time point was assessed by two-way ANOVA plus Tukey multiple comparisons test and is indicated for the latest time point by asterisks (****, P ≤ 0.0001). Shown is the mean ± SD (n = 8). B, Representative images of colony formation assays performed with SW620 Empty, NLE1g1 and NLE1g2 cells (top). Colony formation of SW620 Empty (black), NLE1g1 (red) and NLE1g2 (blue) cells was quantified and normalized to Empty cells (bottom). Statistical significance between samples was assessed by an unpaired t test and is indicated by asterisks (***, P ≤ 0.001; ****, P ≤ 0.0001). Shown is the mean ± SD (n = 3). C, Representative images of soft agar assays of SW620 Empty, NLE1g1, and NLEg2 cells at day 14. Images were taken on a Nikon AZ100 zoom microscope. Scale bars, 1 mm. D, Grouped dot plot showing the number of colonies per image (from C) of soft agar assays performed with SW620 Empty (black), NLE1g1 (red), and NLE1g2 (blue) cells. Statistical significance between samples was assessed by an unpaired t test and is indicated by asterisks (****, P ≤ 0.0001). Shown is the mean ± SD (9 images taken from n = 3 replicates). E, Flow cytometry analysis of annexin-V and propidium iodide (PI) staining, which indicates apoptotic cells in SW620 Empty (black), NLE1g1 (red), and NLE1g2 (blue) cells. Bar chart shows the percentages of annexin-V and PI double positive cells. Shown is the mean ± SD (n = 2). F, Immunoblot analysis of PARP and cleaved PARP protein levels in SW620 Empty, NLE1g1 and NLE1g2 cells. β-Actin served as a loading control. G, Grouped dot plot showing the number of migrating SW620 Empty (black), NLE1g1 (red) and NLE1g2 (blue) cells in a transwell migration assay (uncoated membrane). Shown is the mean ± SD (18 images taken from n = 6 replicates). H, Grouped dot plot showing the number of invasive SW620 Empty (black), NLE1g1 (red), and NLE1g2 (blue) cells in a transwell invasion assay (Matrigel-coated membrane). Shown is the mean ± SD (18 images taken from n = 6 replicates). Statistical significance between samples in G and H was assessed by one-way ANOVA plus Dunnett multiple comparisons test and is indicated by asterisks (****, P ≤ 0.0001). I, Microscopy images of PDTO4S4 Empty, NLE1g1 and NLE1g2 organoids on day 7 after plating of 4,000 cells per Matrigel droplet. Images were taken on a Nikon AZ100 zoom microscope. Scale bars, 200 μm. J, Stacked bar chart showing the diameter distribution (in %) of PDTO4S4 Empty and NLE1g2 organoids in G. n = 300 organoids per genotype (n = 100 in 3 different Matrigel droplets) were measured and divided into groups of smaller than 50 μm, between 50 and 100 μm, and bigger than 100 μm organoid diameter. K, Number of organoids per image (from I). PDTO4S4 Empty (black) and NLE1g2 (blue) organoid lines. Statistical significance between samples was assessed by an unpaired t test and is indicated by asterisks (**, P ≤ 0.01; ***, P ≤ 0.001). Shown is the mean ± SD (n = 3). See Supplementary Fig. S3 for additional data.
Figure 4.
Effects of NLE1 ablation on growth and clonogenicity in colorectal cancer cell lines and PDTOs. A, Representative graph from xCELLigence system comparing the growth curve of SW620 empty (black), NLE1g1 (red), and NLE1g2 (blue) cells. Statistical significance between all samples at each analyzed time point was assessed by two-way ANOVA plus Tukey multiple comparisons test and is indicated for the latest time point. ****, P ≤ 0.0001. Shown is the mean ± SD (n = 8). B, Top, representative images of colony formation assays performed with SW620 empty, NLE1g1, and NLE1g2 cells. Bottom, colony formation of SW620 empty (black), NLE1g1 (red), and NLE1g2 (blue) cells was quantified and normalized to empty cells. Statistical significance between samples was assessed by an unpaired t test. ***, P ≤ 0.001; ****, P ≤ 0.0001. Shown is the mean ± SD (n = 3). C, Representative images of soft agar assays of SW620 empty, NLE1g1, and NLEg2 cells at day 14. Images were taken on a Nikon AZ100 zoom microscope. Scale bars, 1 mm. D, Grouped dot plot showing the number of colonies per image (from C) of soft agar assays performed with SW620 empty (black), NLE1g1 (red), and NLE1g2 (blue) cells. Statistical significance between samples was assessed by an unpaired t test. ****, P ≤ 0.0001. Shown is the mean ± SD (9 images taken from n = 3 replicates). E, Flow cytometry analysis of Annexin V and propidium iodide (PI) staining, which indicates apoptotic cells in SW620 empty (black), NLE1g1 (red), and NLE1g2 (blue) cells. Bar chart shows the percentages of Annexin V and propidium iodide double-positive cells. Shown is the mean ± SD (n = 2). F, Immunoblot analysis of PARP and cleaved PARP protein levels in SW620 empty, NLE1g1, and NLE1g2 cells. β-Actin served as a loading control. G, Grouped dot plot showing the number of migrating SW620 empty (black), NLE1g1 (red), and NLE1g2 (blue) cells in a transwell migration assay (uncoated membrane). Shown is the mean ± SD (18 images taken from n = 6 replicates). H, Grouped dot plot showing the number of invasive SW620 empty (black), NLE1g1 (red), and NLE1g2 (blue) cells in a transwell invasion assay (Matrigel-coated membrane). Shown is the mean ± SD (18 images taken from n = 6 replicates). Statistical significance between samples in G and H was assessed by one-way ANOVA plus Dunnett multiple comparisons test. ****, P ≤ 0.0001. I, Microscopy images of PDTO4S4 empty, NLE1g1, and NLE1g2 organoids on day 7 after plating of 4,000 cells per Matrigel droplet. Images were taken on a Nikon AZ100 zoom microscope. Scale bars, 200 μm. J, Stacked bar chart showing the diameter distribution (in percentages) of PDTO4S4 empty and NLE1g2 organoids in G. n = 300 organoids per genotype (n = 100 in three different Matrigel droplets) were measured and divided into groups of smaller than 50 μm, between 50 and 100 μm, and bigger than 100 μm organoid diameter. K, Number of organoids per image (from I). PDTO4S4 empty (black) and NLE1g2 (blue) organoid lines. Statistical significance between samples was assessed by an unpaired t test. **, P ≤ 0.01; ***, P ≤ 0.001. Shown is the mean ± SD (n = 3). See Supplementary Fig. S3 for additional data.
Figure 5. Loss of NLE1 affects p38/MAPK signaling, autophagy, and levels of reactive oxygen species in colorectal cancer cells. A, Immunoblot analysis of p38/MAPK, phospho-p38 (p-38) and phospho-SAPK/JNK in HT29 (left) and SW620 (right) cells transduced with either pLentiCRISPR-E (Empty) control lentiviral particles or lentiviral particles encoding for two different guide RNAs targeting NLE1 (NLE1g1, NLE1g2). α-Tubulin served as a loading control. B, Immunoblot analysis of the autophagy receptor protein p62 and autophagosome proteins LC3A/B in NLE1 wild-type (Empty) and NLE1 knockout (NLE1g1 and NLE1g2) HT29 (top) and SW620 (bottom) cells. β-Actin served as a loading control. C, Confocal microscopy images visualizing the indirect immunofluorescence staining of LC3B (red signal) as a surrogate for the occurrence of autophagosomes in NLE1 wild-type (Empty) and NLE1 knockout (NLE1g1 and NLE1g2) HT29 and SW620 cells. As a positive control for autophagosome accumulation, cells were treated with 50 μmol/L of the autophagy inhibitor chloroquine (CQ) 24 hours prior to analysis. D, Flow cytometry analysis of reactive oxygen species (ROS) generation in NLE1 wild-type (Empty) and NLE1 knockout (NLE1g1 and NLE1g2) HT29 and SW620 cells. As a positive control, cells were treated with the ROS-inducing agent tert-butyl hydroperoxide (+THBP) 1 hour prior to analysis. Histograms indicate cell count (normalized to mode) at different fluorescence levels originating from ROS-oxidized CellROX Green Reagent. E, Mean fluorescence intensity (MFI) of ROS-mediated CellROX oxidization in HT29 and SW620 control cells (Empty) and NLE1 knockout cells (NLE1g1 and NLE1g2). MFI was normalized to controls (relative MFI = 1.0). n = 2 replicates per cell line.
Figure 5.
Loss of NLE1 affects p38/MAPK signaling, autophagy, and levels of reactive oxygen species in colorectal cancer cells. A, Immunoblot analysis of p38/MAPK (p38), phospho-p38 (p-p38) and phospho-SAPK/JNK in HT29 (left) and SW620 (right) cells transduced with either pLentiCRISPR-E (Empty) control lentiviral particles or lentiviral particles encoding for two different guide RNAs targeting NLE1 (NLE1g1, NLE1g2). α-Tubulin served as a loading control. B, Immunoblot analysis of the autophagy receptor protein p62 and autophagosome proteins LC3A/B in NLE1 wild-type (Empty) and NLE1 knockout (NLE1g1 and NLE1g2) HT29 (top) and SW620 (bottom) cells. β-Actin served as a loading control. C, Confocal microscopy images visualizing the indirect immunofluorescence staining of LC3B (red signal) as a surrogate for the occurrence of autophagosomes in NLE1 wild-type (Empty) and NLE1 knockout (NLE1g1 and NLE1g2) HT29 and SW620 cells. As a positive control for autophagosome accumulation, cells were treated with 50 μmol/L of the autophagy inhibitor chloroquine (CQ) 24 hours prior to analysis. D, Flow cytometry analysis of ROS generation in NLE1 wild-type (Empty) and NLE1 knockout (NLE1g1 and NLE1g2) HT29 and SW620 cells. As a positive control, cells were treated with the ROS-inducing agent tert-butyl hydroperoxide (+THBP) 1 hour prior to analysis. Histograms indicate cell count (normalized to mode) at different fluorescence levels originating from ROS-oxidized CellROX Green Reagent. E, Mean fluorescence intensity (MFI) of ROS-mediated CellROX oxidization in HT29 and SW620 control cells (Empty) and NLE1 knockout cells (NLE1g1 and NLE1g2). MFI was normalized to controls (relative MFI = 1.0). n = 2 replicates per cell line.
Figure 6. NLE1 ablation reduces colorectal cancer primary tumor formation and liver metastasis in vivo. A, Schematic representation of endoscopy-guided PDTO orthotopic transplantation, colonoscopy follow-up and organ analysis of sacrificed immunodeficient (NSG) mice. At time point t = 0, the process of PDTO needle injection, as seen via the endoscope camera, is depicted while the injection bubble is about to form. Control endoscopy was performed at day 25 to control for primary tumor occurrence and size and to estimate the end point of the experiment when animals need to be sacrificed due to excessive tumor burden. Mice were sacrificed 35 days after orthotopic PDTO transplantation, colonic tumors were documented, and the liver was scrutinized for occurrence of macroscopically visible metastatic foci. B, Colonoscopy of immunodeficient mice was performed 3.5 weeks after orthotopic transplantation of NLE1 wild-type (WT) or NLE1 knockout (KO) colorectal cancer organoids into the colonic wall. Note the more pronounced protrusion of NLE1-WT tumors into the colonic lumen when compared to tumors grown from NLE1-KO PDTOs. C, Scatter plot showing the areas of primary tumors grown in the colon of xenotransplanted mice. Four mice (n = 6 primary tumors) had been transplanted with NLE1 wild-type (WT) colorectal cancer organoids and 6 mice (n = 12 primary tumors) had been transplanted with NLE1 knockout (KO, NLE1-targeting guide RNAs 1 (red dots) or 2 (blue dots) colorectal cancer organoids. All mice were sacrificed for analysis 5 weeks after xenotransplantation. Statistical significance between the NLE1-WT and NLE1-KO groups was assessed by an unpaired t test with Welch correction to account for the observed unequal SDs within the two experimental groups and is indicated by asterisks (*, P < 0.05). Shown is the mean ± SD. D, Macroscopic images of primary tumors formed in the colon of four mice orthotopically transplanted with 150 tumor organoids wild-type (WT) for NLE1 per injection site. All mice were sacrificed for analysis 5 weeks after xenotransplantation. Scale bars, 0.5 cm. E, Macroscopic images of primary tumors formed in the colon of six mice orthotopically transplanted with 150 tumor organoids knockout for NLE1 per injection site. All mice were sacrificed for analysis 5 weeks after xenotransplantation. Scale bars, 0.5 cm. F, Representative microscopy images of IHC staining of the proliferation marker MKI67 on FFPE tissue sections prepared from NLE1 wild-type (WT) and NLE1 knockout (KO) PDTO-derived primary tumors. Scale bars, 100 μm. G, Quantification of MKI67-positive tumor cells (in %) in FFPE tissue sections from NLE1 wild-type (WT, n = 4) and NLE1 knockout (KO, n = 6) primary tumors. An unpaired t test was performed to assess significance (***, P < 0.001). Shown is the mean ± SD. H, Representative microscopy images of IHC staining of the apoptosis marker cleaved caspase 3 on FFPE tissue sections prepared from NLE1 wild-type (WT) and NLE1 knockout (KO) primary tumors. Scale bars, 100 μm. I, Exemplary macroscopic images of resected livers and colorectal cancer-derived liver metastases formed in mice orthotopically transplanted with NLE1 wild-type (WT) or NLE1 knockout (KO) tumor organoids. Arrows indicate macroscopically visible liver metastasis. J, Scatter plots showing the quantification of macroscopic metastatic foci detected in the liver of mice five weeks after endoscope-guided, orthotopic transplantation of colorectal cancer organoids either wild-type (WT) or knockout [KO, NLE1-targeting guide RNAs 1 (red squares) or 2 (black squared)] for NLE1. Statistical significance between the NLE1-WT and NLE1-KO groups was assessed by an unpaired t test with Welch correction to account for the observed unequal SDs within the two experimental groups and is indicated by asterisks (**, P < 0.01). Shown is the mean ± SD.
Figure 6.
NLE1 ablation reduces colorectal cancer primary tumor formation and liver metastasis in vivo.A, Schematic representation of endoscopy-guided PDTO orthotopic transplantation, colonoscopy follow-up, and organ analysis of sacrificed immunodeficient (NSG) mice. At time point t = 0, the process of PDTO needle injection, as seen via the endoscope camera, is depicted while the injection bubble is about to form. Control endoscopy was performed at day 25 to control for primary tumor occurrence and size and to estimate the end point of the experiment when animals need to be sacrificed due to excessive tumor burden. Mice were sacrificed 35 days after orthotopic PDTO transplantation, colonic tumors were documented, and the liver was scrutinized for occurrence of macroscopically visible metastatic foci. B, Colonoscopy of immunodeficient mice was performed 3.5 weeks after orthotopic transplantation of NLE1 wild-type (WT) or NLE1 knockout (KO) colorectal cancer organoids into the colonic wall. Note the more pronounced protrusion of NLE1-WT tumors into the colonic lumen when compared to tumors grown from NLE1-KO PDTOs. C, Scatter plot showing the areas of primary tumors grown in the colon of xenotransplanted mice. Four mice (n = 6 primary tumors) had been transplanted with NLE1 wild-type (WT) colorectal cancer organoids and 6 mice (n = 12 primary tumors) had been transplanted with NLE1 knockout (NLE1-targeting guide RNAs 1 (red dots) or 2 (blue dots) colorectal cancer organoids. All mice were sacrificed for analysis 5 weeks after xenotransplantation. Statistical significance between the NLE1-WT and NLE1-KO groups was assessed by an unpaired t test with Welch correction to account for the observed unequal SDs within the two experimental groups. *, P < 0.05. Shown is the mean ± SD.D, Macroscopic images of primary tumors formed in the colon of four mice orthotopically transplanted with 150 tumor organoids wild-type for NLE1 per injection site. All mice were sacrificed for analysis 5 weeks after xenotransplantation. Scale bars, 0.5 cm. E, Macroscopic images of primary tumors formed in the colon of six mice orthotopically transplanted with 150 tumor organoids knockout for NLE1 per injection site. All mice were sacrificed for analysis 5 weeks after xenotransplantation. Scale bars, 0.5 cm. F, Representative microscopy images of IHC staining of the proliferation marker MKI67 on FFPE tissue sections prepared from NLE1 wild-type and NLE1 knockout PDTO-derived primary tumors. Scale bars, 100 μm. G, Quantification of MKI67-positive tumor cells (in percentages) in FFPE tissue sections from NLE1 wild-type (n = 4) and NLE1 knockout (n = 6) primary tumors. An unpaired t test was performed to assess significance. ***, P < 0.001. Shown is the mean ± SD. H, Representative microscopy images of IHC staining of the apoptosis marker cleaved caspase-3 on FFPE tissue sections prepared from NLE1 wild-type and NLE1 knockout primary tumors. Scale bars, 100 μm. I, Exemplary macroscopic images of resected livers and colorectal cancer–derived liver metastases formed in mice orthotopically transplanted with NLE1 wild-type or NLE1 knockout tumor organoids. Arrows, macroscopically visible liver metastasis. J, Scatter plots showing the quantification of macroscopic metastatic foci detected in the liver of mice five weeks after endoscope-guided, orthotopic transplantation of colorectal cancer organoids either wild-type or knockout [NLE1-targeting guide RNAs 1 (red squares) or 2 (black squares)] for NLE1. Statistical significance between the NLE1-WT and NLE1-KO groups was assessed by an unpaired t test with Welch correction to account for the observed unequal SDs within the two experimental groups. **, P < 0.01. Shown is the mean ± SD. CRC, colorectal cancer.
Figure 7. NLE1 mRNA levels are increased in colorectal cancer, correlate with Wnt/MYC-expressing colorectal cancer molecular subtypes, and predict patient survival. A, NLE1 gene expression analysis on human GDC TCGA-COAD plus READ datasets (FKPM-UQ data): comparison of normal human mucosa samples and tumor tissues. (****, P < 0.0001, n = 638 tumor samples and n = 51 normal mucosa samples). B, Forest plot showing fold changes of NLE1 mRNA expression between colorectal cancer tumors and matched adjacent normal colonic mucosa for indicated cohorts. Data were derived from publicly available data sets. The GEO database accession number for each analyzed data set is indicated. The number of patient-matched tumor/normal pairs is indicated in brackets. Dots represent fold changes and horizontal lines show 95% confidence intervals (CI). P values were calculated using a paired t test. C, Heatmaps showing the relative abundance of NLE1 mRNA in cancer molecular subtypes (CMS, Guinney et al., 2012) and colorectal cancer intrinsic subtypes (CRIS, Isella et al., 2017) of various publically colorectal cancer cohort data sets. The GEO database accession number for each analyzed data set is indicated. Blue coloring indicates relatively low expression and red coloring relatively high expression levels of NLE1. D, Kaplan–Meier estimate curves of overall survival from 591 patients with colorectal cancer (GDC-TCGA COAD plus READ cohorts) in relation to NLE1 gene expression (FKPM-UQ normalized data). Patients were classified according to either low (≤ 16.001, n = 140, blue line) or high (> 16.001, n = 451, red line) NLE1 FKPM-UQ expression scores. E, Kaplan–Meier estimate curves of overall survival from 577 patients with colorectal cancer (Marisa et al., 2013) in relation to NLE1 gene expression scores. Patients were classified according to either low (n = 207, blue line) or high (n = 372, red line) NLE1 expression scores. In D and E, Censored values indicate the last known follow-up time for those subjects still alive after initial diagnosis and are depicted as tick marks. F, Forest plot showing the hazard ratios (HR) for relapse-free survival of patients with colorectal cancer expressing either high or low levels of NLE1 mRNA expression in public datasets (TCGA colorectal cancer and NCBI Gene Expression Omnibus, GEO). GEO accession numbers for each of the depicted cohorts are indicated. Dots represent HRs and horizontal lines show 95% confidence intervals (CI). Log-rank P values are indicated for each analyzed data set.
Figure 7.
NLE1 mRNA levels are increased in colorectal cancer, correlate with Wnt/MYC-expressing colorectal cancer molecular subtypes, and predict patient survival. A,NLE1 gene expression analysis on human GDC TCGA-COAD plus READ datasets (FKPM-UQ data): comparison of normal human mucosa samples and tumor tissues. ****, P < 0.0001; n = 638 tumor samples and n = 51 normal mucosa samples. B, Forest plot showing fold changes of NLE1 mRNA expression between colorectal cancer tumors and matched adjacent normal colonic mucosa for indicated cohorts. Data were derived from publicly available data sets. The GEO database accession number for each analyzed data set is indicated. The number of patient-matched tumor/normal pairs is indicated in brackets. Dots represent fold changes and horizontal lines show 95% confidence intervals (CI). P values were calculated using a paired t test. C, Heatmaps showing the relative abundance of NLE1 mRNA in cancer molecular subtypes (CMS; ref. 1) and colorectal cancer intrinsic subtypes (CRIS; ref. 2) of various publicly colorectal cancer cohort data sets. The GEO database accession number for each analyzed data set is indicated. Blue, relatively low expression; red, high expression levels of NLE1. D, Kaplan–Meier estimate curves of overall survival from 591 patients with colorectal cancer (GDC-TCGA COAD plus READ cohorts) in relation to NLE1 gene expression (FKPM-UQ normalized data). Patients were classified according to either low (≤ 16.001, n = 140, blue line) or high (> 16.001, n = 451, red line) NLE1 FKPM-UQ expression scores. E, Kaplan–Meier estimate curves of overall survival from 577 patients with colorectal cancer (24) in relation to NLE1 gene expression scores. Patients were classified according to either low (n = 207; blue line) or high (n = 372; red line) NLE1 expression scores. In D and E, Censored values indicate the last known follow-up time for those subjects still alive after initial diagnosis and are depicted as tick marks. F, Forest plot showing the hazard ratios (HR) for relapse-free survival of patients with colorectal cancer expressing either high or low levels of NLE1 mRNA expression in public datasets (TCGA colorectal cancer and NCBI GEO). GEO accession numbers for each of the depicted cohorts are indicated. Dots represent HRs and horizontal lines show 95% confidence intervals (CI). Log-rank P values are indicated for each analyzed data set. CRC, colorectal cancer.
Figure 8. Effect of NLE1 loss in p53-proficient HCT116 MSI colorectal cancer cells and HCEC-1CT benign human colonic epithelial cells. A, Immunoblot analysis of NLE1, TP53, CDKN1A (p21) and cleaved caspase 3 protein levels in HCT116 TP53 wild-type (wt) and TP53 knockout (KO) cells stably transduced with either pLentiCRISPR-E (Empty) control lentivirus particles or lentiviral particles encoding for two different guide RNAs targeting NLE1 (NLE1g1, NLE1g2). β-Actin served as a loading control. B, Stacked bar chart showing the percentage of cell-cycle distribution of HCT116 TP53 wild-type (wt) and TP53 knockout (KO) cells stably transduced with either pLentiCRISPR-E (Empty) control lentiviral particles or lentiviral particles encoding for two different guide RNAs targeting NLE1 (NLE1g1, NLE1g2). Shown is the mean ± SD (n = 3). C, Quantification of apoptotic cell fractions, as assessed by annexin-V/propidium iodide (PI) staining and flow cytometry analysis, of HCT116 TP53 wild-type (wt) and TP53 knockout (KO) cells transduced with lentiviral particles encoding Cas9 and guide RNAs targeting NLE1 (left, NLE1g1; right, NLE1g2). Statistical significance was assessed by a ratio paired t test and is indicated by asterisks (*, P ≤ 0.05; **, P ≤ 0.01). Each two dots (blue-red) connected by solid lines represent independent experiments. D, Representative graph from xCELLigence system comparing the growth curve of HCEC-1CT human colonic epithelial cells stably transduced with either pLentiCRISPR-E (Empty, black) control lentiviral particles or lentiviral particles encoding for two different guide RNAs targeting NLE1 (NLE1g1 in red, NLE1g2 in blue). Statistical significance between all samples at each analyzed time point was assessed by two-way ANOVA plus Tukey multiple comparisons test and is indicated for the latest time point by asterisks (****, P value ≤ 0.0001). Shown is the mean ± SD (n = 7). E, Immunoblot analysis of NLE1, (cleaved) PARP, and cleaved caspase 3 protein levels in HCEC-1CT Empty (black), NLE1g1 (red), and NLE1g2 (blue) cells. β-Actin served as a loading control.
Figure 8.
Effect of NLE1 loss in p53-proficient HCT116 MSI colorectal cancer cells and HCEC-1CT benign human colonic epithelial cells. A, Immunoblot analysis of NLE1, TP53, CDKN1A (p21) and cleaved caspase-3 protein levels in HCT116 TP53 wild-type (wt) and TP53 knockout (KO) cells stably transduced with either pLentiCRISPR-E (Empty) control lentivirus particles or lentiviral particles encoding for two different guide RNAs targeting NLE1 (NLE1g1, NLE1g2). β-Actin served as a loading control. B, Stacked bar chart showing the percentage of cell-cycle distribution of HCT116 TP53 wild-type and TP53 knockout cells stably transduced with either pLentiCRISPR-E (Empty) control lentiviral particles or lentiviral particles encoding for two different guide RNAs targeting NLE1 (NLE1g1, NLE1g2). Shown is the mean ± SD (n = 3). C, Quantification of apoptotic cell fractions, as assessed by Annexin V/propidium iodide (PI) staining and flow cytometry analysis of HCT116 TP53 wild-type and TP53 knockout cells transduced with lentiviral particles encoding Cas9 and guide RNAs targeting NLE1 (left, NLE1g1; right, NLE1g2). Statistical significance was assessed by a ratio paired t test. *, P ≤ 0.05; **, P ≤ 0.01. Each two dots (blue-red) connected by solid lines represent independent experiments. D, Representative graph from xCELLigence system comparing the growth curve of HCEC-1CT human colonic epithelial cells stably transduced with either pLentiCRISPR-E (Empty; black) control lentiviral particles or lentiviral particles encoding for two different guide RNAs targeting NLE1 (NLE1g1, red; NLE1g2, blue). Statistical significance between all samples at each analyzed time point was assessed by two-way ANOVA plus Tukey multiple comparisons test and is indicated for the latest time point. ****, P ≤ 0.0001. Shown is the mean ± SD (n = 7). E, Immunoblot analysis of NLE1, (cleaved) PARP, and cleaved caspase-3 protein levels in HCEC-1CT Empty (black), NLE1g1 (red), and NLE1g2 (blue) cells. β-Actin served as a loading control.

References

    1. Guinney J, Dienstmann R, Wang X, de Reynies A, Schlicker A, Soneson C, et al. . The consensus molecular subtypes of colorectal cancer. Nat Med 2015;21:1350–6. - PMC - PubMed
    1. Isella C, Brundu F, Bellomo SE, Galimi F, Zanella E, Porporato R, et al. . Selective analysis of cancer-cell intrinsic transcriptional traits defines novel clinically relevant subtypes of colorectal cancer. Nat Commun 2017;8:15107. - PMC - PubMed
    1. Merlos-Suarez A, Barriga FM, Jung P, Iglesias M, Cespedes MV, Rossell D, et al. . The intestinal stem cell signature identifies colorectal cancer stem cells and predicts disease relapse. Cell Stem Cell 2011;8:511–24. - PubMed
    1. Batlle E, Clevers H. Cancer stem cells revisited. Nat Med 2017;23:1124–34. - PubMed
    1. Cortina C, Turon G, Stork D, Hernando-Momblona X, Sevillano M, Aguilera M, et al. . A genome editing approach to study cancer stem cells in human tumors. EMBO Mol Med 2017;9:869–79. - PMC - PubMed

Publication types