. 2023 Mar;89(3):1160-1172.
doi: 10.1002/mrm.29478. Epub 2022 Oct 11.

Tensor denoising of multidimensional MRI data

Affiliations

Tensor denoising of multidimensional MRI data

Jonas L Olesen et al. Magn Reson Med. 2023 Mar.

Abstract

Purpose: To develop a denoising strategy leveraging redundancy in high-dimensional data.

Theory and methods: The SNR fundamentally limits the information accessible by MRI. This limitation has been addressed by a host of denoising techniques, recently including the so-called MPPCA: principal component analysis of the signal followed by automated rank estimation, exploiting the Marchenko-Pastur distribution of noise singular values. Operating on matrices comprised of data patches, this popular approach objectively identifies noise components and, ideally, allows noise to be removed without introducing artifacts such as image blurring, or nonlocal averaging. The MPPCA rank estimation, however, relies on a large number of noise singular values relative to the number of signal components to avoid such ill effects. This condition is unlikely to be met when data patches and therefore matrices are small, for example due to spatially varying noise. Here, we introduce tensor MPPCA (tMPPCA) for the purpose of denoising multidimensional data, such as from multicontrast acquisitions. Rather than combining dimensions in matrices, tMPPCA uses each dimension of the multidimensional data's inherent tensor-structure to better characterize noise, and to recursively estimate signal components.

Results: Relative to matrix-based MPPCA, tMPPCA requires no additional assumptions, and comparing the two in a numerical phantom and a multi-TE diffusion MRI data set, tMPPCA dramatically improves denoising performance. This is particularly true for small data patches, suggesting that tMPPCA can be especially beneficial in such cases.

Conclusions: The MPPCA denoising technique can be extended to high-dimensional data with improved performance for smaller patch sizes.

Keywords: denoising; diffusion; principal component analysis; random matrix theory.


Figures

FIGURE 1
FIGURE 1
Distribution of squared singular values of a M = 30, N = 80 matrix with σ 2 = 1 Gaussian noise and P = 5 signal components with values given in the plots as black dotted vertical lines. Without loss of generality, the matrix was generated on the basis of the signal eigenvectors. The distribution of noise eigenvalues and mean perturbed signal eigenvalues were calculated from 105 noise realizations. The left panel shows the simulated distribution compared with the Marchenko‐Pastur (MP) distribution given in Equation (2) and the MP distribution modified by subtracting P from M and N. In the right panel, the x‐range is increased to encompass the true signal eigenvalues as well as the perturbed mean values of the corresponding simulated eigenvalues
FIGURE 2
FIGURE 2
Prediction and simulation of the largest and mean noise eigenvalue (squared singular value) when X contains P signal components. The prediction is according to the modified MP distribution (subtracting P from M and N in Equation [2]), and the simulated values were generated using 103 Gaussian noise (σ 2 = 1) realizations added to a matrix with signal eigenvalues equaling 10 times the upper bound λ+ of the MP distribution. The value of N = 103 is fixed, while the ratio M/N is varied approximately over its entire relevant range from 0 to 1. Each curve is associated with a fixed value for the ratio of signal components P/M
FIGURE 3
FIGURE 3
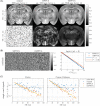
Comparison of MP principal component analysis (MPPCA) and tensor MPPCA (tMPPCA) denoising using a 10 × 10 sliding window and index ordering: voxels×TE×g^×b. A, Magnitude of original and denoised image examples. The color scale is shared for each row. The quality improvement of the recovered images from MPPCA to tMPPCA can be appreciated at large TE. The SNR gains are estimated using Equations (4) and (8), respectively. B, Examples of residual images (real part) and log of the residual distributions compared with Gaussian reference lines. The variance is relative to MPPCA: tMPPCA removes 5% ≈ 1/42–1/122 additional variance in this data set (Figure 3A). C, Example signals for single voxels located centrally in the cortex and corpus callosum. The remaining noise is not correlated along nonvoxel indices and thus immediately visible. The dashed lines indicate the Rician noise floor for the nondenoised data
FIGURE 4
FIGURE 4
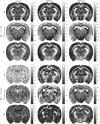
Comparison of diffusion parameter maps calculated using the subset of data with smallest/largest TE and denoised with MPPCA and tMPPCA as labeled in the figure. Abbreviation: FA, flip angle
FIGURE 5
FIGURE 5
The SNR gain from MPPCA and tMPPCA applied to a numerical phantom of multi‐TE diffusion data (6 b‐values from 0.5 to 3.0 μm2/ms, 20 gradient directions, 20 echoes from 11 to 62 ms, and SNR = 20 unless stated otherwise). A, C, The performance as a function of the number of echoes and gradient directions, respectively, using a 10 × 10 sliding window. B, The performance for varying window size and patch combination methods. Single patch refers to denoising all voxels as one patch. For patch averaging, the denoised signal of each voxel is an average over the contributions from all patches that includes the voxel. For patch center, only the result for the center voxel is used from each denoised patch. D, The performance for varying window size using data sets with different SNR and dimensions. “Half dims” refers to a smaller data set with half number of b‐values, gradient directions, and echoes. Generally, the index ordering was voxels×TE×g^×b except in the case of single‐patch denoising for which it was TE×g^×b×voxels. Abbreviation: RMSE, RMS error

References

    1. Jones DK. Diffusion MRI Theory, Methods, and Applications. Oxford University Press; 2010.
    1. Novikov DS, Fieremans E, Jespersen SN, Kiselev VG. Quantifying brain microstructure with diffusion MRI: theory and parameter estimation. NMR Biomed. 2019;32:e3998. - PMC - PubMed
    1. Jones DK. Precision and accuracy in diffusion tensor magnetic resonance imaging. Top Magn Reson Imaging. 2010;21:87‐99. - PubMed
    1. Lattanzi R, Sodickson DK. Ideal current patterns yielding optimal signal‐to‐noise ratio and specific absorption rate in magnetic resonance imaging: computational methods and physical insights. Magn Reson Med. 2012;68:286‐304. - PMC - PubMed
    1. Fan Q, Witzel T, Nummenmaa A, et al. MGH–USC human connectome project datasets with ultra‐high b‐value diffusion MRI. Neuroimage. 2016;124:1108‐1114. - PMC - PubMed

Publication types

MeSH terms