. 2022 Oct 18;3(10):100754.
doi: 10.1016/j.xcrm.2022.100754. Epub 2022 Oct 10.

Single-cell spatial transcriptomics reveals a dynamic control of metabolic zonation and liver regeneration by endothelial cell Wnt2 and Wnt9b

Affiliations

Single-cell spatial transcriptomics reveals a dynamic control of metabolic zonation and liver regeneration by endothelial cell Wnt2 and Wnt9b

Shikai Hu et al. Cell Rep Med. .

Abstract

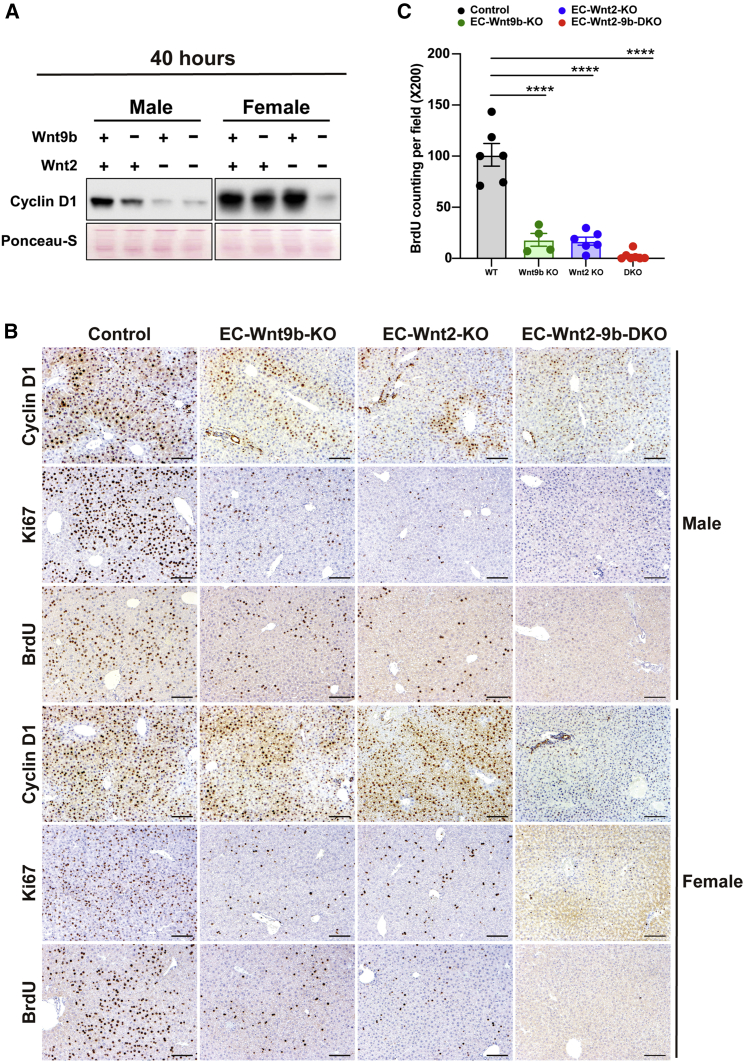
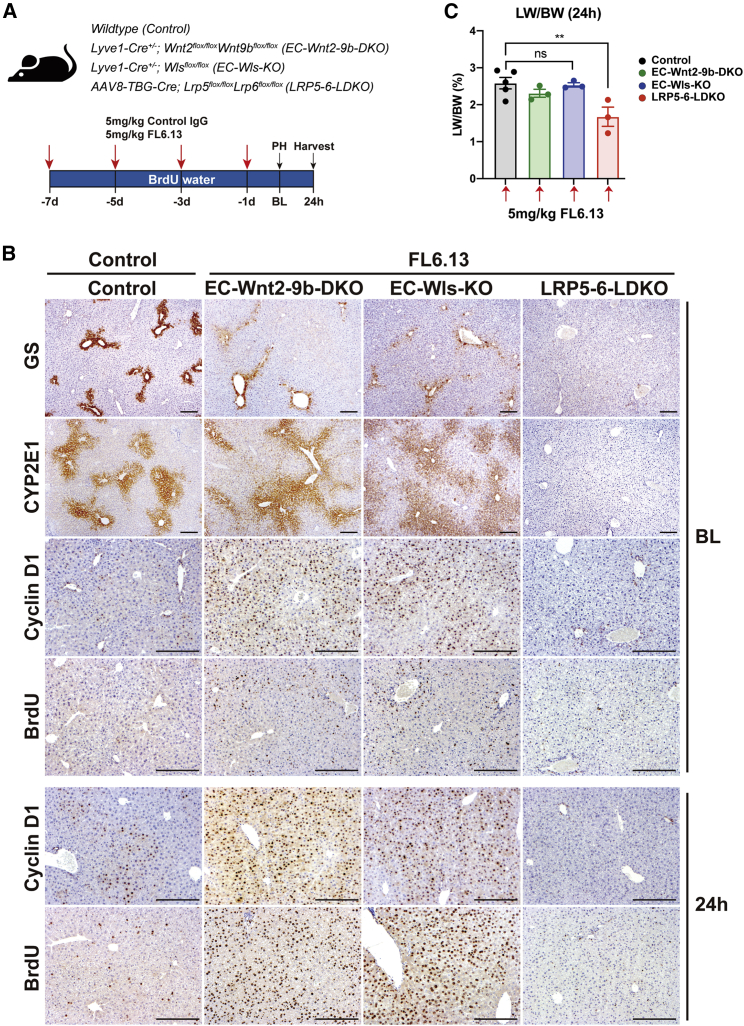
The conclusive identity of Wnts regulating liver zonation (LZ) and regeneration (LR) remains unclear despite an undisputed role of β-catenin. Using single-cell analysis, we identified a conserved Wnt2 and Wnt9b expression in endothelial cells (ECs) in zone 3. EC-elimination of Wnt2 and Wnt9b led to both loss of β-catenin targets in zone 3, and re-appearance of zone 1 genes in zone 3, unraveling dynamicity in the LZ process. Impaired LR observed in the knockouts phenocopied models of defective hepatic Wnt signaling. Administration of a tetravalent antibody to activate Wnt signaling rescued LZ and LR in the knockouts and induced zone 3 gene expression and LR in controls. Administration of the agonist also promoted LR in acetaminophen overdose acute liver failure (ALF) fulfilling an unmet clinical need. Overall, we report an unequivocal role of EC-Wnt2 and Wnt9b in LZ and LR and show the role of Wnt activators as regenerative therapy for ALF.

Keywords: Wnt signaling; acetaminophen; endothelial cells; hepatocyte; hepatocyte proliferation; liver injury; liver regeneration; metabolic zonation; repair; single cell spatial transcriptomics.


Conflict of interest statement

Declaration of interests S.P.M. is a consultant for Surrozen. L.L.B., J.J.A., S.S.S., and S.A. are shareholders of AntlerA Therapeutics.

Figures

None
Graphical abstract
Figure 1
Figure 1
Endothelial cell expression of Wnt2 and Wnt9b is evolutionarily conserved (A) Violin plots showing expression levels of WNT2 and WNT9B in human, monkey (male Cynomolgus macaques), and pig (female piglets) livers, and Wnt2 and Wnt9b in mice (C57BL/6) livers among different hepatic cell types, with highest expression evident in endothelial cells across species. Cartoons were created with BioRender.com. (B) Feature plots showing expression of Wnt2 and Wnt9b among all hepatic ECs in mice. While Wnt9b is almost exclusively expressed in central vein endothelial cells, Wnt2 is expressed more widely in both central vein endothelial cells as well as in liver sinusoidal endothelial cells (LSECs) toward zones 2 and 3. (C) Molecular Cartography showing expression in hepatocytes of Glul and Cyp2e1 (zone 3), Igfbp2 (zone 2), Cyp2f2 (zone 1), and Cldn7 (cholangiocytes), along with Wnt2 and Wnt9b, which are pericentrally zonated. CV, central vein; PV, portal vein. (D) Molecular Cartography of Wnt2 and Wnt9b along with markers of specific cell types showing Pecam1+ ECs, but not Lyz2+ macrophages or Lrat+ hepatic stellate cells are the main source of Wnt2 and Wnt9b.
Figure 2
Figure 2
EC-derived Wnt2 and Wnt9b control expression of key β-catenin target genes in the baseline liver (A) Immunohistochemistry showing zonation of representative pericentral enzyme GS, CYP2E1, and CYP1A2 in representative male and female mice from age- and sex-matched littermate controls (Control), EC-Wnt9b-KO, EC-Wnt2-KO, and EC-Wnt2-9b-DKO. Scale bars, 200 μm. (B) Representative western blot (WB) from whole liver lysate of various genotypes showing total levels of β-catenin target genes to be modestly decreased in single EC knockouts of Wnt2 and Wnt9b, but more profoundly decreased in double KOs (DKOs).
Figure 3
Figure 3
Single-cell spatial transcriptomics profiling by Molecular Cartography reveals dynamic zonation changes in EC-Wnt2-9b-DKO mice (A) UMAP plots of single-cell transcriptomic analysis of Molecular Cartography data showing genetic clusters of hepatocytes from control and EC-Wnt2-9b-DKO livers based on expression of 16 zonated genes. Seurat clustering identifies C1-C6 clusters with C1 and C2 clusters representing hepatocytes expressing pericentral (zone 3) genes, C3 representing hepatocytes expressing midzonal genes, and C4-C6 representing hepatocytes expressing periportal genes. An enrichment of C4-C6 hepatocytes is observed in the EC-Wnt2-9b-DKO cluster at the expense of C1 and C2 clusters. (B) UMAP plots using spatial location of cells in Molecular Cartography analysis based on nine arbitrary but equivalent segments manually drawn between portal vein and central vein shows various clusters recognized in (A) to represent zonal location validating the accuracy of this technique in addressing single-cell spatial transcriptomics. (C) Molecular Cartography comparing spatial gene expression of Glul, Lect2, Axin2, Cldn2, Cyp1a2, Oat, Cyp2e1, and Rgn (zone 3), and Fbp1, G6pc, Pck1, Gls2, Arg1, Ass1, Cps1, and Cyp2f2 (zone 1), and Sox9 (mostly in cholangiocytes) in control and EC-Wnt2-9b-DKO liver showing loss of zone 3 genes and overall “periportalization” of the DKO liver. CV, central vein; PV, portal vein. (D) Line plots showing impaired pericentral expression of Wnt target genes (shown here are Glul, Oat, Cyp2e1, and Axin2) in DKOs compared with control. PC, pericentral; Mid, midzonal; PP, periportal. (E) Line plots showing dynamic changes in the expression of periportal genes (shown here are Fads1, Gls2, Cps1, Elovl2, and Ass1) in DKOs compared with control. Red arrow, upregulation; green arrow, downregulation; negative, no change. Color stands for the extent of up- or downregulation. (F) Molecular Cartography depicting altered spatial expression of Ccnd1 and Igfbp2 in EC-Wnt2-9b-DKO versus control liver. While the expression of both genes is midzonal with some overlap, both genes are located pericentrally in DKOs with Ccnd1 being more restricted to hepatocytes next to the central vein. CV, central vein; PV, portal vein. (G) Line plots of three representative midzonal genes (Ccnd1, Pon1, and Igfbp2) showing altered location to pericentral hepatocytes in DKOs compared with control. The hue around line plots represents SEM.
Figure 4
Figure 4
Hepatic EC-derived Wnt2 and Wnt9b contribute to normal liver regeneration after partial hepatectomy (A) A representative WB showing notably lower cyclin D1 level at 40 h post PH, especially in males in single KO of endothelial cell Wnt2 and Wnt9b, but a more profound decrease is evident in DKOs in both sexes. (B) IHC for cyclin D1 shows decreased staining at 40 h post PH in male EC-Wnt2-KO, EC-Wnt9b-KO, and EC-Wnt2-9b-DKO mice. Staining for markers of proliferation, such as Ki67 and BrdU, were concurrently decreased in EC-Wnt2-KO and EC-Wnt9b-KO, and almost absent in EC-Wnt2-9b-DKO. In females, cyclin D1 was not changed at 40 h in single KO but was notably decreased in DKOs. Despite no difference in cyclin D1, both Ki67 and BrdU were decreased in single and almost absent in DKOs showing impairment of proliferation. Scale bars, 100 μm. (C) Quantification of BrdU-positive hepatocytes per field (200×) at 40 h. Both males and females were included. The bars represent means ± SEM, ∗∗∗∗p < 0.0001. n = 6, 4, 6, and 7 mice.
Figure 5
Figure 5
FL6.13 rescues liver zonation and liver regeneration in mice lacking Wnt secretion, specifically Wnt2 and Wnt9b from the endothelial cells, but not in mice lacking Wnt co-receptors LRP5-6 from hepatocytes (A) Study design showing dosing schedule of pan-Frizzled agonist FL6.13 or isotype control IgG administration to various mouse groups. (B) Representative IHC for β-catenin pericentral targets GS and CYP2E1, midzonal target cyclin D1, and indicator of cell proliferation BrdU, in baseline livers after four treatments of control mice with control IgG and four treatments of EC-Wnt2-9b-DKO, EC-Wls-KO, and LRP5-6-LDKO mice with FL6.13. Re-appearance of these markers to almost control levels is seen in EC-Wnt2-9b-DKO and EC-Wls-KO mice but not in LRP5-6-LDKO mice. Scale bars, 200 μm. (C) Bar graph for LW/BW (± SEM) at 24 h post PH shows comparable liver restoration in FL6.13-treated controls, EC-Wnt2-9b-DKO, and EC-Wls-KO mice, but not LRP5-6-LDKO mice. n.s., not significant, ∗∗p < 0.01. n = 5, 3, 3, 3 mice).
Figure 6
Figure 6
Single-cell spatial transcriptomics profiling of FL6.13-treated control mice reveals dynamic changes in zonation and promotes regeneration after partial hepatectomy (A) UMAP plots of single-cell transcriptomic analysis of hepatocytes by Molecular Cartography showing gain of specific clusters in FL6.13-treated livers. (B) Stacked bar chart depicting distribution of various hepatocyte clusters showing specific gain of C3 and C4 after FL6.13 treatment (right bar) compared with controls (left bar). (C) Feature plots from Molecular Cartography analysis of specific representative genes showing ectopic expression of pericentral genes (Lect2, Cyp2e1, Rgn) in midzonal and periportal cluster after FL6.13 treatment (red) compared with controls (blue), while periportal genes (G6pc, Arg1, Atp5a1) continued to be expressed in these clusters and hence remained unchanged. (D) Molecular Cartography visualization of tissue section of the same genes as indicated in (C) showing ectopic expression of pericentral genes in midzonal and periportal regions, while periportal genes were unchanged after FL6.13 treatment. PC, pericentral; PP, periportal. (E) qPCR using bulk mRNA from livers of controls or FL6.13-treated mice shows significant increase in the expression of several pericentral Wnt target genes by FL6.13. ∗p < 0.05, ∗∗p < 0.01, ∗∗∗p < 0.001, ∗∗∗∗p < 0.0001. n = 6, 5 mice. (F) qPCR using bulk mRNA from livers of controls or FL6.13-treated mice shows no statistically significant effect on expression of several known periportal genes by FL6.13. Corresponding p values are indicated. n = 6, 5 mice. (G) Representative IHC verify ectopic localization of CYP2E1 and RGN proteins in midzonal and periportal regions after FL6.13 treatment, while CYP2F2 and PIGR protein locations remained unchanged. PV, portal vein. Scale bars, 200 μm. (H) Representative qPCR using whole-liver RNA and WB using whole-liver lysate shows dramatic increase in Ccnd1 expression and cyclin D1 protein after FL6.13 treatment compared with controls. qPCR: n = 6, 5 mice. (I) Violin plot of Seurat clustering of the Molecular Cartography from (A) shows appearance of periportal Ccnd1 expression (C4 and C5 clusters; green) while its expression in C2 and C3 clusters, where it is normally expressed in controls (red), remains unchanged after FL6.13 treatment. (J) Representative IHC for cyclin D1 and BrdU showing FL6.13 induces periportal hepatocyte G1 to S-phase transition and hepatocyte proliferation, respectively, compared with controls. Scale bars, 100 μm. (K) Quantification of BrdU-positive hepatocytes (± SEM) in (J) shows that FL6.13 induces significant increase in hepatocyte proliferation at baseline compared with control IgG. ∗∗∗∗p < 0.0001. n = 6, 6 mice. (L) Representative IHC showing that FL6.13 accelerates liver regeneration at 24 h post PH by promoting the number of cyclin D1-positive periportal and midzonal hepatocytes and concurrently increasing BrdU-positive proliferating periportal and midzonal hepatocytes compared with control IgG treatment. Scale bars, 100 μm. (M) Quantification of BrdU-positive hepatocytes (± SEM) in (L) shows that FL6.13 induces significant increase in hepatocyte proliferation at 24 h post hepatectomy compared with control IgG treatment. ∗∗∗∗p < 0.0001. n = 6, 9 mice. (N) LW/BW (± SEM) at 24 h post PH depicts an advantage of liver mass restoration in the FL6.13 versus control IgG-treated group. ∗p < 0.05. n = 6, 5 mice.
Figure 7
Figure 7
Late treatment with FL6.13 promotes liver repair after APAP injury through induction of hepatocyte proliferation (A) Study design showing administration of a single dose of 5 mg/kg pan-FZD agonist FL6.13 or isotype control IgG at 32 h post 600 mg/kg i.p. APAP injection. Mice were sacrificed at 60 h for analysis. (B) Gross images of livers from FL6.13- and control IgG-treated groups after APAP showing decreased necrosis and congestion at 60 h in the FL6.13 treatment group. (C) Serum ALT, AST, direct and total bilirubin, and ALP levels (± SEM) at 60 h after APAP showing significantly reduced serum ALT and AST (trending favorably) in FL6.13 compared with control IgG. n.s., not significant, ∗p < 0.05. n = 5, 4 mice. (D) Representative IHC showing decreased necrotic areas by hematoxylin and eosin (H&E) staining, pan-lobular cyclin D1 staining, increased periportal cell proliferation by Ki67 staining, and a more localized immune cell response by CD45 staining after FL6.13 treatment compared with control IgG. CV, central vein; PV, portal vein. Scale bars, 200 μm. (E) Quantification of H&E and Ki67 showing significant decrease in necrotic areas and increase in hepatocyte proliferation in the FL6.13 group. ∗∗p < 0.01. Necrotic area: n = 5, 4 mice. Ki67: n = 4, 4 mice.

References

    1. Clevers H., Loh K.M., Nusse R. Stem cell signaling. An integral program for tissue renewal and regeneration: Wnt signaling and stem cell control. Science. 2014;346:1248012. doi: 10.1126/science.1248012. - DOI - PubMed
    1. Russell J.O., Monga S.P. Wnt/beta-Catenin signaling in liver development, homeostasis, and pathobiology. Annu. Rev. Pathol. 2018;13:351–378. doi: 10.1146/annurev-pathol-020117-044010. - DOI - PMC - PubMed
    1. Burke Z.D., Reed K.R., Phesse T.J., Sansom O.J., Clarke A.R., Tosh D. Liver zonation occurs through a beta-catenin-dependent, c-Myc-independent mechanism. Gastroenterology. 2009;136:2316–2324.e1-3. doi: 10.1053/j.gastro.2009.02.063. - DOI - PubMed
    1. Benhamouche S., Decaens T., Godard C., Chambrey R., Rickman D.S., Moinard C., Vasseur-Cognet M., Kuo C.J., Kahn A., Perret C., Colnot S. Apc tumor suppressor gene is the "zonation-keeper" of mouse liver. Dev. Cell. 2006;10:759–770. doi: 10.1016/j.devcel.2006.03.015. - DOI - PubMed
    1. Hu S., Monga S.P. Wnt/-Catenin signaling and liver regeneration: circuit, Biology, and opportunities. Gene Expr. 2021;20:189–199. doi: 10.3727/105221621X16111780348794. - DOI - PMC - PubMed

Publication types