Randomized Controlled Trial
. 2022 Oct 18;3(10):100777.
doi: 10.1016/j.xcrm.2022.100777. Epub 2022 Oct 10.

Time-restricted eating with or without low-carbohydrate diet reduces visceral fat and improves metabolic syndrome: A randomized trial

Affiliations
Randomized Controlled Trial

Time-restricted eating with or without low-carbohydrate diet reduces visceral fat and improves metabolic syndrome: A randomized trial

Mingqian He et al. Cell Rep Med. .

Abstract

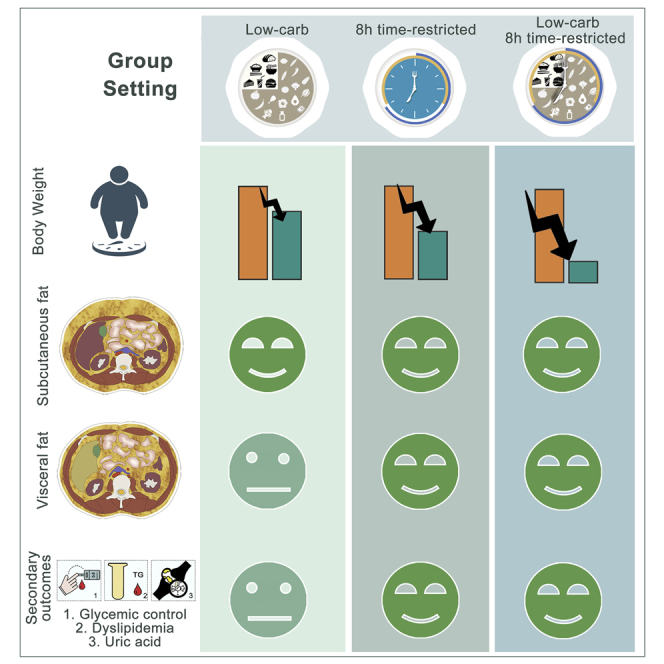
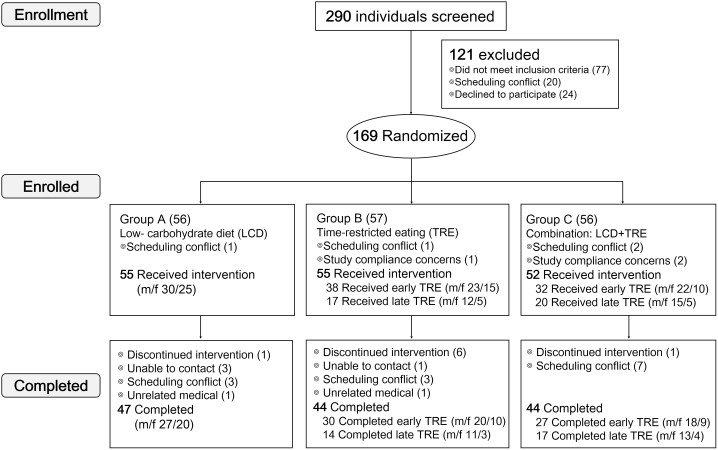
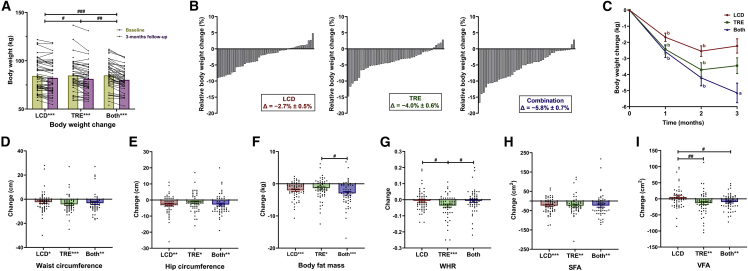
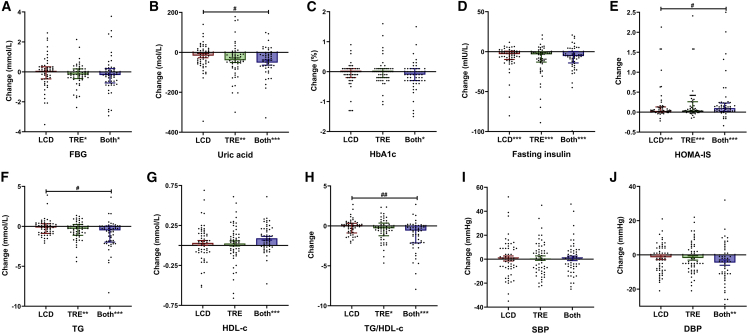
Overconsumption of carbohydrate-rich food combined with adverse eating patterns contributes to the increasing incidence of metabolic syndrome (MetS) in China. Therefore, we conducted a randomized trial to determine the effects of a low-carbohydrate diet (LCD), an 8-h time-restricted eating (TRE) schedule, and their combination on body weight and abdominal fat area (i.e., primary outcomes) and cardiometabolic outcomes in participants with MetS. Compared with baseline, all 3-month treatments significantly reduce body weight and subcutaneous fat area, but only TRE and combination treatment reduce visceral fat area (VFA), fasting blood glucose, uric acid (UA), and dyslipidemia. Furthermore, compared with changes of LCD, TRE and combination treatment further decrease body weight and VFA, while only combination treatment yields more benefits on glycemic control, UA, and dyslipidemia. In conclusion, without change of physical activity, an 8-h TRE with or without LCD can serve as an effective treatment for MetS (ClinicalTrials.gov: NCT04475822).

Keywords: abdominal obesity; low-carbohydrate diet; metabolic syndrome; time-restricted eating; visceral fat area.


Conflict of interest statement

Declaration of interests The authors declare no competing interests.

Figures

None
Graphical abstract
Figure 1
Figure 1
Trial profile A total of 290 individuals were screened, and 77 were excluded because they did not meet one or more inclusion criteria. A total of 169 participants were randomized into the low-carbohydrate diet (LCD) group (n = 56), the 8-h time-restricted eating (TRE) group (n = 57), or the combination group (n = 56), and 162 participants received a diet intervention. During the 3 months of intervention, eight participants (LCD group, n = 1; TRE group, n = 6; combination group, n = 1) discontinued diet intervention due to lack of motivation or inability to stick to the diet. At the end of the 3-month trial, 47 participants (m/f 27/20) completed the LCD treatment, 44 participants (m/f 31/13) completed the TRE treatment (30 [m/f 20/10] completed early TRE, and 14 [11/3] completed late TRE), and 44 participants (m/f 31/13) completed the combination treatment (27 [m/f 18/9] completed early TRE, and 17 [13/4] completed late TRE).
Figure 2
Figure 2
Body weight and body composition change (A and B) Body weight change (A), relative body weight change (B) for the low-carbohydrate diet (LCD), 8-h time-restricted eating (TRE), and combination treatment (Both) groups during the 3-month intervention period. (C–I) Mean decrease in (C) body weight after 1, 2, and 3 months among three groups. Change in (D) waist circumstance, (E) hip circumstance, (F) body fat mass, (G) waist-to-hip ratio (WHR), (H) subcutaneous fat area (SFA), (I) visceral fat area (VFA) among three groups after 3 months of the intervention. For (A) and (D)–(I), analyses were conducted using all participants (intention-to-treat) using a linear mixed model with randomized dietary intervention as factor to correct for the correlations of repeated measurements on changes in body weight and using a multiple imputation approach for other missing data. Each black data point represents an individual participant (LCD, n = 55; TRE, n = 55; Both, n = 52). Change from baseline is presented as mean ± standard error of the mean (SEM). #p < 0.05, ##p < 0.01, ###p < 0.001: pairwise comparisons of change scores between the groups (e.g., TRE versus LCD, TRE versus Both, LCD versus Both) were evaluated by t test or Mann-Whitney U test. ∗p < 0.05, ∗∗p < 0.01, ∗∗∗p < 0.001: significant differences shown at x axis compared with baseline (paired t test or paired Wilcoxon test). For (B), each column represents relative body weight change for each participant. For (C), change from baseline is presented as mean ± SEM, ap < 0.05, bp < 0.001: significant differences compared with 1 month before (paired t test).
Figure 3
Figure 3
Change in metabolic factors among three groups (A–J) Change in (A) fasting blood glucose (FBG), (B) uric acid, (C) hemoglobin A1c (HbA1c), (D) fasting insulin, (E) homeostasis model assessment-IS (HOMA-IS), (F) triglycerides (TG), (G) high-density lipoprotein cholesterol (HDL-c), (H) triglycerides/high-density lipoprotein cholesterol (TG/HDL-c), (I) systolic blood pressure (SBP), and (J) diastolic blood pressure (DBP) among the low-carbohydrate diet (LCD), 8-h time-restricted eating (TRE), and combination treatment (Both) groups after 3 months of the intervention. Analyses were conducted using all participants (intention-to-treat), using a multiple imputation approach for other missing data. Each black data point represents an individual participant (LCD, n = 55; TRE, n = 55; Both, n = 52). Change from baseline is presented as mean ± standard error of the mean (SEM) for normally distributed variables or the median (interquartile range) for abnormal distribution. #p < 0.05, ##p < 0.01, ###p < 0.001: pairwise comparisons of change scores between the groups (e.g., TRE versus LCD, TRE versus Both, LCD versus Both) were evaluated by t test or Mann-Whitney U test. ∗p < 0.05, ∗∗p < 0.01, ∗∗∗p < 0.001: significant differences shown at x axis compared with baseline (paired t test or paired Wilcoxon test).

References

    1. Sperling L.S., Mechanick J.I., Neeland I.J., Herrick C.J., Després J.P., Ndumele C.E., Vijayaraghavan K., Handelsman Y., Puckrein G.A., Araneta M.R.G., et al. The CardioMetabolic health alliance: working toward a new care model for the metabolic syndrome. J. Am. Coll. Cardiol. 2015;66:1050–1067. - PubMed
    1. Alberti K.G.M.M., Eckel R.H., Grundy S.M., Zimmet P.Z., Cleeman J.I., Donato K.A., Fruchart J.C., James W.P.T., Loria C.M., Smith S.C., Jr., et al. Harmonizing the metabolic syndrome: a joint interim statement of the international diabetes federation task force on epidemiology and prevention; national heart, lung, and blood institute; American heart association; world heart federation; international atherosclerosis society; and international association for the study of obesity. Circulation. 2009;120:1640–1645. - PubMed
    1. Wilson P.W.F., D'Agostino R.B., Parise H., Sullivan L., Meigs J.B. Metabolic syndrome as a precursor of cardiovascular disease and type 2 diabetes mellitus. Circulation. 2005;112:3066–3072. - PubMed
    1. Li Y., Teng D., Shi X., Qin G., Qin Y., Quan H., Shi B., Sun H., Ba J., Chen B., et al. Prevalence of diabetes recorded in mainland China using 2018 diagnostic criteria from the American Diabetes Association: national cross sectional study. BMJ. 2020;369:m997. - PMC - PubMed
    1. Zhao D., Liu J., Wang M., Zhang X., Zhou M. Epidemiology of cardiovascular disease in China: current features and implications. Nat. Rev. Cardiol. 2019;16:203–212. - PubMed

Publication types

Associated data