Review
. 2022 Oct 10;40(10):1095-1110.
doi: 10.1016/j.ccell.2022.09.012.

Artificial intelligence for multimodal data integration in oncology

Affiliations
Review

Artificial intelligence for multimodal data integration in oncology

Jana Lipkova et al. Cancer Cell. .

Abstract

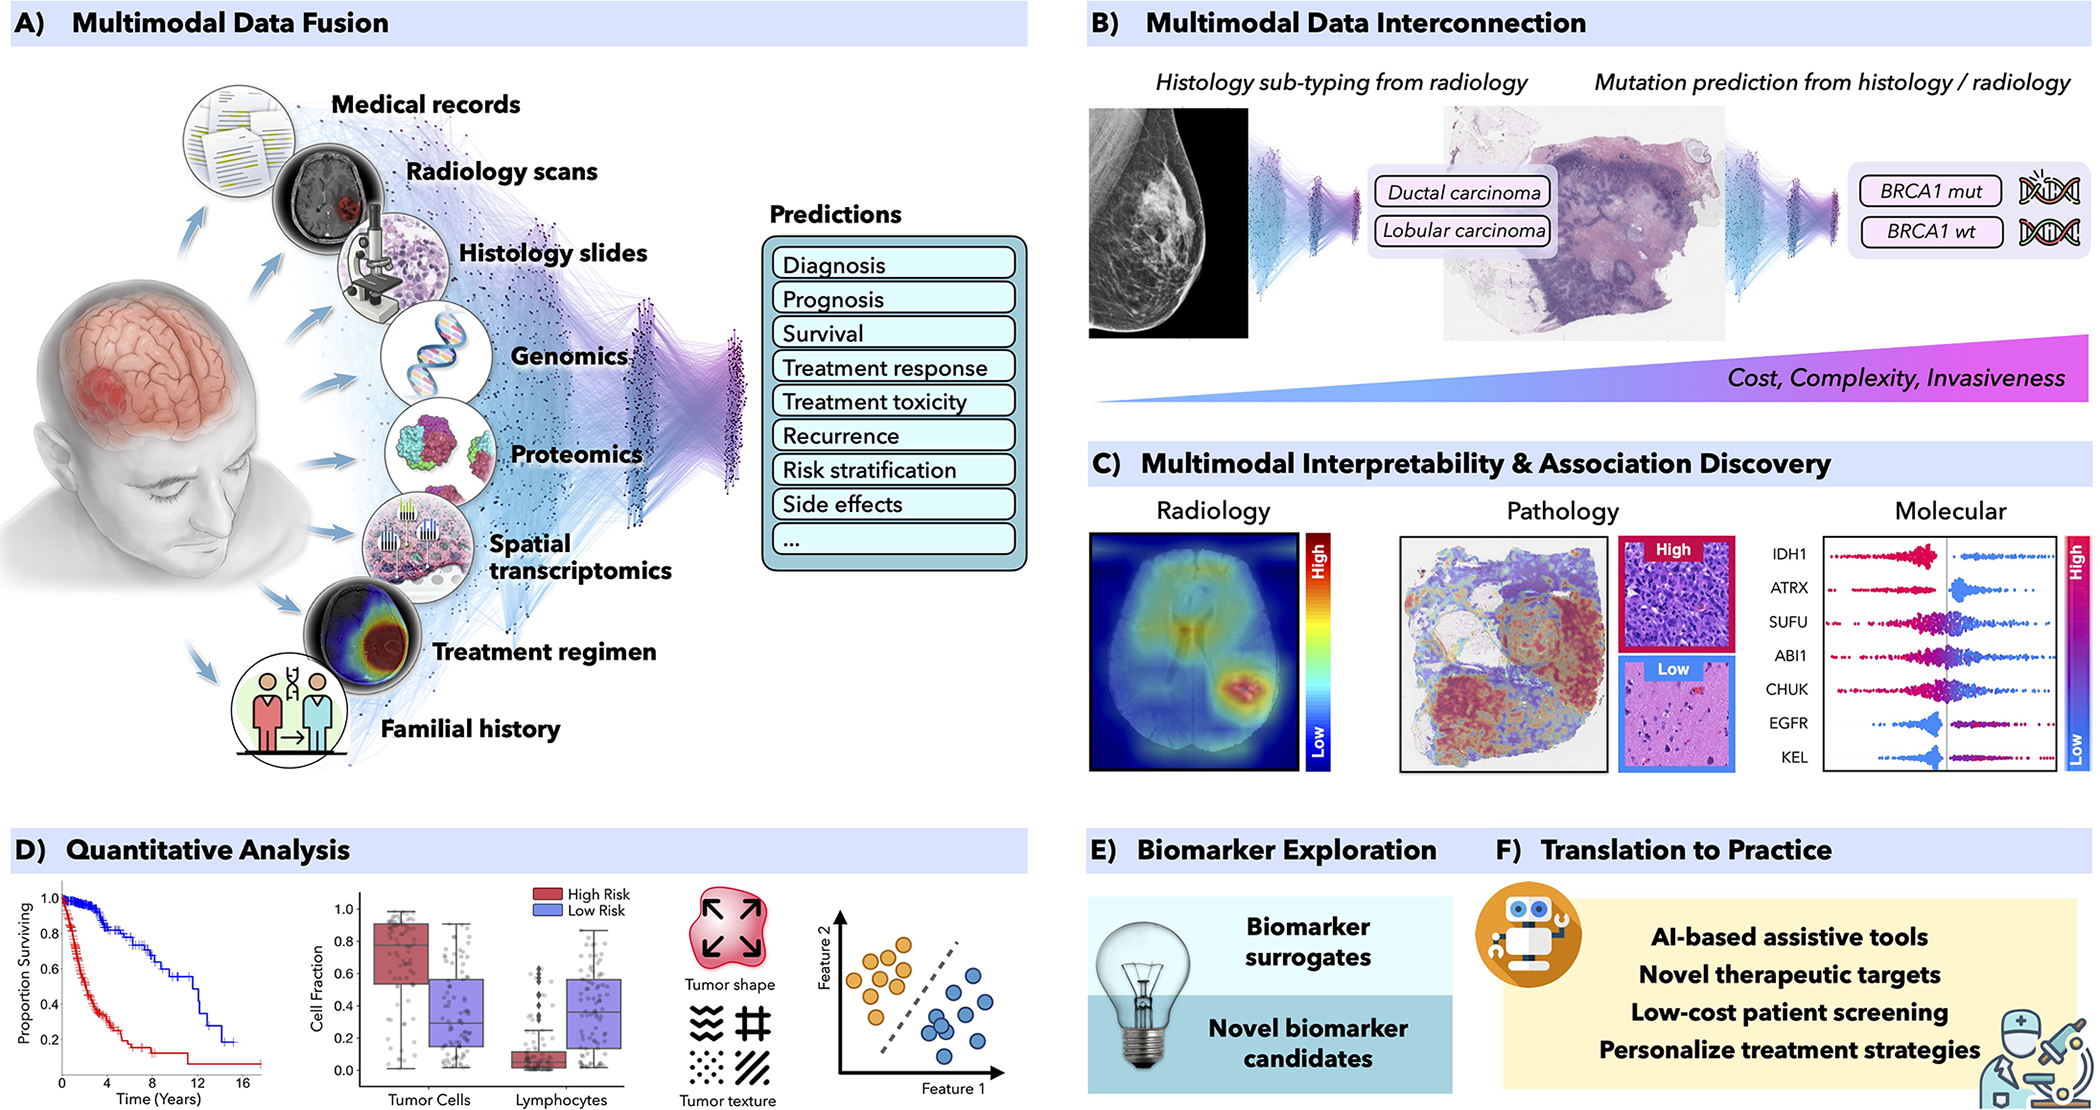
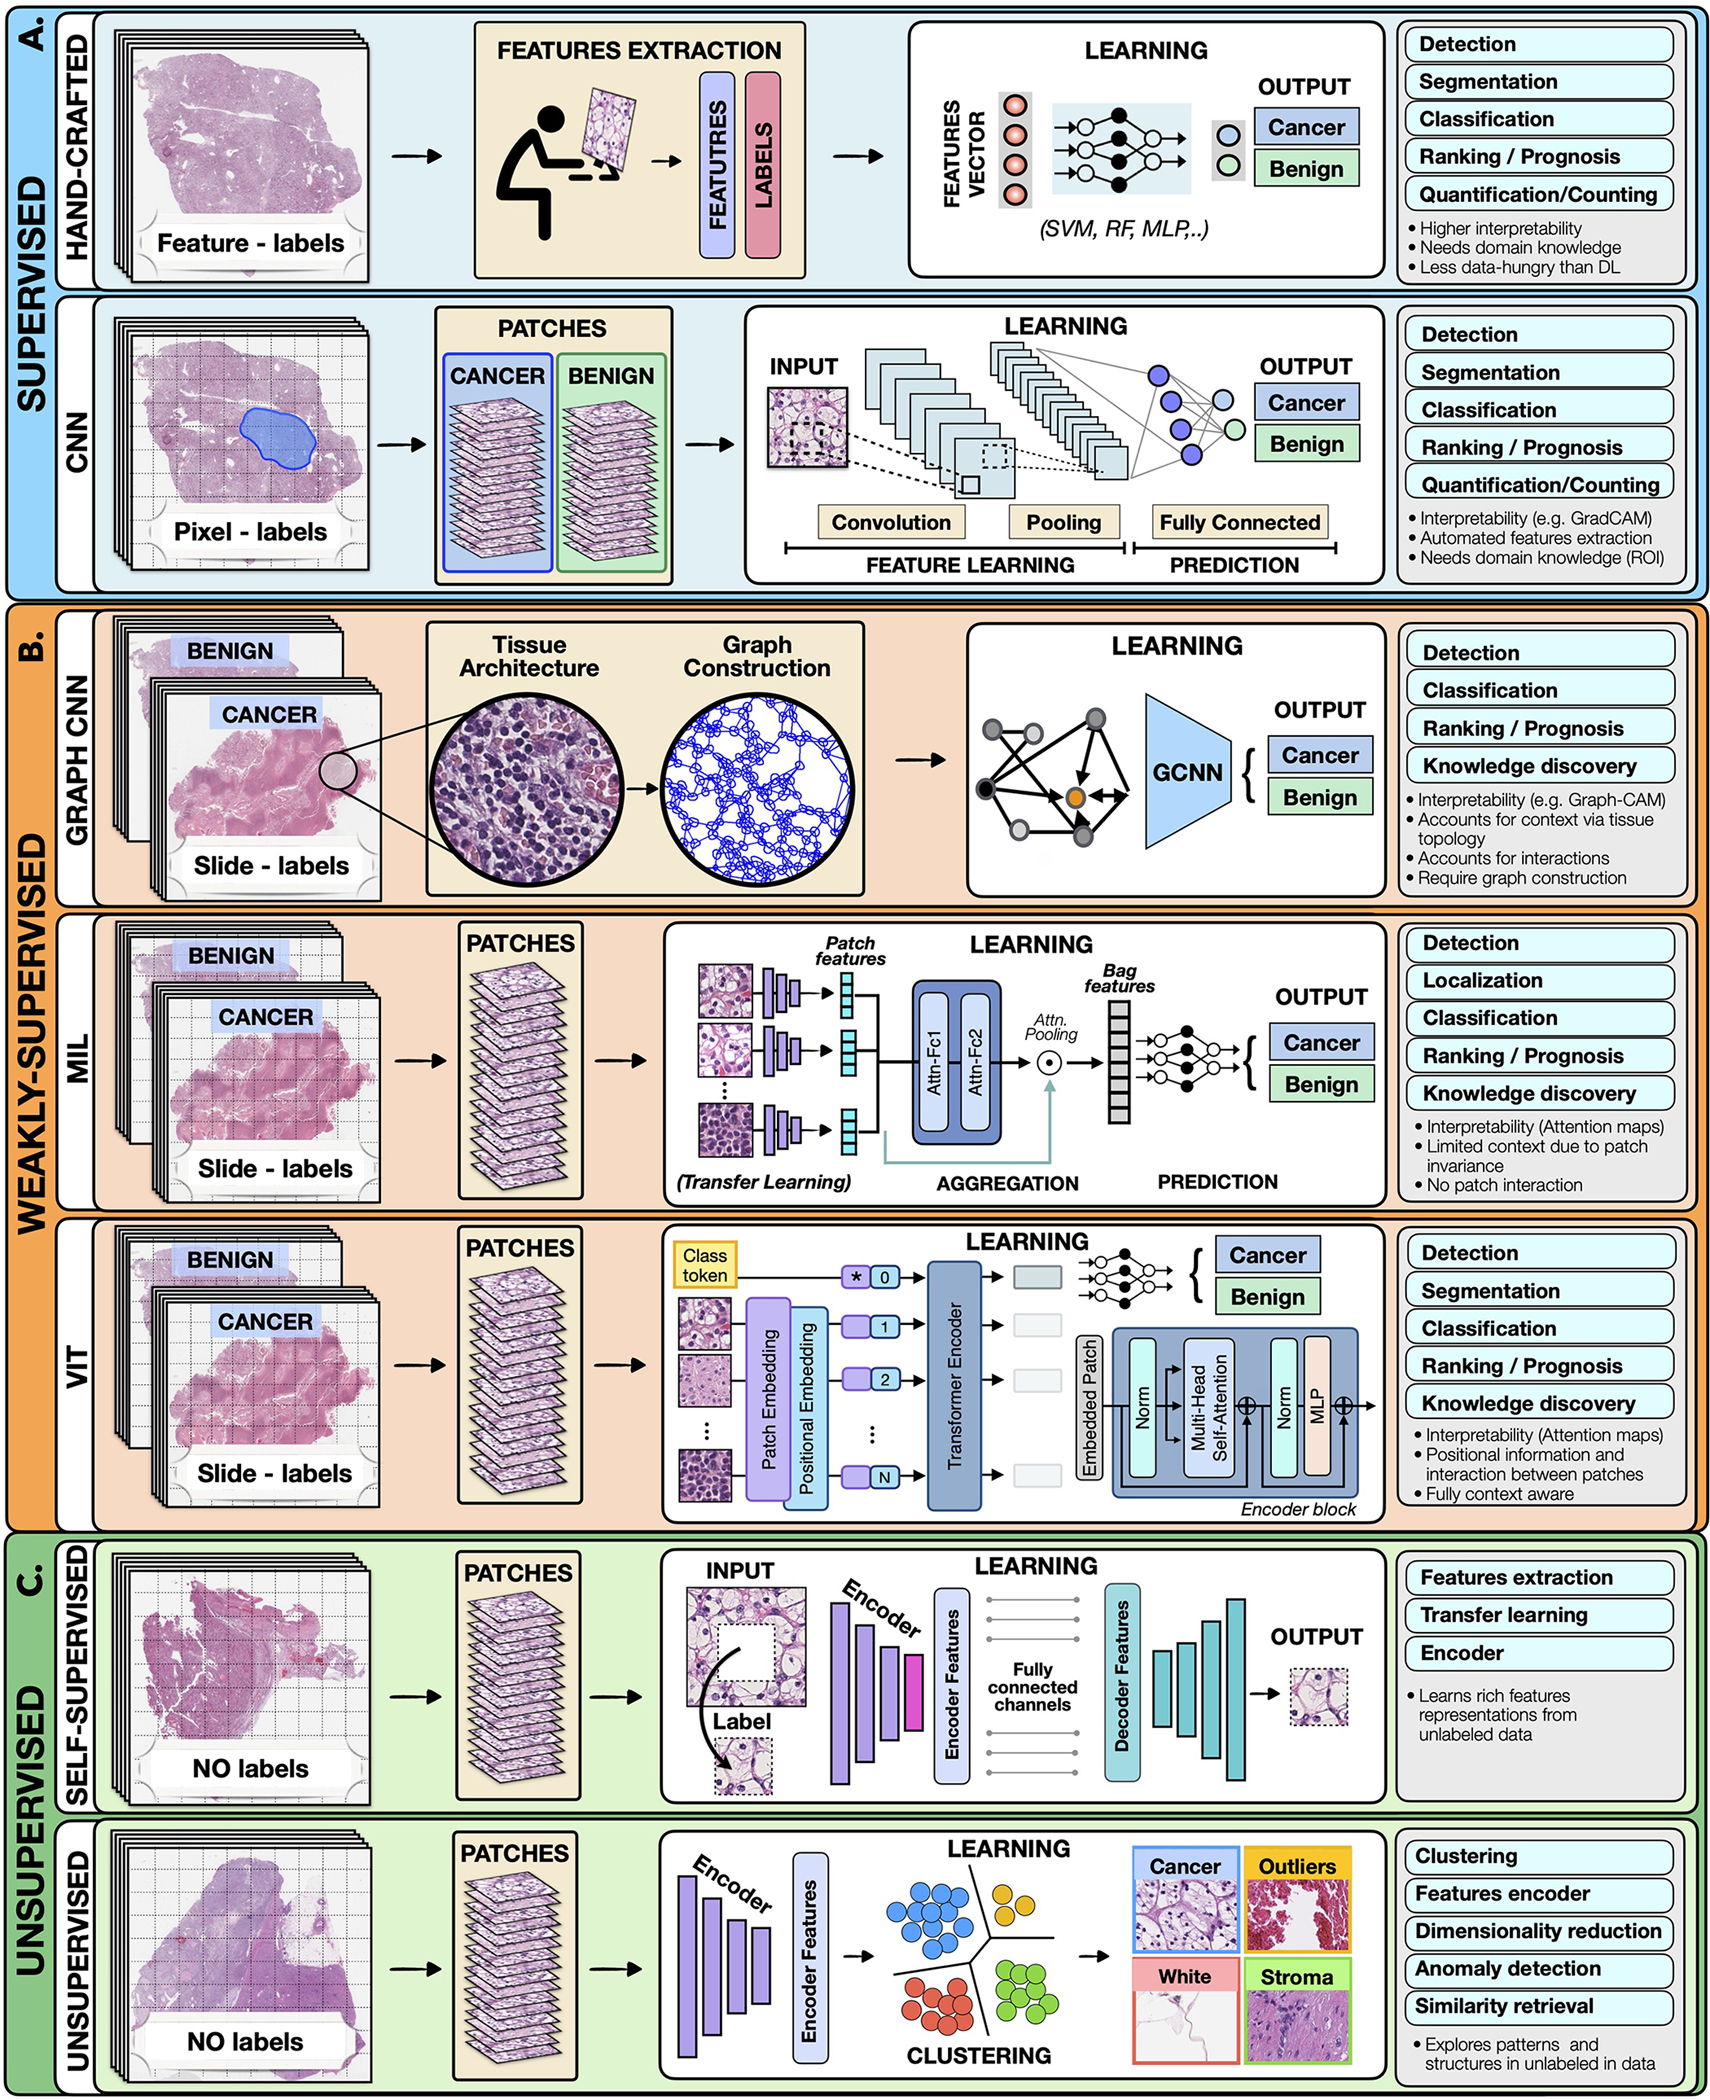
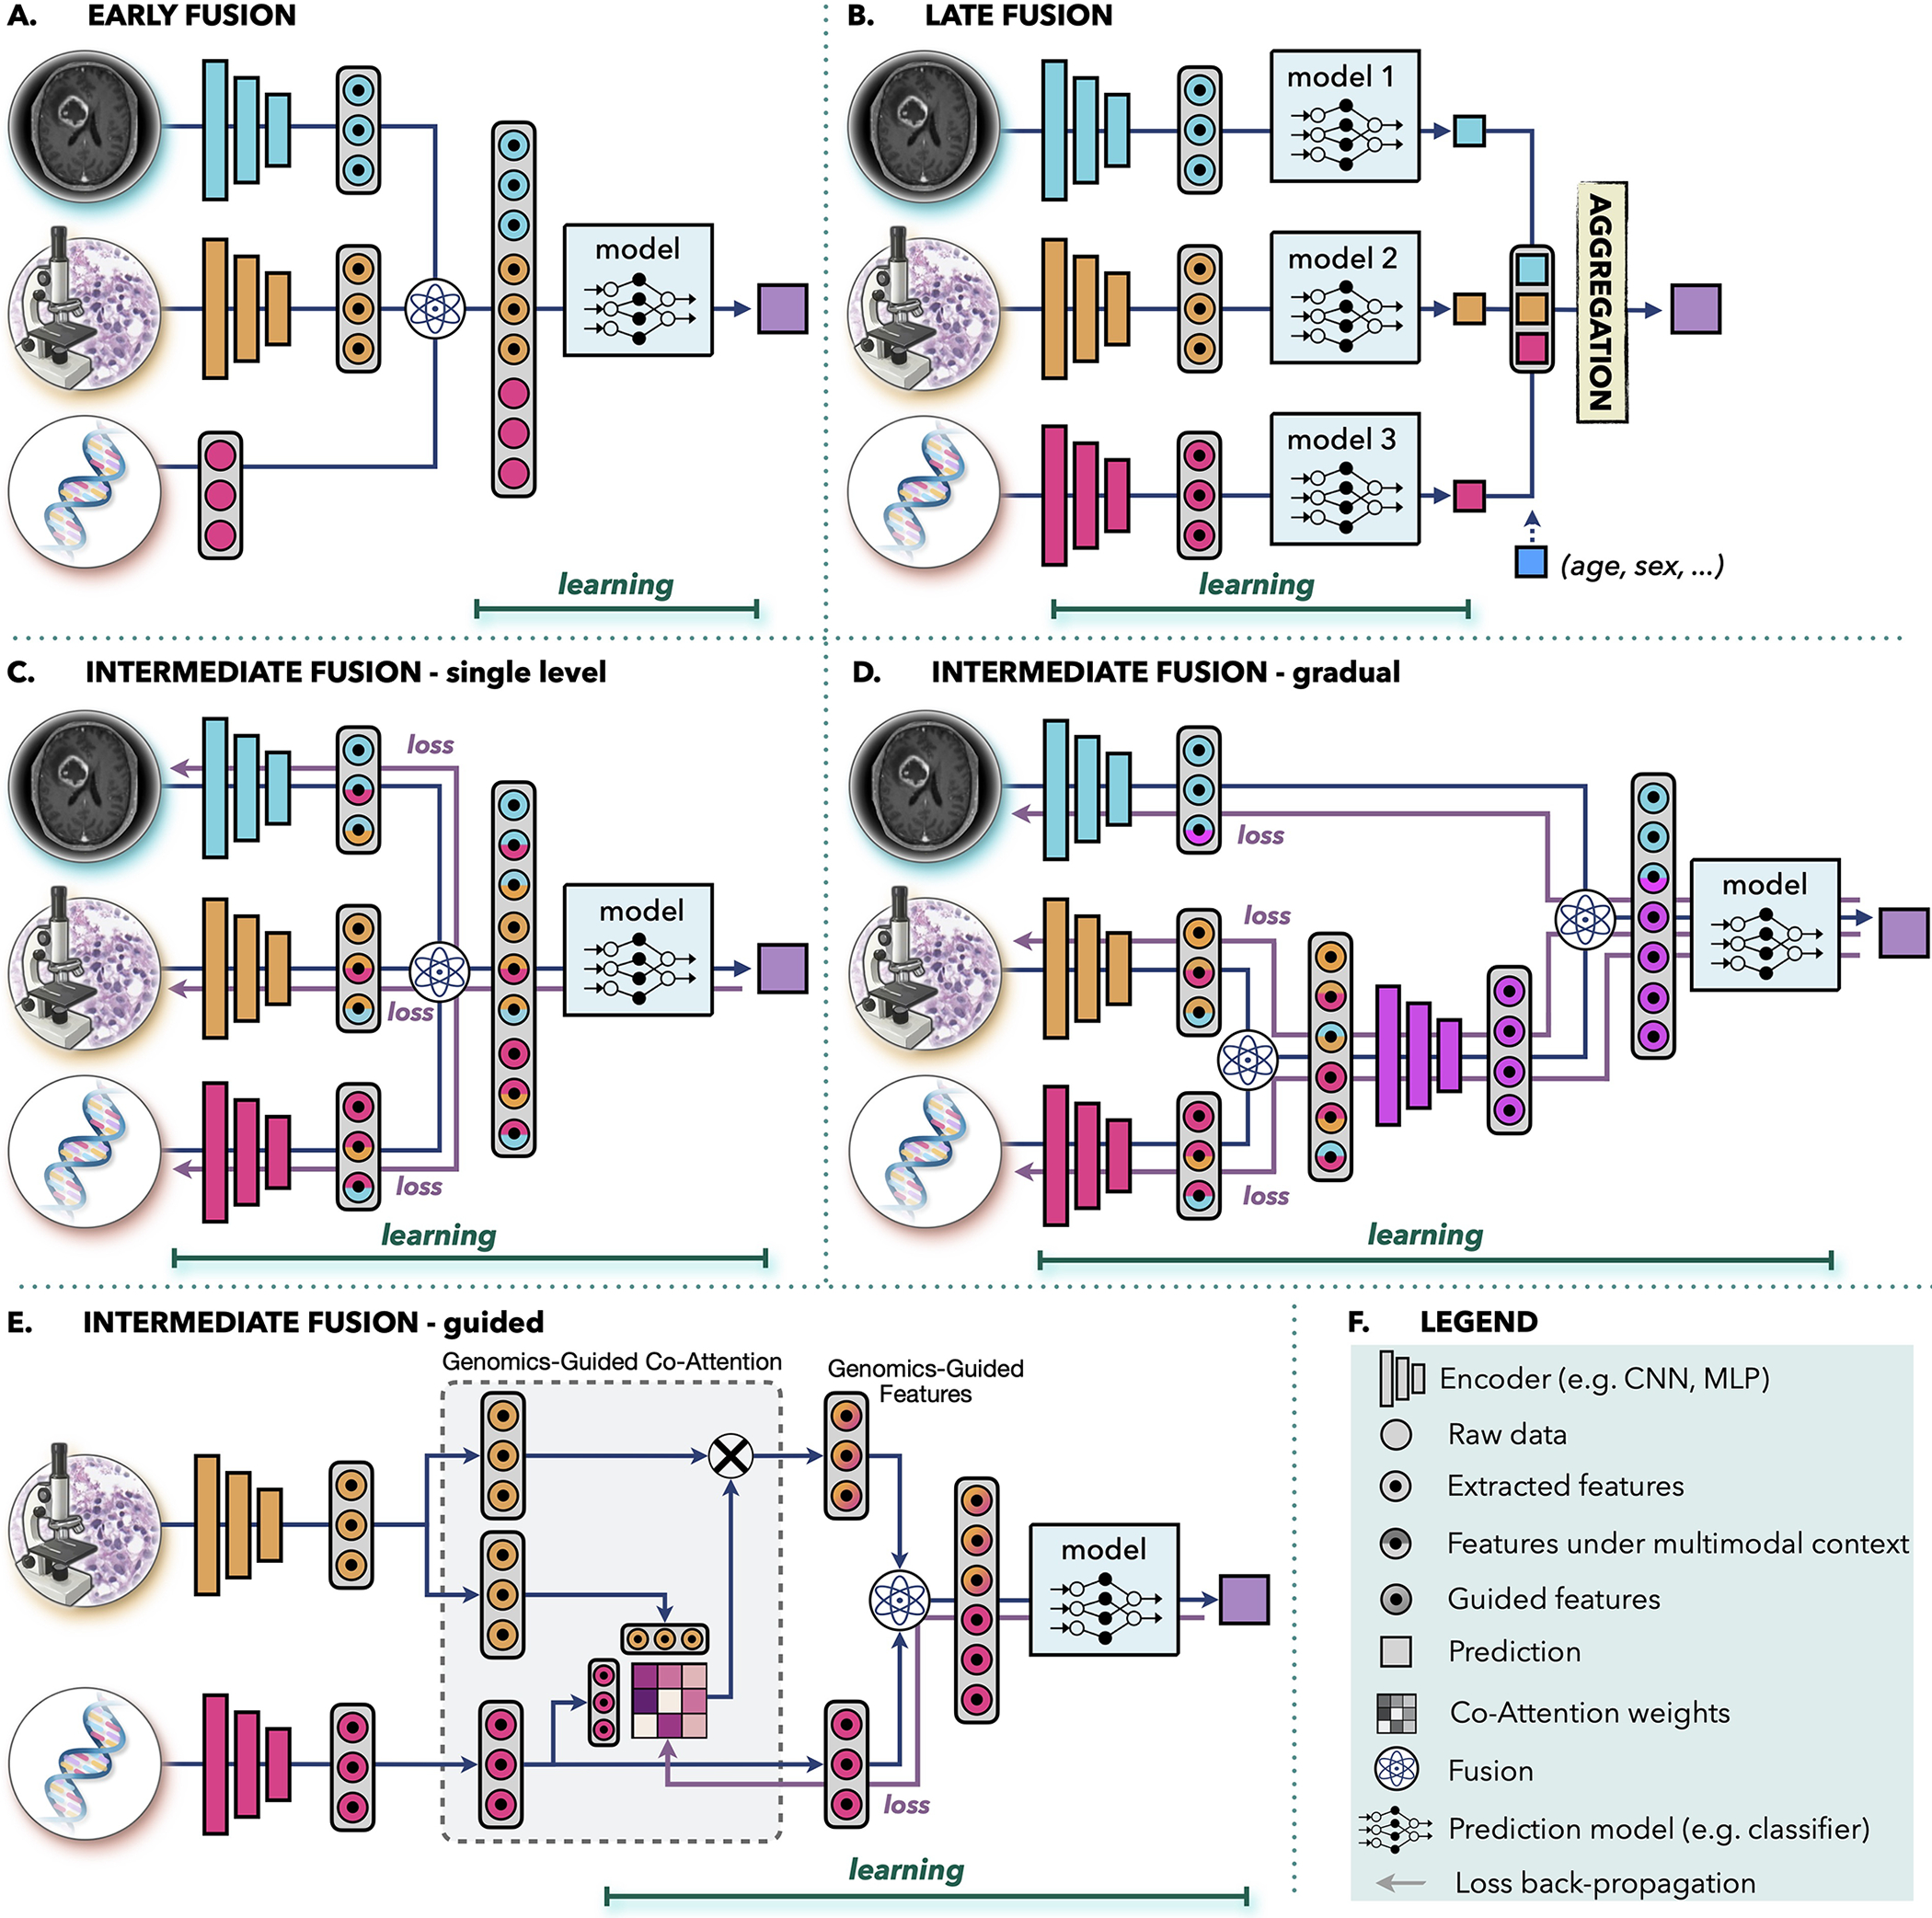
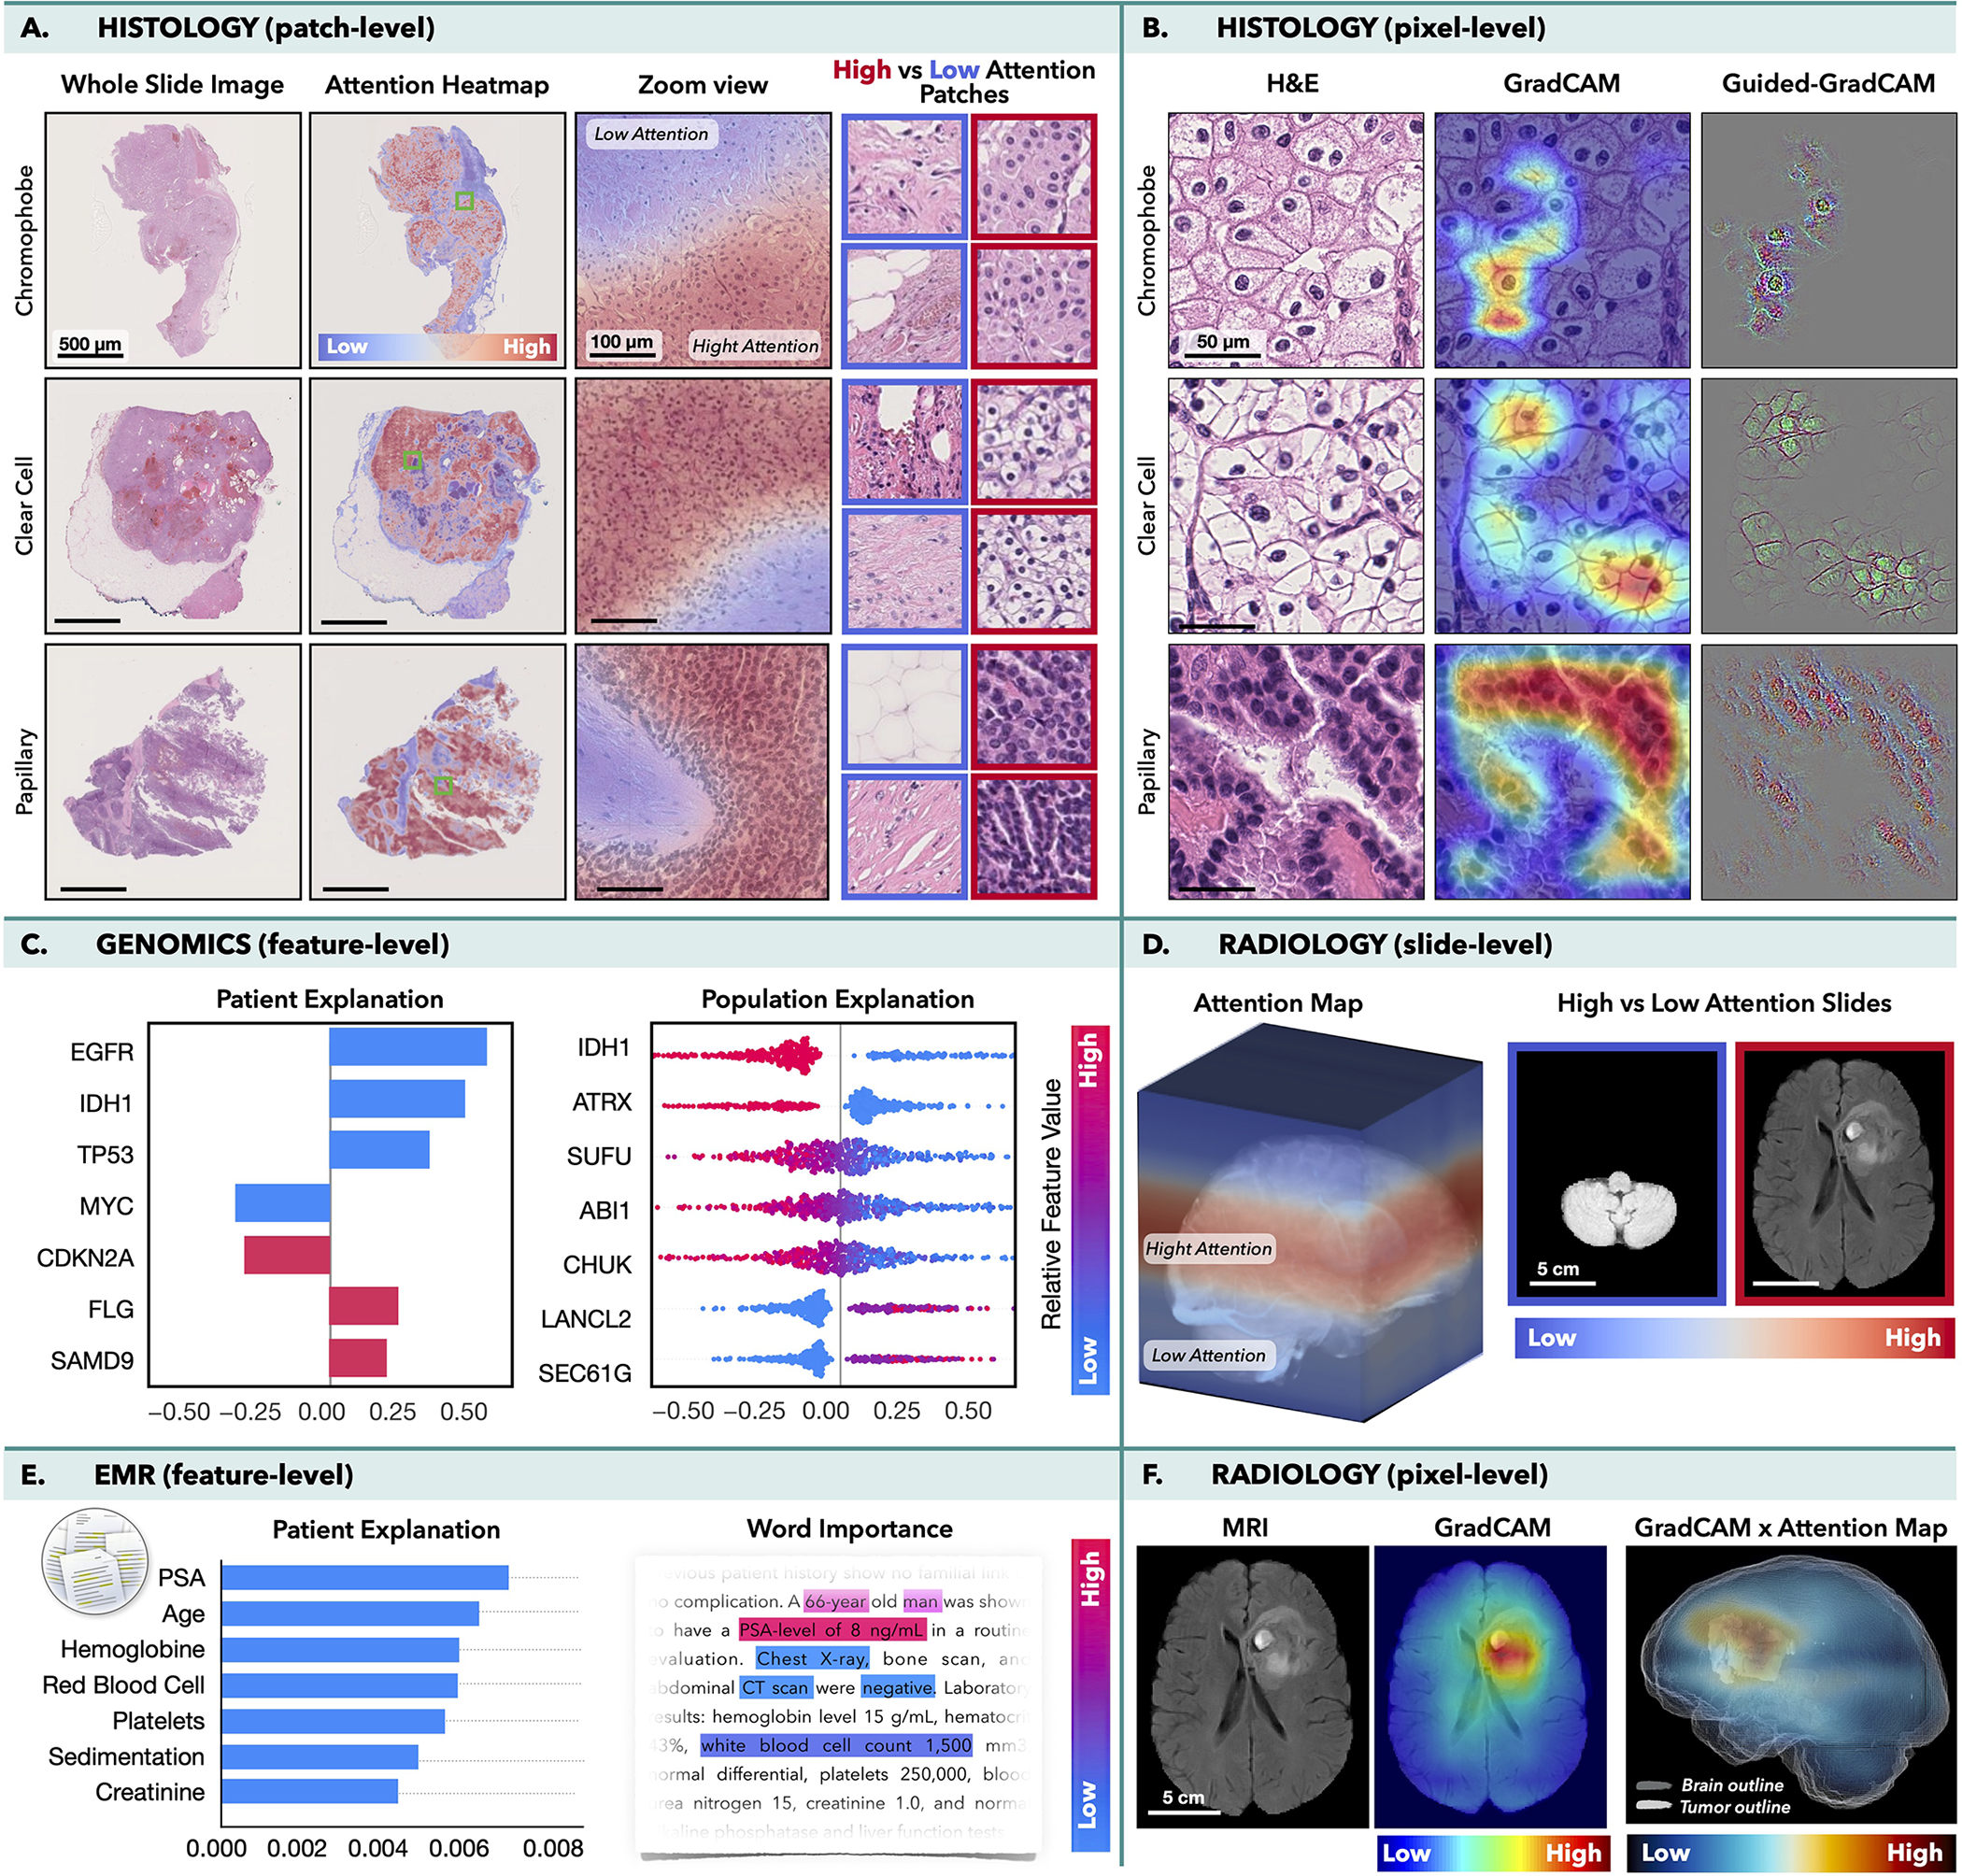
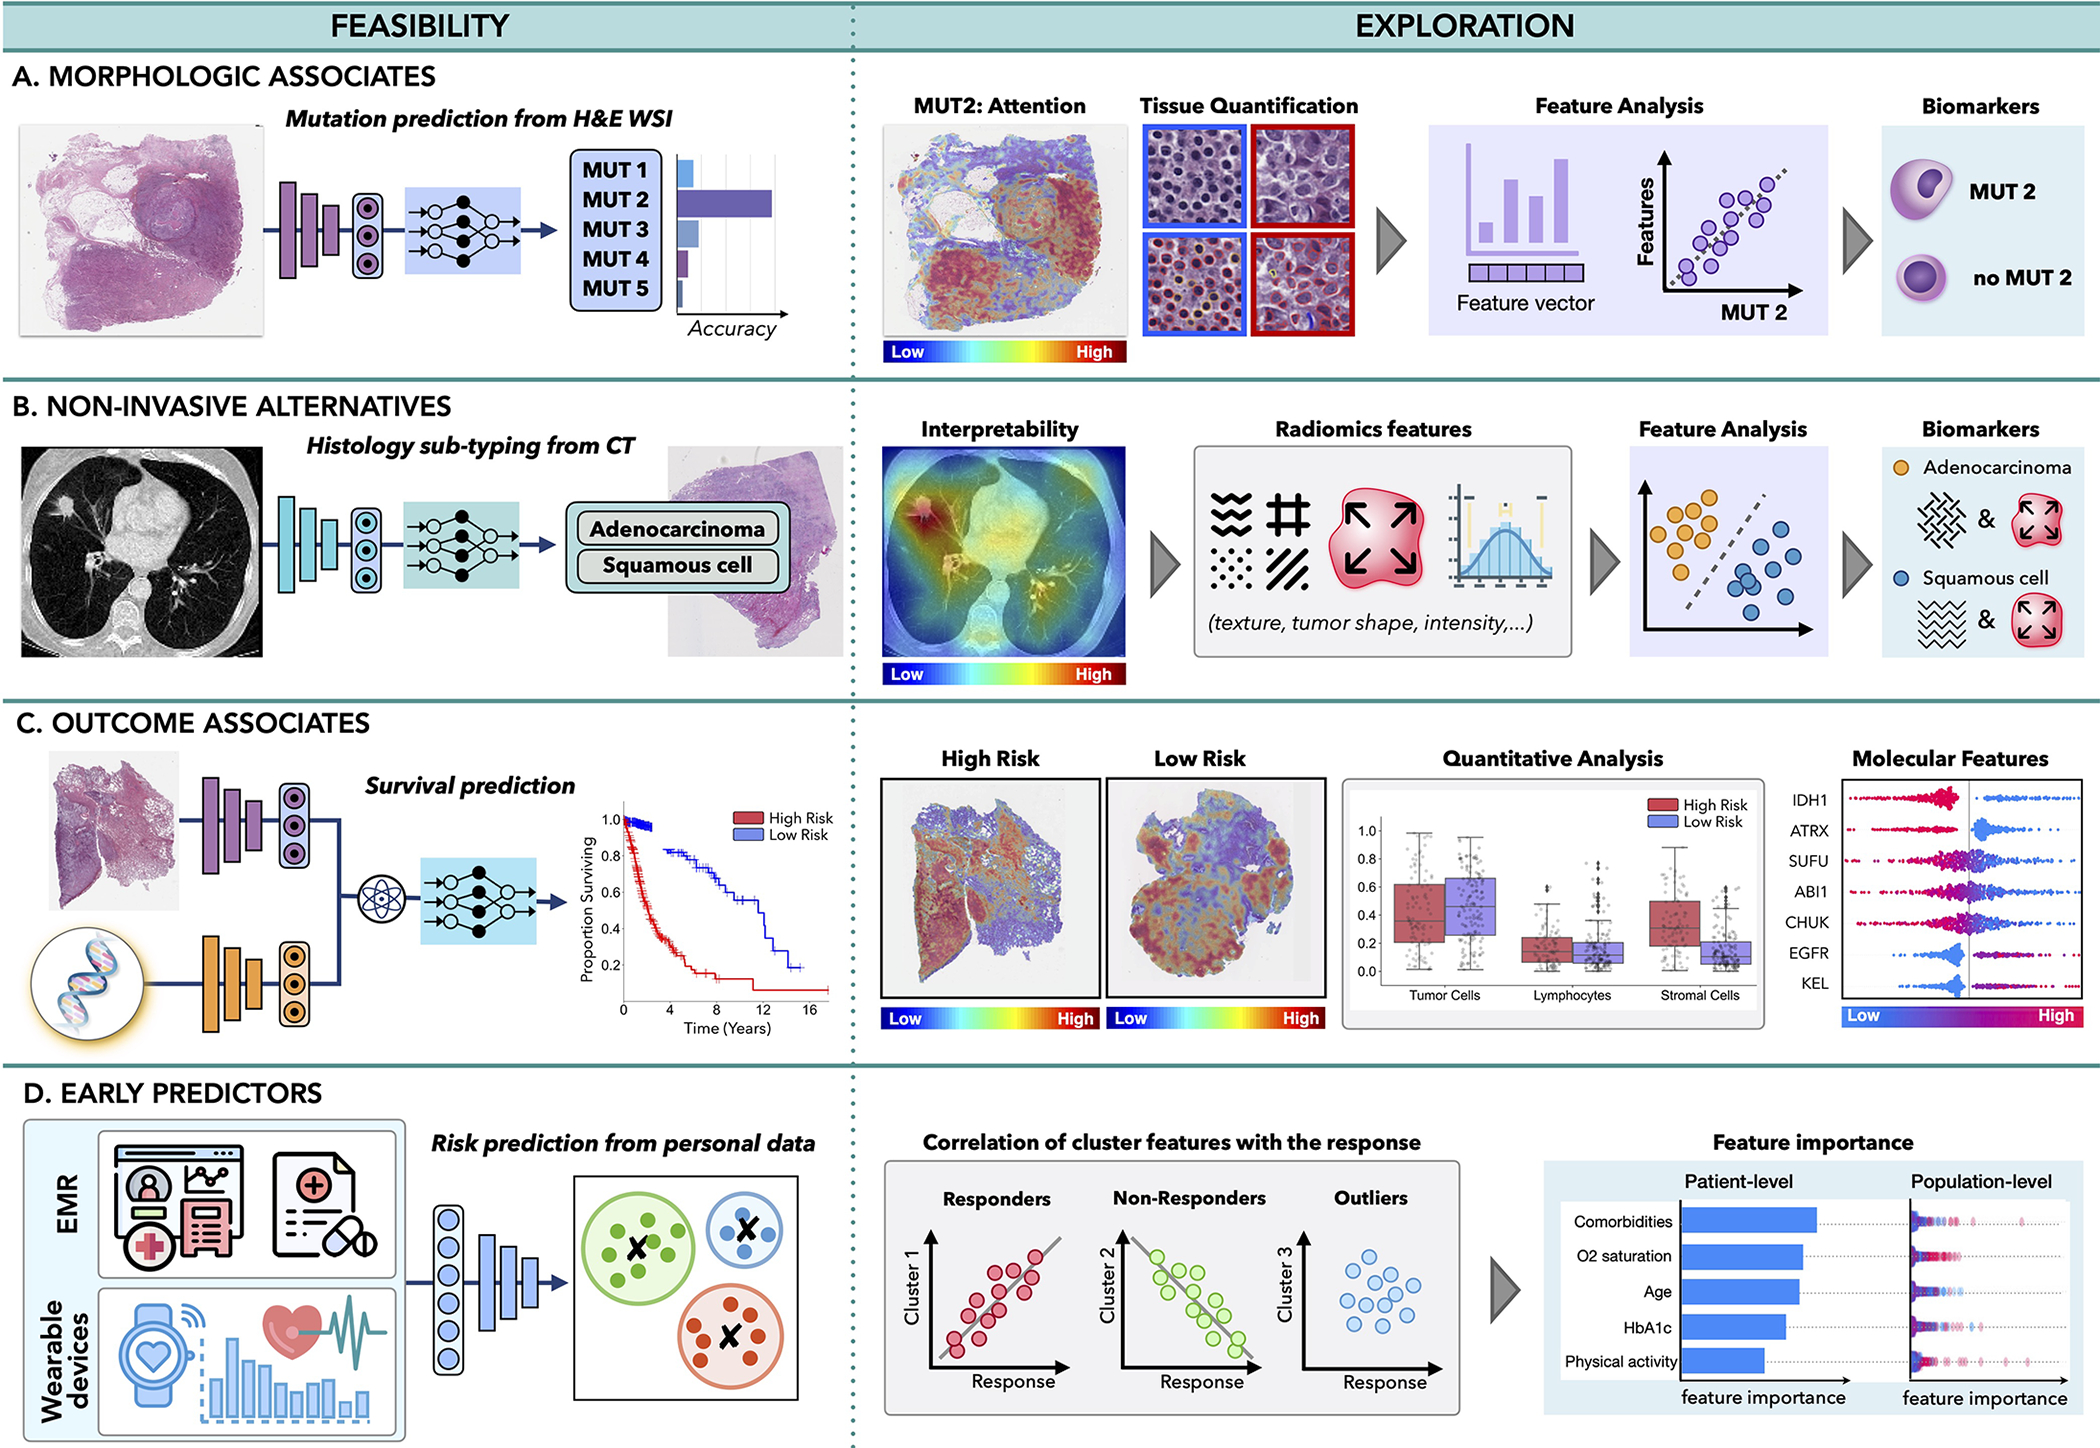
In oncology, the patient state is characterized by a whole spectrum of modalities, ranging from radiology, histology, and genomics to electronic health records. Current artificial intelligence (AI) models operate mainly in the realm of a single modality, neglecting the broader clinical context, which inevitably diminishes their potential. Integration of different data modalities provides opportunities to increase robustness and accuracy of diagnostic and prognostic models, bringing AI closer to clinical practice. AI models are also capable of discovering novel patterns within and across modalities suitable for explaining differences in patient outcomes or treatment resistance. The insights gleaned from such models can guide exploration studies and contribute to the discovery of novel biomarkers and therapeutic targets. To support these advances, here we present a synopsis of AI methods and strategies for multimodal data fusion and association discovery. We outline approaches for AI interpretability and directions for AI-driven exploration through multimodal data interconnections. We examine challenges in clinical adoption and discuss emerging solutions.

Keywords: AI in oncology; deep learning; deep learning in oncology; multimodal AI; multimodal fusion; multimodal integration.


Conflict of interest statement

Declaration of interests F.M. and R.J.C. are inventors on a patent related to multimodal learning.

Figures

Figure 1.
Figure 1.. AI-driven multimodal data integration.
A) AI models can integrate complemenatary information and clinical context from diverse data sources to provide more accurate outcome predictions. The clinical insights identified by such models can be further elucidated through C) interpretability methods and D) quantitative analysis to guide and accelerate the discovery of new biomarkers or therapeutic targets (E-F). B) AI can reveal novel multimodal interconnestions, such as relation between certain mutations and changes in cellular morphology or associations between radiology findings and histology tumor subtypes or molecular features. Such associations can serve as non-invasive or cost-efficient alternatives to existing biomarkers to support large-scale patient screening (E-F)
Figure 2.
Figure 2.. Overview of AI methods.
A) Supervised methods use strong supervision where each data point (e.g. feature or image patch) is assigned with a label. B) Weakly-supervised methods allow to train model with weak, patient-level labels, avoiding the need for manual annotations. C) Unsupervised methods explore patterns, subgroups and structures in unlabelled data. For comparison, all methods are illustrated on binary cancer detection task.
Figure 3.
Figure 3.. Multimodal data fusion.
A.) Early fusion builds a joint representation from raw data or features at the input level, before feeding it to the model. B.) Late fusion trains a separate model for each modality and aggregates the predictions from individual models at the decision level. (C-E) In intermediate fusion, the prediction loss is propagated back to the feature extraction layer of each modality to iteratively learn improved feature representations under the multimodal context. The unimodal data can be fused at C.) single-level or D.) gradually in different layers. E.) Information from one modality can be also used to guide feature extraction from another modality. F.) Legend of the used symbols.
Figure 4.
Figure 4.. Interpretability methods.
Histology: MIL model was trained to classify subtypes of renal-cell carcinoma in WSIs, while CNN was trained to perform the same task in image patches. A) Attention-heatmaps and patches with the lowest/highest attention score. B.) GradCAM attributions for each class. Radiology: MIL model was trained to predict survival from MRI scans using axial slides as individual instances. D.) Attention-heatmaps mapped into the 3D MRI scan and slides with the highest/lowest attention. F.) GradCAM was used to obtain pixel-level interpretability in each MRI slide. A 3D pixel-level interpretability is computed by weighting the slide-level GradCAM maps by the attention score of the respective slide. Integrated gradient attributions can be used to analyze C.) Genomics or E.) EMRs. The attribution magnitude corresponds to the importance of each feature and direction indicates feature impact towards low (left) vs. high (right) risk. The color specifies the value of the input features: copy number gain/presence of mutation are shown in red, while blue is used for copy number loss/wild-type status. E.) Attention scores can be used to analyse the importance of words in the medical text.
Figure 5.
Figure 5.. Multimodal data interconnection.
A.) AI can identify associations across modalities, such as feasibility of inferring certain mutations from histology or radiology images or B.) relation between non-invasive and invasive modalities, such as prediction of histology subtype from radiomics features. C.) The models can uncover associations between clinical data and patient outcome, contributing to discovery of predictive features within and across modalities. D.)Information acquired by EMRs or wearable devices can be analyzed to identify risk factors related with cancer onset or uncover patterns related with treatment response or resistance, to support early interventions.

References

    1. Adebayo J, Gilmer J, Muelly M, Goodfellow I, Hardt M, and Kim B. Sanity checks for saliency maps. In Bengio S, Wallach H, Larochelle H, Grauman K, Cesa-Bianchi N, and Garnett R, editors, Advances in Neural Information Processing Systems, volume 31. Curran Associates, Inc., 2018.
    1. Ahmedt-Aristizabal D, Armin MA, Denman S, Fookes C, and Petersson L. A survey on graph-based deep learning for computational histopathology. Computerized Medical Imaging and Graphics, page 102027, 2021. - PubMed
    1. Alsinglawi B, Alshari O, Alorjani M, Mubin O, Alnajjar F, Novoa M, and Darwish O. An explainable machine learning framework for lung cancer hospital length of stay prediction. Scientific reports, 12(1):1–10, 2022. - PMC - PubMed
    1. Anand D, Kurian NC, Dhage S, Kumar N, Rane S, Gann PH, and Sethi A. Deep learning to estimate human epidermal growth factor receptor 2 status from hematoxylin and eosin-stained breast tissue images. Journal of Pathology Informatics, 11, 2020. - PMC - PubMed
    1. Aronson JK and Green AR. Me-too pharmaceutical products: History, definitions, examples, and relevance to drug shortages and essential medicines lists. British Journal of Clinical Pharmacology, 86(11):2114–2122, 2020. - PMC - PubMed

Publication types

LinkOut - more resources