. 2022 Oct 20;82(20):3856-3871.e6.
doi: 10.1016/j.molcel.2022.09.019. Epub 2022 Oct 10.

Nuclear mRNA metabolism drives selective basket assembly on a subset of nuclear pore complexes in budding yeast

Affiliations

Nuclear mRNA metabolism drives selective basket assembly on a subset of nuclear pore complexes in budding yeast

Pierre Bensidoun et al. Mol Cell. .

Abstract

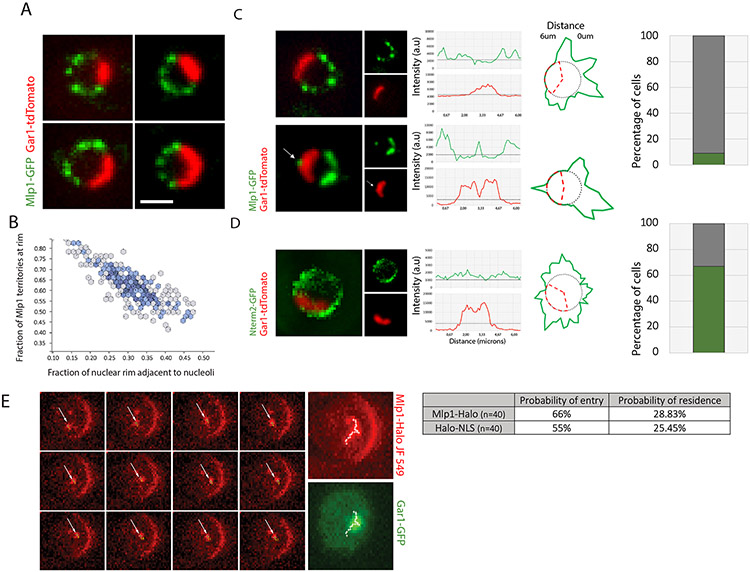
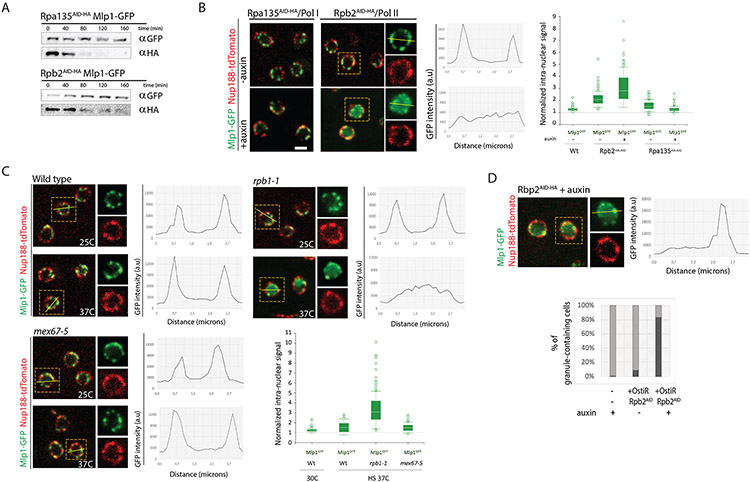
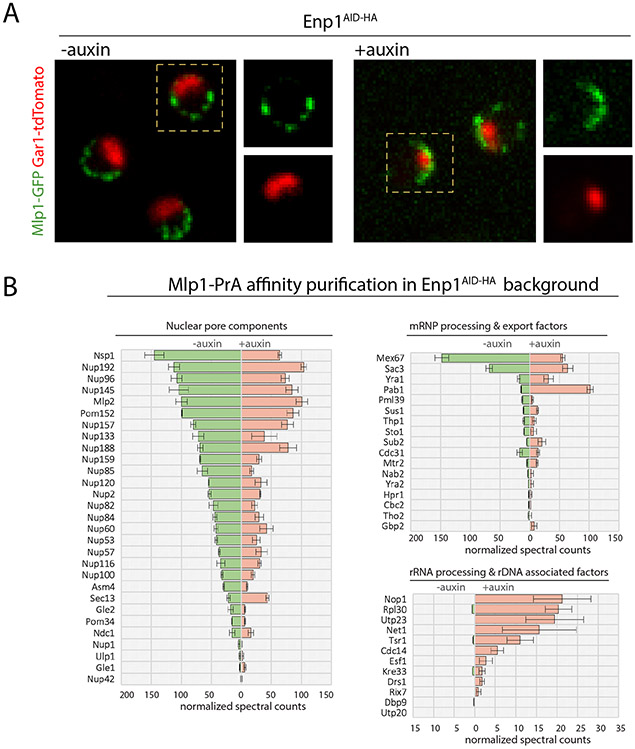
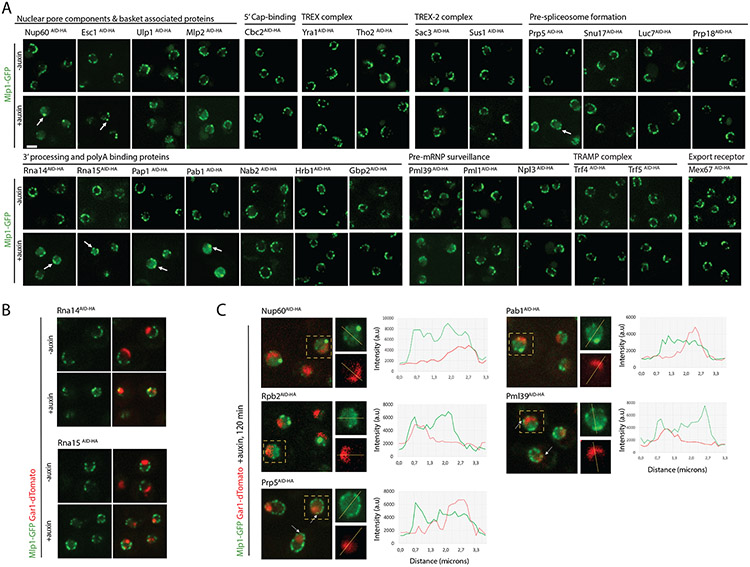
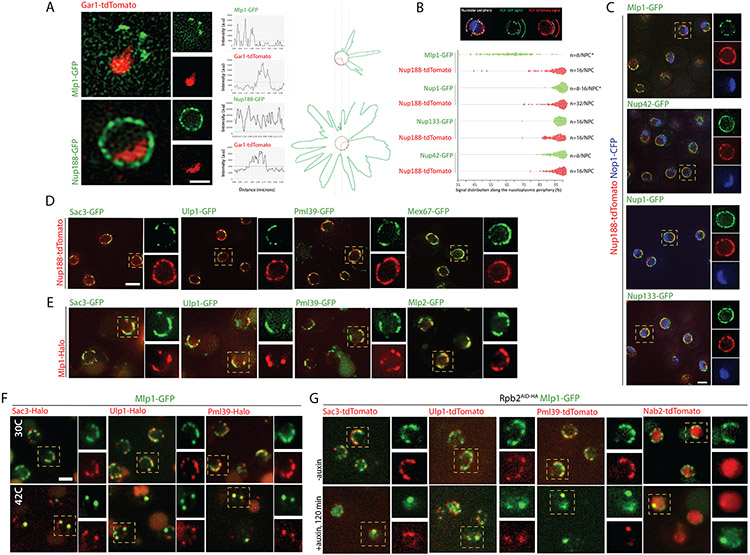
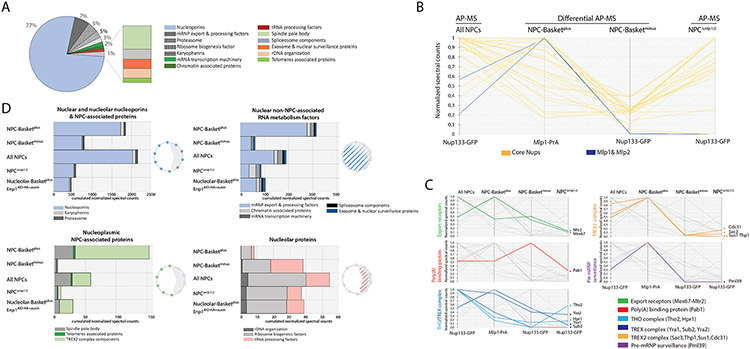
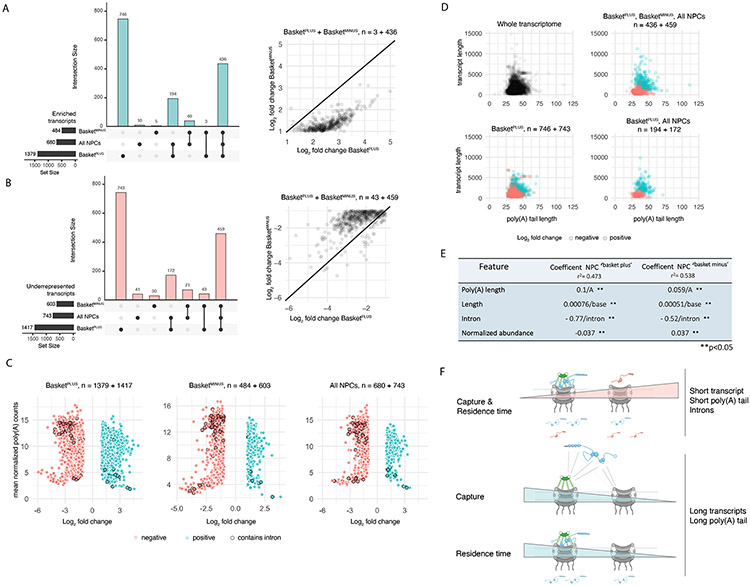
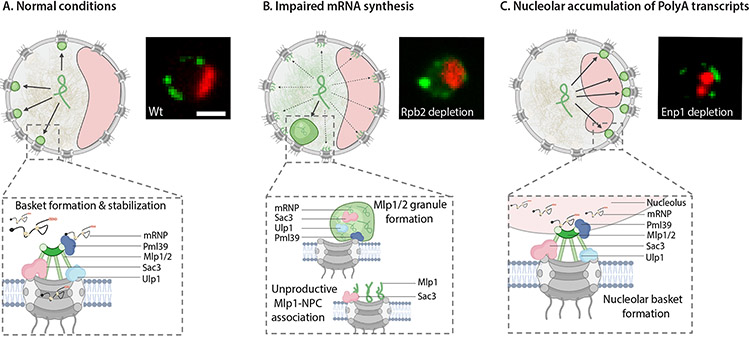
To determine which transcripts should reach the cytoplasm for translation, eukaryotic cells have established mechanisms to regulate selective mRNA export through the nuclear pore complex (NPC). The nuclear basket, a substructure of the NPC protruding into the nucleoplasm, is thought to function as a stable platform where mRNA-protein complexes (mRNPs) are rearranged and undergo quality control prior to export, ensuring that only mature mRNAs reach the cytoplasm. Here, we use proteomic, genetic, live-cell, and single-molecule resolution microscopy approaches in budding yeast to demonstrate that basket formation is dependent on RNA polymerase II transcription and subsequent mRNP processing. We further show that while all NPCs can bind Mlp1, baskets assemble only on a subset of nucleoplasmic NPCs, and these basket-containing NPCs associate a distinct protein and RNA interactome. Taken together, our data point toward NPC heterogeneity and an RNA-dependent mechanism for functionalization of NPCs in budding yeast through nuclear basket assembly.

Keywords: Mlp1; NPC heterogeneity; basket accessory interactome; mRNA export; mRNA processing; nuclear basket; nuclear compartmentalization; nuclear pore complex; nucleolus; poly(A) transcripts.


Conflict of interest statement

Declaration of interests The authors declare no competing interests.

Figures

Figure 1.
Figure 1.. Mlp1 can access the nucleolus and assemble baskets at nucleolar NPCs.
A. Mlp1-GFP and Gar1-tdTomato distribution. B. Quantification of nuclear periphery occupied by Mlp1-GFP versus nucleolus (n=200). C. Mlp1-GFP assembling an ectopic basket (arrow), correlating with a Gar1-tdTomato signal loss (Gar1 intensity plot, arrow). Histogram quantification of cells with ectopic baskets (n=150). D. Mlp1-Nterm2-GFP fragment distribution along the nuclear periphery in Δmlp1/2 and quantification of cells with Mlp1-Nterm2-GFP signal at periphery adjacent to nucleolus (n=100). In C, D, signal intensity distribution shown in line plots and circular diagrams where red dashes delimit nucleolar region and average background signal shown as grey circles; Mlp1 distribution in green. E. Live-cell tracking of single Mlp1-Halo-JF549 molecules. Individual frames acquired at 20ms intervals are shown. White arrows indicate Mlp1-Halo-JF549; MAX, maximum intensity projection of all frames; track shown as white crosses. Quantification of observed probability of entry and residence for Mlp1 and control (n=40). Scale bar = 2μm.
Figure 2.
Figure 2.. Inhibition of RNA polymerase II transcription, but not mRNA export, affects basket assembly.
A. Western blot of total cell lysates from Rpb2AID-HA and Rpa135AID-HA cells upon auxin addition. B. Mlp1-GFP localization pre- and post-addition of auxin (500 μM, 120mins) in Rpb2AID-HA and Rpa135AID-HA cells. Nup188-tdTomato outlines nuclear periphery. For Rpb2AID-HA cells, line scan intensity plot shows Mlp1-GFP signal distribution in a single cell pre/post-auxin. Bar graph shows quantification of Mlp1-GFP intranuclear signal (n=100). C. Mlp1-GFP distribution in wt, rpb1-1 and mex67-5 cells at 25°C and 37°C. Line scan intensity plots show Mlp1-GFP signal distribution, bar graphs quantification of average Mlp1-GFP intranuclear signal intensities in the center of nuclei over background. D. Mlp1-GFP granule formation in Rpb2AID-HA cells 120 min post-auxin. Histogram quantification of % cells with Mlp1-GFP granules post-Rbp2 depletion. Scale bar = 2μm. Data are represented as mean ± SEM.
Figure 3.
Figure 3.. Nucleolar basket assembly upon depletion of the ribosome biogenesis factor Enp1.
A. Distribution of Mlp1-GFP along the nuclear and nucleolar peripheries in Enp1AID-HA cells pre- and post-auxin (120 min). Nucleolus labeled by Gar1-tdTomato. B. Normalized median MS spectral counts of proteins co-purified with Mlp1-PrA from Enp1AID-HA cells pre- and post-auxin treatment (120 min). Data are represented as mean ± SEM (n=3).
Figure 4.
Figure 4.. Depletion of mRNP maturation factors affecting basket assembly and Mlp1 localization.
A. Depletion screen for changes in Mlp1 localization (120 min post-auxin); changes indicated by arrows. B. Distribution of Mlp1-GFP in Rna14AID-HA and Rna15AID-HA cells. C. Mlp1-GFP distribution with respect to nucleolus in strains with altered perinuclear Mlp1-GFP signal. Line scan intensity plot show comparative Mlp1-GFP and Gar1-tdTomato distribution; arrows indicate Mlp1 signal at nucleolar periphery. Scale bar =2μm.
Figure 5.
Figure 5.. Baskets assemble on a subset of NPCs in the nucleoplasm and co-localize with select proteins at the nuclear periphery.
A. SIM of Nup188-GFP or Mlp1-GFP and Gar1-tdTomato; signal intensity distribution shown in line plots and circular diagrams where red dashes delimit nucleolar region; average background signal shown as grey circles and GFP distribution in green. B. Signal distribution analysis of selected GFP-tagged Nups or Mlp1-GFP compared to Nup188-tdTomato along the nucleoplasmic periphery; each dot represents the occupied proportion/cell (in %; n=100). C. SIM co-localization analysis of Nop1-CFP, Nup188-tdTomato, and Nup42-, Nup1-, Nup133- or Mlp1-GFP. D. SIM co-localization analysis of Nup188-tdTomato and Sac3-, Ulp1-, Pml39- and Mex67-GFP. E. SIM co-localization analysis of Mlp1-Halo and Sac3-, Ulp1-, Pml39- and Mlp2-GFP. F. SIM co-localization analysis of Mlp1-GFP and Sac3-, Ulp1-, and Pml39-Halo at 30°C or 42°C. G. SIM co-localization analysis of Mlp1-GFP and Sac3-, Ulp1-, Pml39-, and Nab2-Halo in Rbp2AID-HA cells pre- and 120 min post-auxin. Scale bar =2μm.
Figure 6.
Figure 6.. Dissection of differential NPC interactomes.
A. Overview NPC interactome from the total pore AP. Each protein categories represent the sum of the normalized spectral counts. B, C. Parallel coordinate plots representing the sum of normalized spectral count values for NPC and basket proteins (B) and nuclear mRNA metabolism proteins (C) affinity purified via Nup133-GFP (‘All NPC’); differentially affinity purified via Mlp1-PrA (Basketplus) and Nup133-GFP (Basketminus), or Δmlp1/2/ Nup133-GFP cells. Data has been compressed for visualization and comparison purposes; 1 represents maximal value of ESC median between experiments (n=3). Lines represent the relative abundance of proteins between different APs. D. Histograms representing the sum of normalized spectral counts of proteins co-purified with either ‘All NPCs’, Mlp1-PrA (Basketplus), and Nup133-GFP (Basketminus) from Mlp1-PrA/Nup133-GFP, Δmlp1/2/ Nup133-GFP cells and Mlp1-PrA/Nup133-GFP/Enp1AID-HA cells upon auxin treatment and analyzed according to their function in RNA metabolism across different subnuclear compartments. Cartoons: yeast nuclei, nucleolus outlined as grey crescent; spheres represent associating proteins/group.
Figure 7.
Figure 7.. A differential Mlp1 RNA interactome suggests selective transport.
A. Upset plot. Bar graph, bottom left: transcripts identified with ‘All NPCs’, and differential ‘Basketplus’ and ‘Basketminus’ NPC APs with a log2(FC) > 1 over poly(A) libraries. Bar graph, top: exclusively enriched transcripts and intersection sizes; dots indicate shared transcript sets. Scatter plot, right: transcripts enriched in both ‘Basketplus’ and ‘Basketminus’ with higher log2(FC) values in ‘Basketplus’ compared to ‘Basketminus’. B. Upset plot. Bar graph, left: transcripts significantly underrepresented with a log2(FC)< 1 over poly(A) libraries across samples. Bar graph, top: exclusively underrepresented transcripts and intersection sizes; dots indicate shared transcript sets. Scatter plot, right: transcripts depleted in both ‘Basketplus’ and ‘Basketminus’ with lower log2(FC) values in ‘Basketplus’ compared to ‘Basketminus’. C. Scatter plots of log2(FC) values against mean normalized transcript expression in the poly(A) library. D. Scatter plots of poly(A) tail length vs. transcript length. E. Linear regression models built from poly(A) tail length, transcript length, intron presence/absence and mean poly(A) normalized transcript counts for ‘Basketplus’ and ‘Basketminus’ samples. All coefficents were significant (p<0.05). F. Cartoons illustrating models of mRNP capture and residence time at ‘Basketplus’ and ‘Basketminus’ NPCs based on select features.
Figure 8.
Figure 8.. mRNA metabolism drives basket assembly.
Cartoons of yeast nuclei illustrating different models of Mlp1-assemblies. A. Assembly of productive nuclear baskets, B. unproductive Mlp1-NPC binding and Mlp1 granules, and C. nucleolar baskets. Nucleoli, red crescents; Mlp1, green ampersands. Fluorescent images representing the three different types of Mlp1 assemblies shown on the right.

Similar articles

Cited by

References

    1. Abraham KJ, Khosraviani N, Chan JNY, Gorthi A, Samman A, Zhao DY, Wang M, Bokros M, Vidya E, Ostrowski LA, et al. (2020). Nucleolar RNA polymerase II drives ribosome biogenesis. Nature 585, 298–302. 10.1038/s41586-020-2497-0. - DOI - PMC - PubMed
    1. Aguilar L-C, Paul B, Reiter T, Gendron L, Rajan AAN, Montpetit R, Trahan C, Pechmann S, Oeffinger M, and Montpetit B (2020). Altered rRNA processing disrupts nuclear RNA homeostasis via competition for the poly(A)-binding protein Nab2. Nucleic Acids Res 48, 11675–11694. 10.1093/nar/gkaa964. - DOI - PMC - PubMed
    1. Aksenova V, Smith A, Lee H, Bhat P, Esnault C, Chen S, Iben J, Kaufhold R, Yau KC, Echeverria C, et al. (2020). Nucleoporin TPR is an integral component of the TREX-2 mRNA export pathway. Nat Commun 11, 4577. 10.1038/s41467-020-18266-2. - DOI - PMC - PubMed
    1. Baptista T, Grünberg S, Minoungou N, Koster MJE, Timmers HTM, Hahn S, Devys D, and Tora L (2017). SAGA Is a General Cofactor for RNA Polymerase II Transcription. Mol Cell 68, 130–143.e5. 10.1016/j.molcel.2017.08.016. - DOI - PMC - PubMed
    1. Bensidoun P, Zenklusen D, and Oeffinger M (2021). Choosing the right exit: How functional plasticity of the nuclear pore drives selective and efficient mRNA export. Wiley Interdiscip Rev Rna e1660. 10.1002/wrna.1660. - DOI - PubMed

Publication types

MeSH terms

LinkOut - more resources