
Coronavirus Antibody Responses before COVID-19 Pandemic, Africa and Thailand

Yifan Li et al. Emerg Infect Dis. 2022 Nov.

Abstract

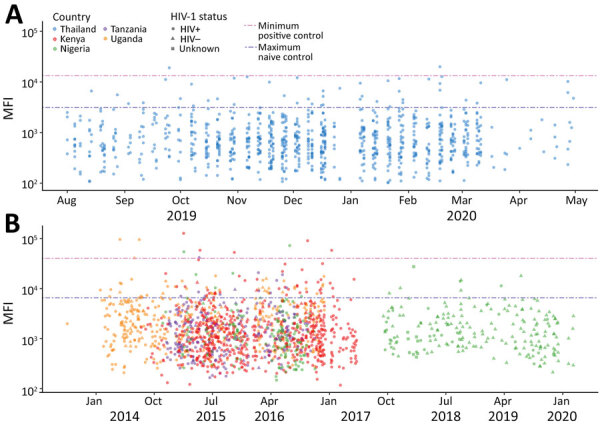
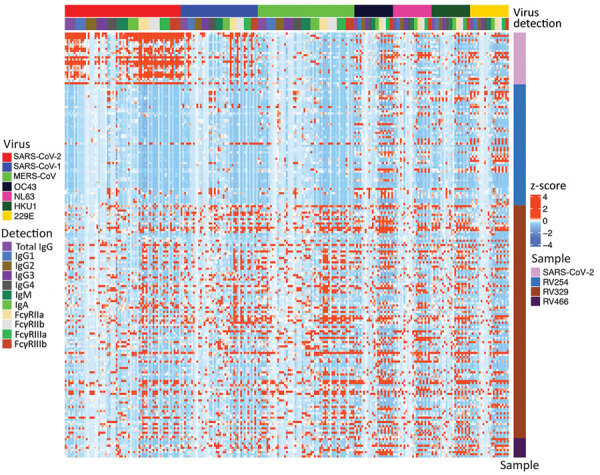
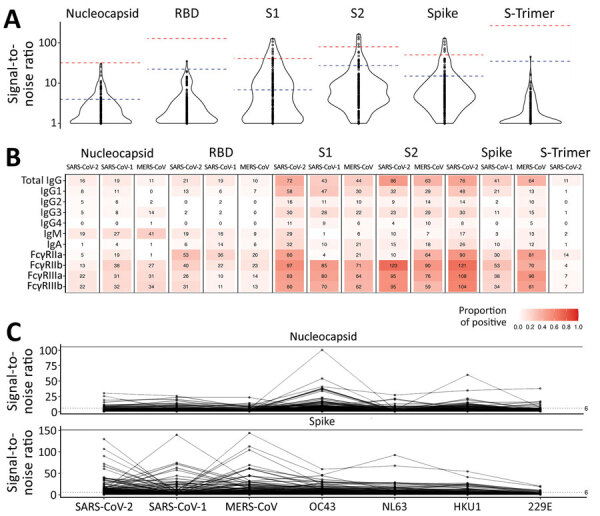
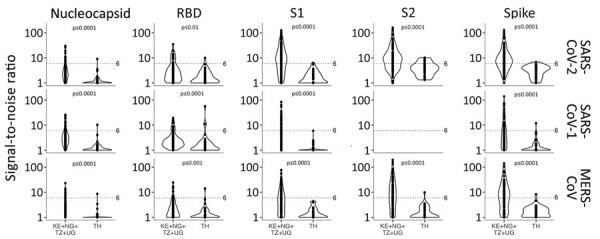
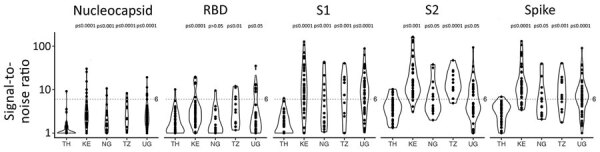
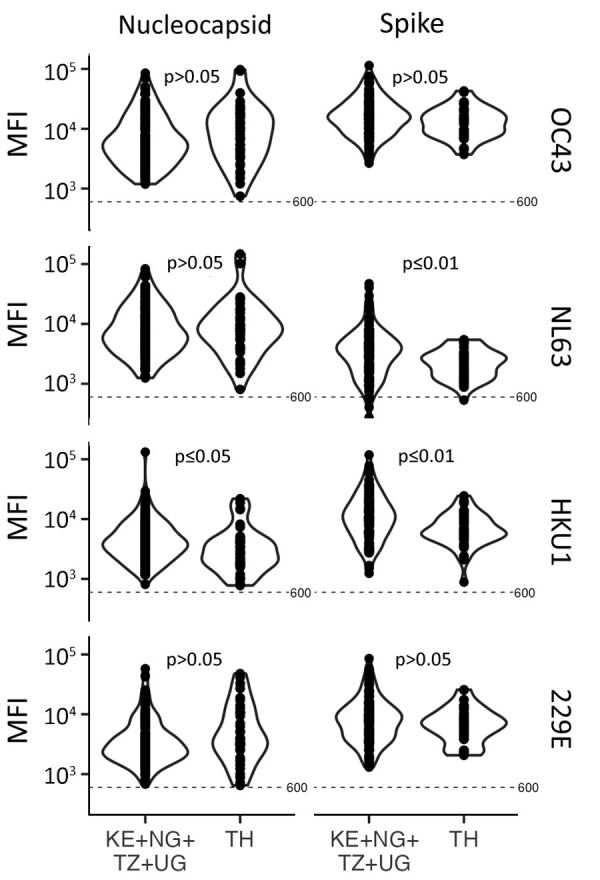
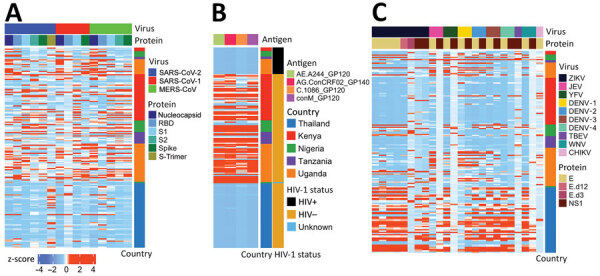
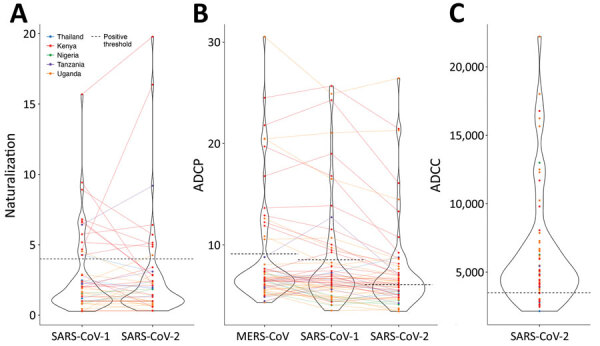
Prior immune responses to coronaviruses might affect human SARS-CoV-2 response. We screened 2,565 serum and plasma samples collected from 2013 through early 2020, before the COVID-19 pandemic began, from 2,250 persons in 4 countries in Africa (Kenya, Nigeria, Tanzania, and Uganda) and in Thailand, including persons living with HIV-1. We detected IgG responses to SARS-CoV-2 spike (S) subunit 2 protein in 1.8% of participants. Profiling against 23 coronavirus antigens revealed that responses to S, subunit 2, or subunit 1 proteins were significantly more frequent than responses to the receptor-binding domain, S-Trimer, or nucleocapsid proteins (p<0.0001). We observed similar responses in persons with or without HIV-1. Among all coronavirus antigens tested, SARS-CoV-2, SARS-CoV-1, and Middle East respiratory syndrome coronavirus antibody responses were much higher in participants from Africa than in participants from Thailand (p<0.01). We noted less pronounced differences for endemic coronaviruses. Serosurveys could affect vaccine and monoclonal antibody distribution across global populations.

Keywords: Africa; COVID-19; HIV-1; SARS; SARS-CoV-2; Thailand; coronavirus; coronavirus disease; respiratory infections; serosurvey; severe acute respiratory syndrome coronavirus 2; viruses; zoonoses.


Figures

Figure 1
Figure 1
IgG responses to S2 protein among HIV-positive and HIV-negative participants in a study of coronavirus antibody responses before COVID-19 pandemic, Thailand (2013–2020) and Africa (2018–2020). A) Thailand; B) Kenya, Nigeria, Tanzania, and Uganda. We measured MFI for SARS-CoV-2 S2 IgG binding responses in 2,565 serum and plasma samples. Blue dashed line indicates maximum observed signal in 2 negative control samples; pink dashed line indicates minimum observed signal in positive control samples collected from SARS-CoV-2 convalescent patients. Symbols indicate the country of origin, collection date, and HIV-1 status of each participant. Dates indicate sample collection date. MFI, mean fluorescent intensity; S2, subunit 2 protein.
Figure 2
Figure 2
Heat map of coronavirus-specific antibody responses in a study of coronavirus antibody responses before COVID-19 pandemic, Thailand and Africa. We measured antibody responses for in 173 prepandemic serum and plasma samples and 12 samples collected from SARS-CoV-2 convalescent patients. Samples were tested for human coronaviruses SARS-CoV-2, SARS-CoV-1, MERS-CoV, OC43, NL63, HKU1, and 229E. Binding responses are given as z-scores. Each column corresponds to a specific antigen and detection combination. Each row represents a sample; the top 24 rows correspond to positive controls from SARS-CoV-2 convalescent patients. FcγR, Fc gamma receptor (FcγRIIa, FcγRIIb, FcγRIIIa, and FcγRIIIb).
Figure 3
Figure 3
Comparison of antibody responses to human coronaviruses in serum and plasma samples collected before COVID-19 pandemic and from convalescent SARS-CoV-2 patients, Thailand and Africa. A) Violin plot comparing SARS-CoV-2 IgG binding responses against positive control samples. Blue dashed lines indicate median observed signal in positive control samples; pink dashed lines indicate maximum observed signal in positive control samples collected from SARS-CoV-2 convalescent patients. B) Number of coronavirus-positive samples detected by using a signal-to-noise ratio >6 across 3 outbreak coronaviruses and all antigens. C) IgG binding responses in nucleocapsid (top) and spike (bottom) proteins against all 7 human coronaviruses investigated. MERS-CoV, Middle East respiratory syndrome coronavirus; RBD, receptor-binding domain; S1, subunit 1; S2, subunit 2.
Figure 4
Figure 4
Violin plots of IgG signal-to-noise ratio comparing coronavirus antibody responses before COVID-19 pandemic, Thailand and Africa. We investigated IgG responses across 14 antigens from 3 coronaviruses, SARS-CoV-2, SARS-CoV-1, and Middle East respiratory syndrome coronavirus. Dotted line indicates signal-to-noise ratio cutoff. Significance was determined by Wilcoxon rank-sum test. KE, Kenya; NG, Nigeria; RBD, receptor-binding domain; S1, subunit 1; S2, subunit 2; TH, Thailand; TZ, Tanzania; UG, Uganda.
Figure 6
Figure 6
Violin plots of signal-to-noise ratio comparing SARS-CoV-2 IgG responses in serum and plasma samples before COVID-19 pandemic, Thailand and Africa. Dotted line indicates signal-to-noise ratio cutoff. Results show higher SARS-CoV-2 responses in participants from Africa than in participants from Thailand. Significance was determined by Wilcoxon rank-sum test. KE, Kenya; N, nucleocapsid; NG, Nigeria; RBD, receptor-binding domain; S1, subunit 1; S2, subunit 2; TH, Thailand; TZ, Tanzania; UG, Uganda.
Figure 5
Figure 5
Violin plots of IgG mean fluorescent intensity for nucleocapsid and spike proteins of 4 endemic human coronaviruses in serum and plasma samples collected before the COVID-19 pandemic, Thailand and Africa. Samples comprised 117 participants from Kenya, Nigeria, Tanzania, and Uganda and 38 participants from Thailand. Significance was determined by Wilcoxon rank-sum test. Dotted line indicates MFI cutoff. KE, Kenya; MFI, mean fluorescent intensity; N, nucleocapsid; NG, Nigeria; RBD, receptor-binding domain; S1, subunit 1; S2, subunit 2; TH, Thailand; TZ, Tanzania; UG, Uganda.
Figure 7
Figure 7
Heatmaps for outbreak coronaviruses, HIV-1, and flavivirus responses compared in a study of coronavirus antibody responses before COVID-19 pandemic, Thailand and Africa. A) IgG binding responses against SARS-CoV-2, SARS-CoV-1, and MERS-CoV. B) IgG binding responses against HIV-1 envelope antigens corresponding to CRF01_AE, CRF02_AG, subtype C, and group M. C) IgG binding responses against flaviviruses. Binding responses are presented as Z scores. Each column corresponds to a specific antigen. Each row represents a sample; the country of origin and HIV-1 status are marked in different colors. CHIKV, chikungunya virus; DENV, dengue virus; E, envelope; JEV, Japanese encephalitis virus; MERS-CoV, Middle East respiratory syndrome coronavirus; N, nucleocapsid; NS1, nonstructural 1; PLWH, persons living with HIV; PWOH, persons without HIV; RBD, receptor-binding domain; S1, subunit 1; S2, subunit 2; TBEV, tickborne encephalitis virus; YFV, yellow fever virus; WNV, West Nile virus; ZIKV, Zika virus.
Figure 8
Figure 8
Violin plots of neutralizing, ADCP, and ADCC responses in prepandemic serums and plasma samples used to study coronavirus antibody responses before COVID-19 pandemic, Thailand and Africa. A) Pseudovirus neutralization against SARS-CoV-1 and SARS-CoV-2. The plot shows fold change of the ID50 for SARS-CoV-1 or SARS-CoV-2 over the ID50 for spike glycoprotein of the vesicular stomatitis virus control pseudoviruses. B) ADCP against MERS-CoV, SARS-CoV-1, and SARS-CoV-2. C) ADCC against SARS-CoV-2. Positive threshold is defined as mean of the negative control samples +3 SD. Solid lines link each sample between plots. Dotted lines indicate positive thresholds for each assay. Samples are color-coded for the participant’s country of origin. ADCC, antibody-dependent cellular cytotoxicity; ADCP, antibody-dependent cellular phagocytosis; ID50, 50% inhibitory dilution; MERS-CoV, Middle East respiratory syndrome coronavirus.

Similar articles

Cited by

References

    1. Lawal Y. Africa’s low COVID-19 mortality rate: A paradox? Int J Infect Dis. 2021;102:118–22. 10.1016/j.ijid.2020.10.038 - DOI - PMC - PubMed
    1. Gill CJ, Mwananyanda L, MacLeod W, Kwenda G, Pieciak R, Etter L, et al. Sustained high prevalence of COVID-19 deaths from a systematic post-mortem study in Lusaka, Zambia: one year later. medRxiv. 2022. 10.1101/2022.03.08.22272087 - DOI
    1. Shrock E, Fujimura E, Kula T, Timms RT, Lee I-H, Leng Y, et al.; MGH COVID-19 Collection & Processing Team. Viral epitope profiling of COVID-19 patients reveals cross-reactivity and correlates of severity. Science. 2020;370:eabd4250. 10.1126/science.abd4250 - DOI - PMC - PubMed
    1. Nguyen-Contant P, Embong AK, Kanagaiah P, Chaves FA, Yang H, Branche AR, et al. S protein-reactive IgG and memory B cell production after human SARS-CoV-2 infection includes broad reactivity to the S2 subunit. MBio. 2020;11:e01991–20. 10.1128/mBio.01991-20 - DOI - PMC - PubMed
    1. Huey L, Andersen G, Merkel PA, Morrison TE, McCarthy M, DomBourian MG, et al. Evaluation of a multiplexed coronavirus antigen array for detection of SARS-CoV-2 specific IgG in COVID-19 convalescent plasma. J Immunol Methods. 2021;497:113104. 10.1016/j.jim.2021.113104 - DOI - PMC - PubMed

Publication types