. 2022 Nov;298(11):102580.
doi: 10.1016/j.jbc.2022.102580. Epub 2022 Oct 8.

Angiotensin II receptor type 1 blockade regulates Klotho expression to induce TSC2-deficient cell death

Affiliations

Angiotensin II receptor type 1 blockade regulates Klotho expression to induce TSC2-deficient cell death

Shikshya Shrestha et al. J Biol Chem. 2022 Nov.

Abstract

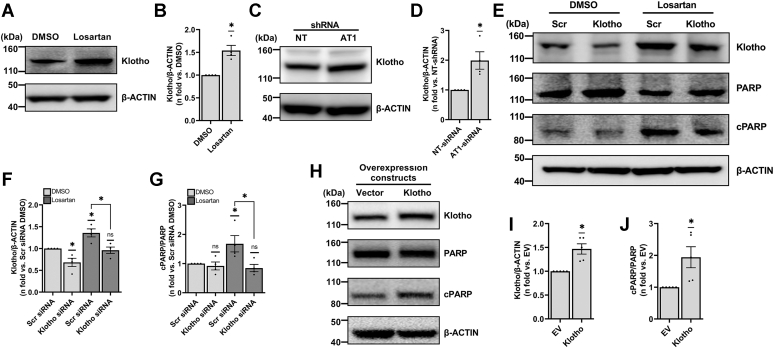
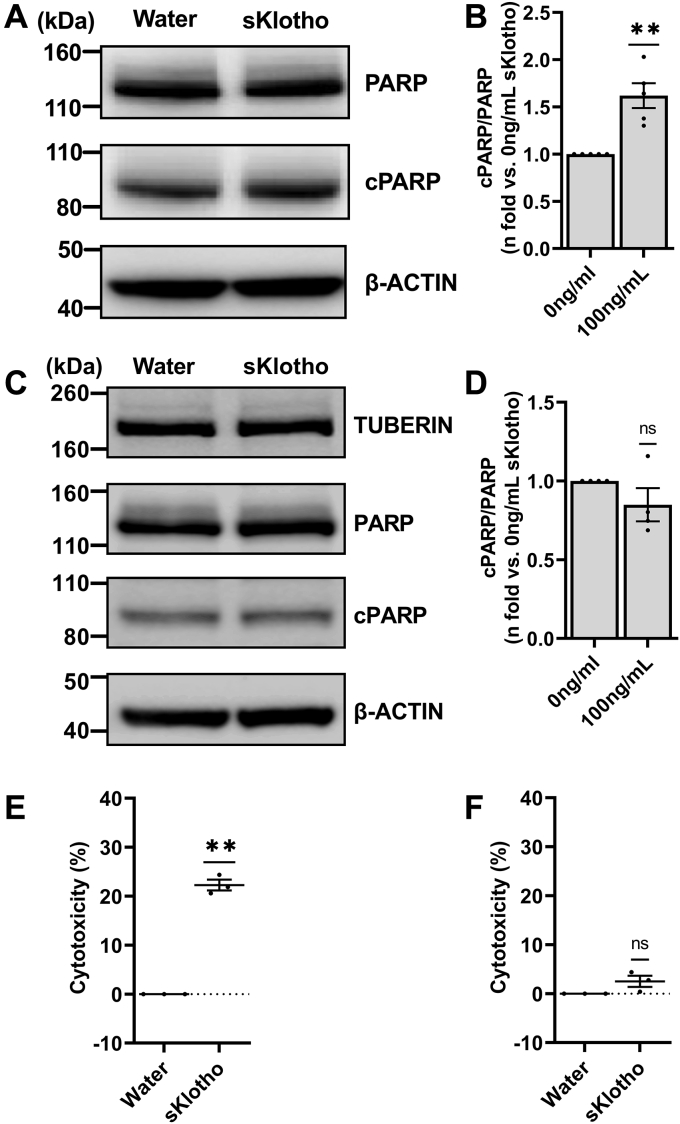
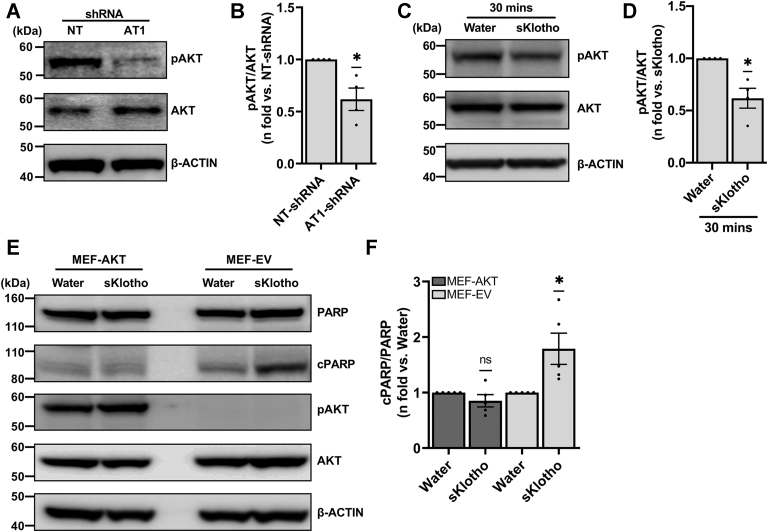
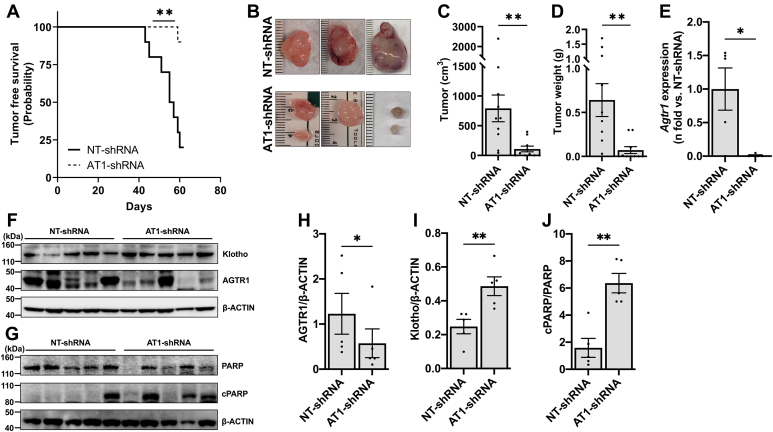
Lymphangioleiomyomatosis (LAM) is a multisystem disease occurring in women of child-bearing age manifested by uncontrolled proliferation of smooth muscle-like "LAM" cells in the lungs. LAM cells bear loss-of-function mutations in tuberous sclerosis complex (TSC) genes TSC1 and/or TSC2, causing hyperactivation of the proliferation promoting mammalian/mechanistic target of Rapamycin complex 1 pathway. Additionally, LAM-specific active renin-angiotensin system (RAS) has been identified in LAM nodules, suggesting this system potentially contributes to neoplastic properties of LAM cells; however, the role of this renin-angiotensin signaling is unclear. Here, we report that TSC2-deficient cells are sensitive to the blockade of angiotensin II receptor type 1 (Agtr1). We show that treatment of these cells with the AGTR1 inhibitor losartan or silencing of the Agtr1 gene leads to increased cell death in vitro and attenuates tumor progression in vivo. Notably, we found the effect of Agtr1 blockade is specific to TSC2-deficient cells. Mechanistically, we demonstrate that cell death induced by Agtr1 inhibition is mediated by an increased expression of Klotho. In TSC2-deficient cells, we showed overexpression of Klotho or treatment with recombinant (soluble) Klotho mirrored the cytocidal effect of angiotensin blockade. Furthermore, Klotho treatment decreased the phosphorylation of AKT, potentially leading to this cytocidal effect. Conversely, silencing of Klotho rescued TSC2-deficient cells from cell death induced by Agtr1 inhibition. Therefore, we conclude that Agtr1 and Klotho are important for TSC2-deficient cell survival. These findings further illuminate the role of the RAS in LAM and the potential of targeting Agtr1 inhibition in TSC2-deficient cells.

Keywords: Agtr1; LAM; angiotensin II; cell death; klotho; losartan; receptor; signaling; tuberin.


Conflict of interest statement

Conflict of interest The authors declare that they have no conflicts of interest with the contents of this article.

Figures

Figure 1
Figure 1
Inhibition of AGTR1 induces TSC2-deficient cell death in vitro. A, TSC2-deficient ELT3V cells were starved overnight and treated with DMSO (vehicle control) or losartan (100 nM) for 24 h in 0.5% serum supplemented media. Equal amounts of protein from whole-cell lysates of treated cells were analyzed by Western blot. Representative blots for PARP, cleaved PARP (cPARP), and β-ACTIN (loading control) are shown. B, histogram for cPARP/PARP is presented as the fold change relative to DMSO-treated ELT3V cells. C, scatter plot for LDH release by ELT3V cells treated with DMSO or losartan is presented as percent cytotoxicity. No drug (or water control) samples were used as “low control” for LDH measurement. D, Sh-RNA–mediated Agtr1 knockdown (AT1-shRNA) in ELT3V cells. D, quantitative PCR analysis of shRNA-mediated knockdown of Agtr1. Histogram for Agtr1 mRNA expression in ELT3V cells targeted with control (NT-shRNA) and AT1-shRNA is presented. B2m was used as a housekeeping gene. E, representative blots for AGTR1, cPARP, PARP, and β-ACTIN (loading control). Equal amounts of protein from whole-cell lysates of NT-shRNA and AT1-shRNA cells were analyzed by Western blot. Histograms for (F) AGTR1/β-ACTIN and (G) cPARP/PARP are expressed as the fold change relative to NT-shRNA cells. H, scatter plot for LDH release by NT-shRNA and AT1-shRNA presented as percent cytotoxicity. NT-shRNA samples were used as “low control” for LDH measurement. All graphs represent mean ± SEM of at least three independent experiments. Each biological replicate value is presented as a full circle. Statistical significance of ∗p < 0.05 or ∗∗p < 0.01 was determined by (B, D, and F–H) one-sample t test or (C) two-tailed t test. AGTR, angiotensin II receptor; cPARP, cleaved PARP; DMSO, dimethyl sulfoxide; LDH, lactate hydrogenase; NT-shRNA, nontarget shRNA; PARP, poly(ADP-ribose) polymerase; TSC, tuberous sclerosis complex.
Figure 2
Figure 2
AGTR1 blockade–mediated TSC2-deficient cell death is Klotho-dependent. A, TSC2-deficient ELT3V cells were starved overnight and treated with DMSO or losartan (100 nM) for 24 h in 0.5% serum supplemented media. Equal amounts of protein isolated from whole-cell lysates of treated cells were analyzed by Western blot. Representative blots for Klotho and β-ACTIN (same membrane as Fig. 1A) are shown. B, histogram for Klotho/β-ACTIN is presented as the fold change relative to DMSO-treated ELT3V cells. C, equal amounts of lysates extracted from NT-shRNA and AT1-shRNA ELT3V cells were analyzed by Western blot. Representative blots for Klotho and β-ACTIN (same membrane as Fig. 1E) are shown. D, histogram for Klotho/β-ACTIN is presented as the fold change relative to NT-shRNA–treated ELT3V cells. E, ELT3V cells were transfected with Scr or Klotho siRNA, starved overnight, and treated with losartan (100 nM) for 24 h. Equal amounts of lysates were analyzed by Western blot. Representative blots for Klotho, cPARP, PARP, and β-ACTIN (loading control) are shown. Histograms for (F) Klotho/β-ACTIN and (G) cPARP/PARP are presented as fold change relative to Scr siRNA-transfected cells treated with DMSO. H, ELT3V cells were transfected with an empty vector or Klotho construct for 48 h. Equal amounts of lysates extracted were subjected to Western blot analysis. Representative blots for Klotho, cPARP, PARP, and β-ACTIN (loading control) are shown. Histogram for (I) Klotho/β-ACTIN and (J) cPARP/PARP are presented as fold change relative to vector transfected cells. All graphs represent mean ± SEM of at least three independent experiments. Each biological replicate value is presented as a full circle. Statistical significance of ∗p < 0.05 for each graph was determined by one-sample t test. AGTR, angiotensin II receptor; cPARP, cleaved PARP; DMSO, dimethyl sulfoxide; NT-shRNA, nontarget shRNA; PARP, poly(ADP-ribose) polymerase; TSC, tuberous sclerosis complex.
Figure 3
Figure 3
Soluble Klotho treatment induces cell death only in TSC2-deficient cells but not TSC2-addback cells. Representative blots for cPARP, PARP, TUBERIN, and β-ACTIN (loading control) in (A) TSC2-deficient ELT3V cells and (C) TSC2-addback ELT3T cells starved overnight and then treated with vehicle control (water, 0 ng/ml sKlotho) or sKlotho (100 ng/ml) for 24 h in serum starved conditions are shown. Equal amounts of lysates extracted from treated cells were subjected to Western blot analysis. Histograms for cPARP/PARP expression in (B) ELT3V and (D) ELT3T cells are presented as fold change relative to control (0 ng/ml sKlotho). Scatter plot of LDH release presented as percent cytotoxicity after exposure of (E) ELT3V and (F) ELT3T cells to water and sKlotho treatment. Water-treated samples are used as “low control” for percent cytotoxicity calculation. All graphs represent mean ± SEM of at least three independent experiments. Each biological replicate value is presented as a full circle. Statistical significance of ns p > 0.05 or ∗∗p < 0.01 were determined by one-sample t test. cPARP, cleaved PARP; LDH, lactate hydrogenase; PARP, poly(ADP-ribose) polymerase; sKlotho, soluble Klotho; TSC, tuberous sclerosis complex.
Figure 4
Figure 4
TSC2-deficient cell death is induced by a Klotho-mediated effect on pAKT. A, equal amounts of lysates extracted from NT-shRNA and AT1-shRNA ELT3V cells were analyzed by Western blot. Representative blots for pAKT, AKT, and β-ACTIN (loading control) are shown. B, histograms for pAKT/AKT is presented as the fold change relative to NT-shRNA–treated ELT3V cells. C, TSC2-deficient ELT3V cells were starved overnight and treated with vehicle control (water) or sKlotho (100 ng/ml) for indicated amount of time in serum-starved condition. Equal amounts of lysates extracted from treated cells were subjected to Western blot analysis. Representative blots for phosphorylated(p)AKT, AKT, and β-ACTIN (loading control) are shown. D, histogram for pAKT/AKT is presented as fold change relative to control (0 ng/ml sKlotho). E, TSC2-deficient MEF-AKT and MEF-EV cells were starved overnight and treated with vehicle control (water) or sklotho (100 ng/ml) for 24 h. Equal amounts of lysates extracted from MEF-EV– and MEF-AKT–treated cells were subjected to Western blot analysis. Representative blots for cPARP, total PARP, and β-ACTIN (loading control) are shown. (F) histogram for cPARP/PARP expressions in MEF-EV and MEF-AKT is presented as fold change relative to water control (0 ng/ml sKlotho). All graphs represent mean ± SEM of at least three independent experiments. Each biological replicate value is presented as a full circle. Statistical significance of ns p > 0.05 or ∗p < 0.05 were determined by one-sample t test. cPARP, cleaved PARP; EV, empty vector; MEF, mouse embryonic fibroblasts; NT-shRNA, nontarget shRNA; PARP, poly(ADP-ribose) polymerase; TSC, tuberous sclerosis complex.
Figure 5
Figure 5
AGTR1 blockade impairs TSC2-deficient null xenograft tumor development. Female CB17-SCID mice were inoculated with 2.5 million control (NT-shRNA) or Agtr1 shRNA (AT1-shRNA)-transfected ELT3V cells subcutaneously into suprascapular region (n = 10 per group). Tumor length and width were measured daily with a caliper by a blinded investigator, and surface area was calculated. A, tumor-free survival analyses of mice in each group are plotted. Statistical significance ∗∗p < 0.01 was determined by Log-rank test. B, representative gross appearance of excised tumors is displayed. The scale bar represents 1 cm. Comparison of (C) average volume and (D) weight of the excised tumors. E, RNA was extracted from excised tumors and qPCR was performed analyzing Agtr1 expression. B2m was used as housekeeping gene. F, representative blots for AGTR1, Klotho, and (G) cPARP, PARP, and β-ACTIN (loading control) for protein isolated from excised tumors are shown. Histograms for (H) AGTR1/β-ACTIN, (I) Klotho/β-ACTIN, and (J) cPARP/PARP expressions are presented as mean ± SEM. Each biological replicate value is presented as a full circle. Statistical significance of ∗p < 0.05 or ∗∗p < 0.01 was determined by a two-tailed t test. AGTR, angiotensin II receptor; cPARP, cleaved PARP; NT-shRNA, nontarget shRNA; PARP, poly(ADP-ribose) polymerase; TSC, tuberous sclerosis complex.
Figure 6
Figure 6
AGTR1 blockade induces cell death in TSC2-deficient 105K cells in vitro and impairs xenograft tumor development in vivo. A, TSC2-deficient 105K cells were starved overnight and treated with DMSO or losartan (100 nM) for 24 h in 0.5% serum supplemented media. Equal amounts of lysates from treated cells were analyzed by Western blot. Representative blots for Klotho, cleaved PARP, total PARP, and β-ACTIN are shown. Histograms for (B) Klotho/β-ACTIN and (C) cPARP/PARP are presented as fold change relative to DMSO. D, scatter plot of 105K cells LDH release treated with DMSO or losartan presented as percent cytotoxicity. No drug (or water control) samples were used as “low control” for LDH measurement. E, cell viability was measured by the deep blue cell viability assay and values for losartan treatment are presented as percent of DMSO-treated cells. F, equal amounts of lysates extracted from 105K cells treated with sKlotho were subjected to Western blot analysis. Representative blots for pAKT, AKT, and β-ACTIN (loading control) are shown. G, histogram for pAKT/AKT is presented as fold change relative to control (0 ng/ml sKlotho). H, cell viability was measured using a deep blue cell viability assay and values for sKlotho treatment are presented as percent of water (vehicle)-treated cells. All graphs represent mean ± SEM of at least three independent experiments. Each biological replicate value is presented as a full circle. Pairwise comparisons are presented for significant differences: statistical significances of ∗p < 0.05 or ∗∗p < 0.01 were determined by (B, C, E, and G–H) one-sample t test or (D) two-tailed t test. I, growth comparison of xenograft tumors TSC2-deficient 105K tumors in vivo treated with vehicle (DMSO) or losartan (30 mg/kg) by oral gavage. Arrow indicates the start of losartan treatment. Statistical significance of ∗∗∗p <0.001 for each day was determined by two-tailed t test. AGTR, angiotensin II receptor; cPARP, cleaved PARP; DMSO, dimethyl sulfoxide; LDH, lactate hydrogenase; PARP, poly(ADP-ribose) polymerase; TSC, tuberous sclerosis complex.

References

    1. Carsillo T., Astrinidis A., Henske E.P. Mutations in the tuberous sclerosis complex gene TSC2 are a cause of sporadic pulmonary lymphangioleiomyomatosis. Proc. Natl. Acad. Sci. U. S. A. 2000;97:6085–6090. - PMC - PubMed
    1. Smolarek T.A., Wessner L.L., McCormack F.X., Mylet J.C., Menon A.G., Henske E.P. Evidence that lymphangiomyomatosis is caused by TSC2 mutations: chromosome 16p13 loss of heterozygosity in angiomyolipomas and lymph nodes from women with lymphangiomyomatosis. Am. J. Hum. Genet. 1998;62:810–815. - PMC - PubMed
    1. Chan J.A., Zhang H., Roberts P.S., Jozwiak S., Wieslawa G., Lewin-Kowalik J., et al. Pathogenesis of tuberous sclerosis subependymal giant cell astrocytomas: biallelic inactivation of TSC1 or TSC2 leads to mTOR activation. J. Neuropathol. Exp. Neurol. 2004;63:1236–1242. - PubMed
    1. El-Hashemite N., Zhang H., Henske E.P., Kwiatkowski D.J. Mutation in TSC2 and activation of mammalian target of rapamycin signalling pathway in renal angiomyolipoma. Lancet. 2003;361:1348–1349. - PubMed
    1. McCormack F.X., Travis W.D., Colby T.V., Henske E.P., Moss J. Lymphangioleiomyomatosis: calling it what it is: a low-grade, destructive, metastasizing neoplasm. Am. J. Respir. Crit. Care Med. 2012;186:1210–1212. - PMC - PubMed

Publication types

Substances