. 2022 Oct 11;13(1):5956.
doi: 10.1038/s41467-022-33401-x.

S100A8-mediated metabolic adaptation controls HIV-1 persistence in macrophages in vivo

Affiliations

S100A8-mediated metabolic adaptation controls HIV-1 persistence in macrophages in vivo

Fernando Real et al. Nat Commun. .

Abstract

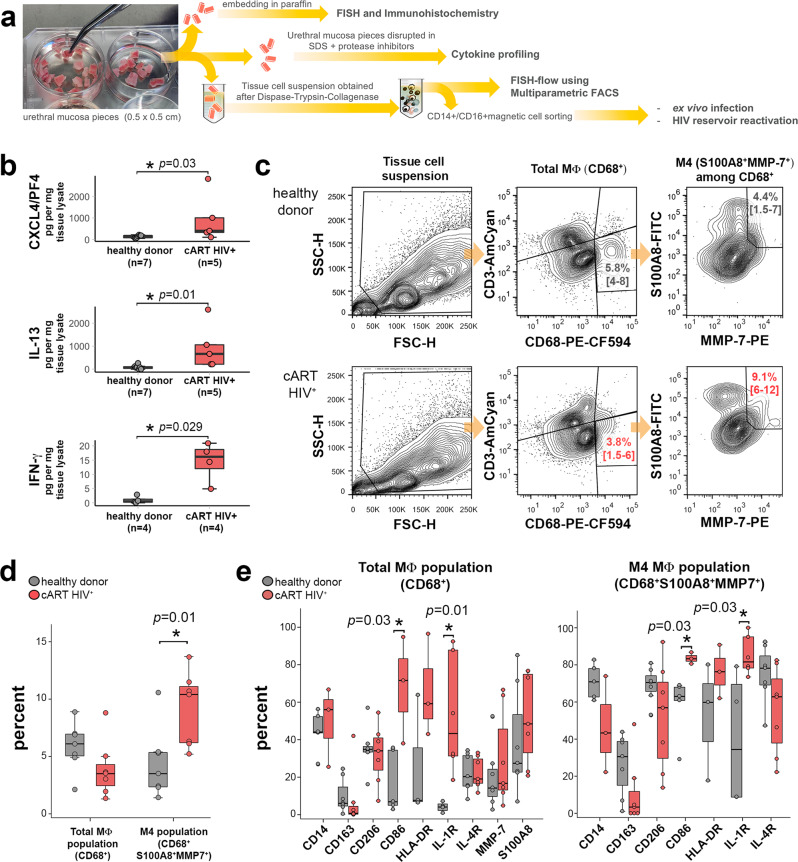
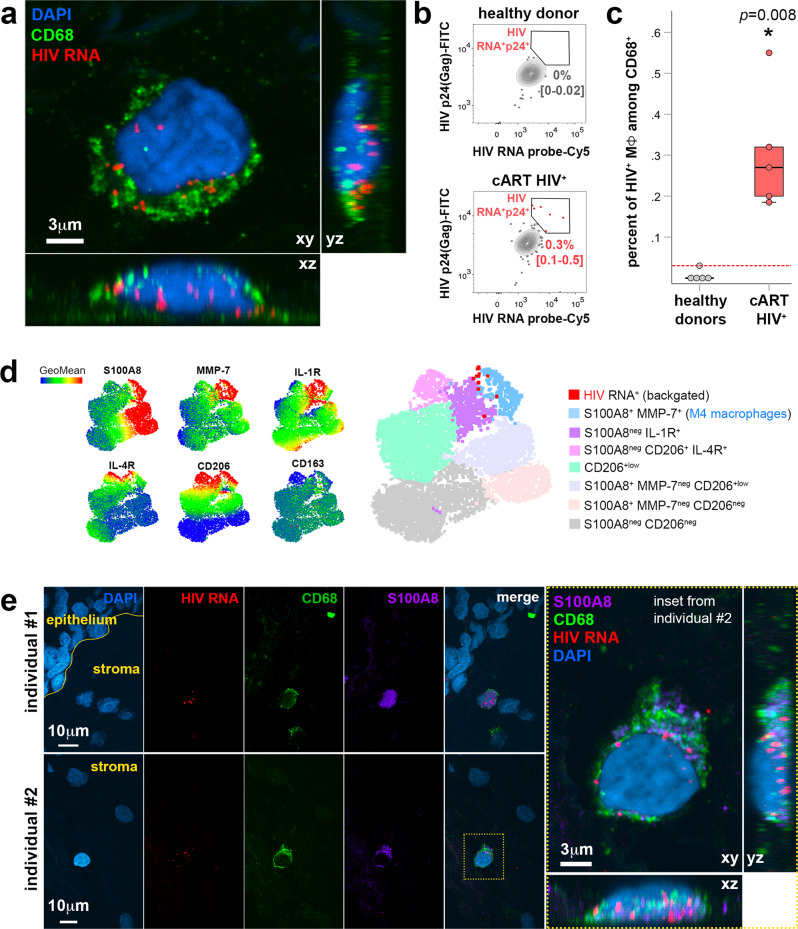
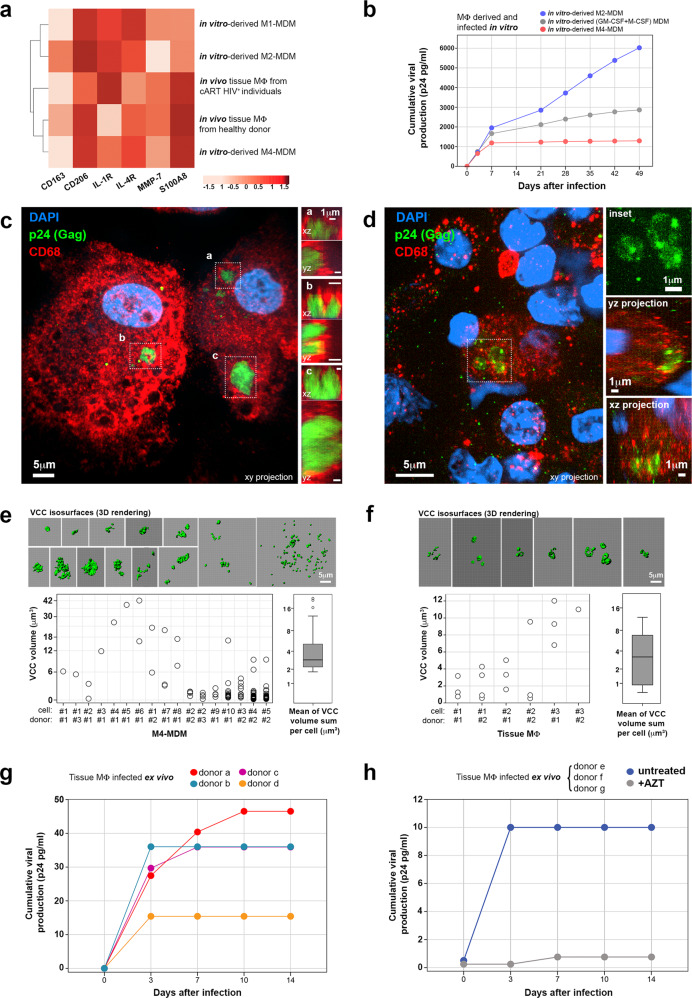
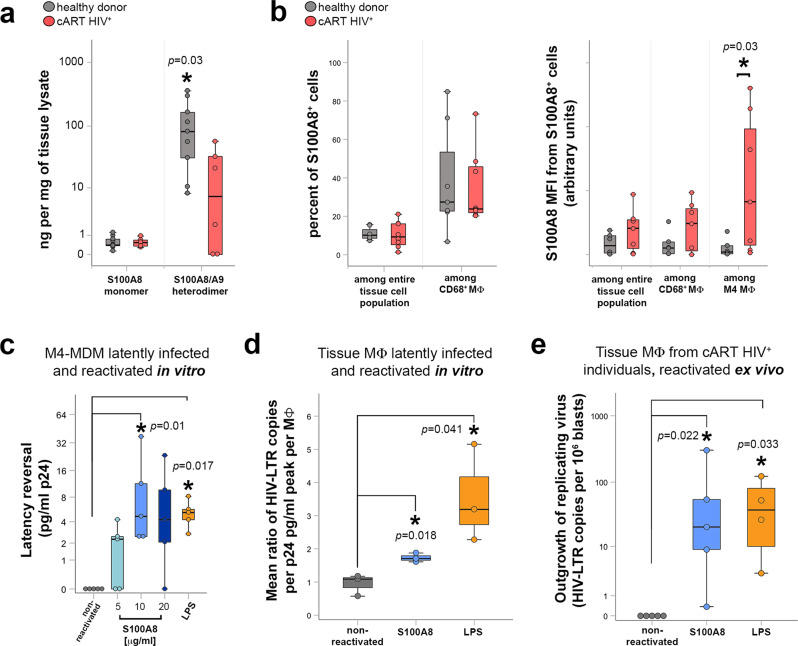
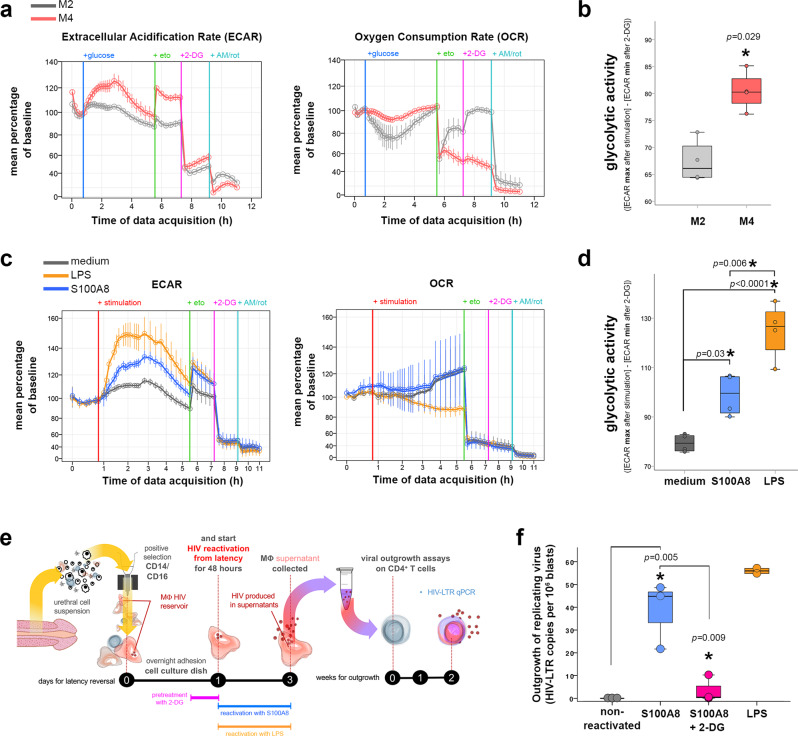
HIV-1 eradication is hindered by viral persistence in cell reservoirs, established not only in circulatory CD4+T-cells but also in tissue-resident macrophages. The nature of macrophage reservoirs and mechanisms of persistence despite combined anti-retroviral therapy (cART) remain unclear. Using genital mucosa from cART-suppressed HIV-1-infected individuals, we evaluated the implication of macrophage immunometabolic pathways in HIV-1 persistence. We demonstrate that ex vivo, macrophage tissue reservoirs contain transcriptionally active HIV-1 and viral particles accumulated in virus-containing compartments, and harbor an inflammatory IL-1R+S100A8+MMP7+M4-phenotype prone to glycolysis. Reactivation of infectious virus production and release from these reservoirs in vitro are induced by the alarmin S100A8, an endogenous factor produced by M4-macrophages and implicated in "sterile" inflammation. This process metabolically depends on glycolysis. Altogether, inflammatory M4-macrophages form a major tissue reservoir of replication-competent HIV-1, which reactivate viral production upon autocrine/paracrine S100A8-mediated glycolytic stimulation. This HIV-1 persistence pathway needs to be targeted in future HIV eradication strategies.


Conflict of interest statement

The authors declare no competing interests.

Figures

Fig. 1
Fig. 1. Inflammatory M4-macrophages are enriched in the urethral mucosa of cART-suppressed HIV-1-infected individuals.
a Scheme of the different methods applied to evaluate morphologically and functionally the mucosal macrophage HIV reservoir, from processing 0.5 × 0.5 cm mucosal tissue pieces obtained from individuals that underwent gender reassignment. b CXCL4/PF4, IL-13, and IFN-γ cytokine profile of urethral tissue extracts of healthy donors (gray) and cART-suppressed HIV-infected (cART HIV+) individuals (red). The number of individual samples (n) included in the analysis is shown per group and cytokine tested. Mann–Whitney test performed for pairwise comparisons between the two groups of individuals and per cytokine. Source data are provided in Source Data file. c Flow cytometry gating strategy for characterization of M4-macrophage subtype in healthy donors (upper example) and cART-suppressed HIV-infected individuals (lower example). From CD68+ CD3neg events (total MΦ), M4-macrophages are defined as S100A8+MMP7+ events. Frequencies of total MΦ and of M4-macrophages among total MΦ are shown as mean with 95% confidence interval in brackets. d Percentage of total MΦ among the tissue cell suspension (Total MΦ population) and percentage of M4-macrophages among the total MΦ population (M4 MΦ in total MΦ) in healthy donors (gray, n = 7) and cART-suppressed HIV-infected individuals (red, n = 7). Mann–Whitney test between healthy donor and cART HIV+ group. Source data are provided in Source Data file. e Frequency in percentage of macrophage polarization markers displayed by total MΦ among the tissue cell suspension (Total MΦ population, left graph) and M4-macrophages (M4-macrophages population, right graph) in healthy donors (gray, n = 7) and cART-suppressed HIV-infected individuals (red, n = 7). Mann–Whitney test between healthy donor and cART HIV+ group. Source data are provided in Source Data file.
Fig. 2
Fig. 2. HIV-1 mucosal macrophage reservoirs form in inflammatory IL-1R+ M4-macrophages in vivo as detected at single-cell level.
a Identification of HIV reservoir in macrophages identified by HIV RNA detection using FISH coupled to CD68 immunostaining on paraffin-embedded urethral tissue sections from a cART-treated HIV-infected individual. HIV RNA in red, macrophage marker CD68 in green, nuclei stained with DAPI (blue). Image shows the different fluorescent channels of a macrophage HIV reservoir and a high-magnification inset on the right with these channels merged. Bar = 3 μm (inset). Image is representative of two cART-treated HIV-infected individual samples. b Representative flow cytometry gating of HIV RNA+p24-Gag+ events acquired in total urethral MΦ population obtained from a healthy donor (upper) and a cART-suppressed HIV-infected individual (lower). Frequencies of HIV RNA+/p24-Gag+ MΦ among total MΦ are shown as mean with 95% confidence interval in brackets (n = 5 healthy donors, n = 5 cART HIV-infected individuals). c Percentage of HIV RNA+p24-Gag+ events acquired in total urethral MΦ population obtained from these two groups of individuals (n = 5 healthy donors, n = 5 cART HIV-infected individuals). Dotted red line indicates limit of detection based on healthy donor controls. Mann–Whitney test. Source data are provided in Source Data file. d UMAP built from concatenating CD68+ cell populations of different cART HIV+ individuals (n = 4) after clustering analysis of macrophage populations. HIV+ macrophages were backgated into the UMAP to identify which macrophage profile harbors HIV in cART-treated individuals. e S100A8 is expressed by HIV reservoir macrophages as shown by colocalization of HIV RNA detected using FISH coupled to CD68 and S100A8 immunostaining on paraffin-embedded urethral tissue sections from two cART-treated HIV-infected individuals (#1 and #2). HIV RNA in red, macrophage marker CD68 in green, S100A8 in magenta, nuclei stained with DAPI (blue). Image shows the different fluorescent channels (separated and merged) of the detected macrophage HIV reservoirs found in the mucosal stroma. A high-magnification inset for the one detected in individual #2 is shown on the right, with fluorescent channels merged. Bar = 10 or 3 μm (inset).
Fig. 3
Fig. 3. M4-MDM and tissue macrophages from healthy donors infected in vitro/ex vivo are surrogates of HIV-1 mucosal macrophage reservoirs.
a Hierarchical clustering heatmap of macrophage polarization markers and different macrophage subtypes (obtained in vivo or in vitro derived by different stimuli). The intensity of the red color boxes refers to correlation z-scores. Data were obtained from four independent experiments. Source data are provided in Source Data file. b Cumulative viral production assessed in in vitro-derived MΦ culture supernatants on different days after infection. M2-MDM in blue, non-polarized GM-CSF/M-CSF-derived MDM in gray, and M4-MDM in red. Data refer to one experiment representative of three independent experiments. Source data are provided in Source Data file. c, d Confocal microscope images of M4-MDM latently infected in vitro (34 days post-infection) (n = 3) (c) and infected tissue macrophage obtained from cART-suppressed HIV-infected individuals (n = 2) (d), immunolabeled for p24-Gag (green) and CD68 (red). Nuclei were stained with DAPI. Merged images are shown as xy projections (main images) and xz/yz projections (framed VCC a, VCC b and VCC c in C right insets, and in D, lower right insets). In D, VCCs framed and magnified in the upper-right inset showing p24-Gag+ fluorescence signal only. Bar = 1, 5, or 10 μm. e, f Volumetric morphometry of VCCs in infected macrophages obtained from M4-MDM latently infected in vitro (n = 3) (e) or cART-suppressed HIV-infected tissues (n = 2 individuals) (f) after image segmentation in VCC isosurfaces. Dot plots show the volumes (μm3) of each VCC isosurface detected in different macrophages (identified by number #) obtained from different donors (identified by donor number #). Boxplots represent the sum of VCC volumes per macrophage. Upper panels show VCC isosurfaces (in green, 3D rendering) segmented from the confocal images of infected macrophages. Source data are provided in Source Data file. g Cumulative viral production assessed in the supernatants of tissue macrophages obtained from healthy donors (discriminated by different colors, n = 4) and infected ex vivo on different days after infection. Source data are provided in Source Data file. h Cumulative viral production measured in the supernatants of ex vivo-infected urethral macrophages (pool of three healthy donors) in the absence or presence of 10 μM AZT. Source data are provided in Source Data file.
Fig. 4
Fig. 4. S100A8 reactivate the production of replication-competent virus from tissue macrophage reservoirs.
a Quantification of S100A8 monomers and S100A8/S100A9 heterodimers in urethral tissue extracts of healthy donors (gray, n = 9) and cART-suppressed HIV-infected individuals (cART HIV+) (red, n = 6). Mann–Whitney test between healthy donor and cART HIV+ group. Source data are provided in Source Data file. b S100A8 cellular expression quantified by flow cytometry of urethral cell suspensions expressed as percentage of S100A8+ cells among the entire tissue cell population and among CD68+ MΦ, or as S100A8 Mean Fluorescence Intensity (MFI) in S100A8+ cells detected among the entire tissue cell population, among CD68+MΦ, or among M4 MΦ. Mann–Whitney test between healthy donor (n = 5) and cART HIV+ group (n = 7). Source data are provided in Source Data file. c Viral production quantified in M4-MDM culture supernatants after latent infection followed by 2 days of latency reversal induced by indicated S100A8 concentrations or 1 μg/mL LPS. Non-reactivated controls refer to untreated M4-MDM latently infected macrophages. Mann–Whitney test between non-reactivated (untreated) and treated groups pairwise. Data were obtained from five independent experiments. Source data are provided in Source Data file. d HIV-1 latency reversal of tissue macrophages obtained from healthy donors latently infected ex vivo (n = 3), expressed as ratio between macrophage-associated HIV-LTR RNA copies per MΦ and the peak cumulative viral production per MΦ before latency, after 2 days of S100A8 or LPS treatment. Non-reactivated controls refer to ratio from untreated latently infected tissue macrophages. Mann–Whitney test between non-reactivated (untreated) and treated groups pairwise. Source data are provided in Source Data file. e Outgrowth of replicating virus produced by tissue macrophage reservoirs obtained from cART-suppressed HIV-infected individuals after S100A8- or LPS-induced latency reversal, expressed as HIV LTR RNA copies per million CD4+ T-cell lymphoblasts from the outgrowth assays. Non-reactivated controls refer to untreated tissue macrophage reservoirs. Pairwise Mann–Whitney test between non-reactivated (untreated, n = 5) and treated groups (S100A8, n = 5; LPS, n = 4). Source data are provided in Source Data file.
Fig. 5
Fig. 5. S100A8-mediated reactivation of HIV macrophage reservoirs depends on a glycolytic metabolic shift.
a Extracellular acidification (ECAR) and oxygen consumption rate (OCR) of M2-MDM (gray) or M4-MDM (red) cultures measured after sequential addition of Seahorse medium with glucose, etomoxir (eto), 2-deoxyglucose (2-DG) and antimycin/rotenone (AM/rot). Results are shown as mean percentages (±SEM) of rate increase/decrease from baseline rate (time point before glucose injection) for each technical replicate. Data obtained from n = 4 independent experiments. Source data are provided in Source Data file. b Glycolytic activity of M2-MDM (gray) or M4-MDM (red) groups, which refers to the maximum ECAR reached after glucose injection deduced from the minimum ECAR reached after 2-DG injection. Mann–Whitney test. Data obtained from n = 4 independent experiments. Source data are provided in Source Data file. c ECAR and OCR measured in M4-MDM cultures non-stimulated (medium with glucose) or stimulated with S100A8 or LPS in the presence of glucose, followed by sequential injection of etomoxir (eto), 2-deoxyglucose (2-DG) and antimycin/rotenone (AM/rot). Results are displayed as mean percentages (±SEM) of rate increase/decrease from baseline rate (time point before glucose injection) for each technical replicate. Data obtained from n = 4 independent experiments. Source data are provided in Source Data file. d Glycolytic activity of non-stimulated and S100A8- or LPS-stimulated M4-MDM. ANOVA with Bonferroni post hoc test. Data obtained from n = 4 independent experiments. Source data are provided in Source Data file. e, f Outgrowth of replicating virus produced by tissue macrophage reservoirs obtained from cART-suppressed HIV-infected individuals after S100A8 latency reversal with or without 2-DG pretreatment. e Scheme of the experiment measuring the reactivation of macrophage HIV reservoirs obtained in vivo from urethral tissues ex vivo using the different stimuli, namely S100A8, S100A8 preceded by a 2-DG pretreatment, and LPS. The supernatants of reactivated macrophages were added to CD4+T cells in an outgrowth assay which readout is the detection of HIV RNA in the CD4+T cells by qPCR. f Outgrowth of virus produced by reactivated macrophage HIV reservoirs expressed as cell-associated HIV LTR RNA copies per million CD4+ T-cell lymphoblasts employed in outgrowth assays. Non-reactivated controls refer to untreated tissue macrophage reservoirs. ANOVA with Bonferroni correction. Data were obtained from three different cART HIV-infected individuals. Source data are provided in Source Data file.

Similar articles

Cited by

References

    1. Honeycutt JB, et al. HIV persistence in tissue macrophages of humanized myeloid-only mice during antiretroviral therapy. Nat. Med. 2017;23:638–643. doi: 10.1038/nm.4319. - DOI - PMC - PubMed
    1. Stevenson M. Role of myeloid cells in HIV-1-host interplay. J. Neurovirol. 2015;21:242–248. doi: 10.1007/s13365-014-0281-3. - DOI - PMC - PubMed
    1. Cassol E, Cassetta L, Rizzi C, Alfano M, Poli G. M1 and M2a polarization of human monocyte-derived macrophages inhibits HIV-1 replication by distinct mechanisms. J. Immunol. 2009;182:6237–6246. doi: 10.4049/jimmunol.0803447. - DOI - PubMed
    1. Carter CA, Ehrlich LS. Cell biology of HIV-1 infection of macrophages. Annu. Rev. Microbiol. 2008;62:425–443. doi: 10.1146/annurev.micro.62.081307.162758. - DOI - PubMed
    1. Swingler S, Mann AM, Zhou J, Swingler C, Stevenson M. Apoptotic killing of HIV-1-infected macrophages is subverted by the viral envelope glycoprotein. PLoS Pathog. 2007;3:1281–1290. doi: 10.1371/journal.ppat.0030134. - DOI - PMC - PubMed

Publication types