Investigating the causal relationships between excess adiposity and cardiometabolic health in men and women
- PMID: 36221008
- PMCID: PMC9807546
- DOI: 10.1007/s00125-022-05811-5
Investigating the causal relationships between excess adiposity and cardiometabolic health in men and women
Erratum in
-
Correction: Investigating the causal relationships between excess adiposity and cardiometabolic health in men and women.Diabetologia. 2024 Sep;67(9):2015. doi: 10.1007/s00125-024-06168-7. Diabetologia. 2024. PMID: 38949672 Free PMC article. No abstract available.
Abstract
Aims/hypothesis: Excess adiposity is differentially associated with increased risk of cardiometabolic disease in men and women, according to observational studies. Causal inference studies largely assume a linear relationship between BMI and cardiometabolic outcomes, which may not be the case. In this study, we investigated the shapes of the causal relationships between BMI and cardiometabolic diseases and risk factors. We further investigated sex differences within the causal framework.
Methods: To assess causal relationships between BMI and the outcomes, we used two-stage least-squares Mendelian randomisation (MR), with a polygenic risk score for BMI as the instrumental variable. To elucidate the shapes of the causal relationships, we used a non-linear MR fractional polynomial method, and used piecewise MR to investigate threshold relationships and confirm the shapes.
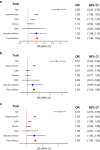
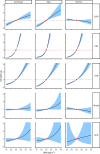
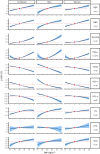
Results: BMI was associated with type 2 diabetes (OR 3.10; 95% CI 2.73, 3.53), hypertension (OR 1.53; 95% CI 1.44, 1.62) and coronary artery disease (OR 1.20; 95% CI 1.08, 1.33), but not chronic kidney disease (OR 1.08; 95% CI 0.67, 1.72) or stroke (OR 1.08; 95% CI 0.92, 1.28). The data suggest that these relationships are non-linear. For cardiometabolic risk factors, BMI was positively associated with glucose, HbA1c, triacylglycerol levels and both systolic and diastolic BP. BMI had an inverse causal relationship with total cholesterol, LDL-cholesterol and HDL-cholesterol. The data suggest a non-linear causal relationship between BMI and BP and other biomarkers (p<0.001) except lipoprotein A. The piecewise MR results were consistent with the fractional polynomial results. The causal effect of BMI on coronary artery disease, total cholesterol and LDL-cholesterol was different in men and women, but this sex difference was only significant for LDL-cholesterol after controlling for multiple testing (p<0.001). Further, the causal effect of BMI on coronary artery disease varied by menopause status in women.
Conclusions/interpretation: We describe the shapes of causal effects of BMI on cardiometabolic diseases and risk factors, and report sex differences in the causal effects of BMI on LDL-cholesterol. We found evidence of non-linearity in the causal effect of BMI on diseases and risk factor biomarkers. Reducing excess adiposity is highly beneficial for health, but there is greater need to consider biological sex in the management of adiposity.
Keywords: Cardiometabolic; Causal; Mendelian randomisation; Obesity.
© 2022. The Author(s).
Figures


References
-
- Bommer C, Sagalova V, Heesemann E et al (2018) Global economic burden of diabetes in adults: projections from 2015 to 2030. Diabetes Care 41(5):963. 10.2337/dc17-1962 - PubMed
-
- American Heart Association (2017) Cardiovascular disease: a costly burden for america projections through 2035. AHA, Washington, DC
-
- WHO (2021) The top 10 causes of death. Available from https://www.who.int/news-room/fact-sheets/detail/the-top-10-causes-of-death. Accessed 8 November 2021
Publication types
MeSH terms
Substances
LinkOut - more resources
Full Text Sources
Medical
Miscellaneous

