

Chromatin remodeling is required for sRNA-guided DNA elimination in Paramecium
- PMID: 36221862
- PMCID: PMC9670198
- DOI: 10.15252/embj.2022111839
Chromatin remodeling is required for sRNA-guided DNA elimination in Paramecium
Abstract
Small RNAs mediate the silencing of transposable elements and other genomic loci, increasing nucleosome density and preventing undesirable gene expression. The unicellular ciliate Paramecium is a model to study dynamic genome organization in eukaryotic cells, given its unique feature of nuclear dimorphism. Here, the formation of the somatic macronucleus during sexual reproduction requires eliminating thousands of transposon remnants (IESs) and transposable elements scattered throughout the germline micronuclear genome. The elimination process is guided by Piwi-associated small RNAs and leads to precise cleavage at IES boundaries. Here we show that IES recognition and precise excision are facilitated by recruiting ISWI1, a Paramecium homolog of the chromatin remodeler ISWI. ISWI1 knockdown substantially inhibits DNA elimination, quantitatively similar to development-specific sRNA gene knockdowns but with much greater aberrant IES excision at alternative boundaries. We also identify key development-specific sRNA biogenesis and transport proteins, Ptiwi01 and Ptiwi09, as ISWI1 cofactors in our co-immunoprecipitation studies. Nucleosome profiling indicates that increased nucleosome density correlates with the requirement for ISWI1 and other proteins necessary for IES excision. We propose that chromatin remodeling together with small RNAs is essential for efficient and precise DNA elimination in Paramecium.
Keywords: chromatin remodeler; genome editing; nucleosomes; small RNAs; transposable elements.
© 2022 The Authors. Published under the terms of the CC BY 4.0 license.
Figures

Predicted protein domains in ISWI1.
Phylogenetic analysis of ISWI proteins in selected organisms. Node bootstrap values below ≥ 80 are indicated by ‘•’ or are otherwise labeled.
Gene expression profile (in arbitrary units) of ISWI genes based on published RNA‐seq data (Arnaiz et al, 2010). Veg: cells undergoing vegetative division; Early: ~50% of cells with fragmented parental macronucleus (our early time point); Late: the majority of cells with a visible anlagen (our late timepoint).
Survival test graph. Dead cells are represented in red, sick in orange, and normally dividing cells in green. PGM–KD is a positive control, and ND7–KD is a negative control.
Dot blot analysis to check the effect of ISWI1‐KD on transposon elimination. Probes against transposons Sardine and Thon were used, while a probe against Actin was used as a loading control.
IES retention PCR (cropped inverted images). Four maternally‐controlled IES and four non‐maternally controlled IESs are shown. The IES+ band represents retained IES; the IES− band represents an excised IES; additional bands are likely PCR artifacts. IRS is IES retention Score for the IESs calculated after whole genome sequencing.

- A, B
Northern blot analysis using ISWI1‐specific and ISWI5‐specific probes, respectively. rRNA probe was used as a loading control against ribosomal RNA. Early: ~50% of cells with fragmented parental macronucleus; Late: the majority of cells with a visible anlagen. ND7‐KD is used as a control to confirm mRNA expression.
- C–F
(C and E) Survival test graph. Dead cells are represented in red, sick in orange and cells diving at a normal rate in green. PGM–KD is used as a positive control, and ND7–KD as a negative control. (D and F) IES retention PCR (cropped inverted images). Five maternally controlled IES and five non‐maternally controlled IESs are shown. The IES+ band represents retained IES; the IES‐band represents excised IES; additional bands are likely PCR artifacts or primer dimers.
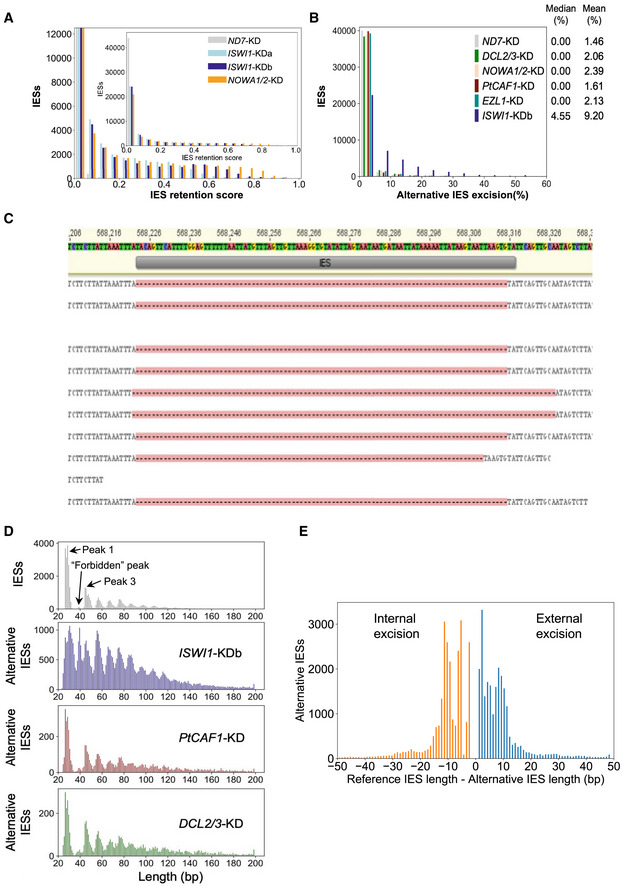
IES Retention Score (IRS) distributions for ISWI1–KD replicates and NOWA1/2‐KD. ND7‐KD was used as a negative control.
Genome‐wide analysis of alternative boundary excision in ND7‐KD, DCL2/3‐KD, NOWA1/2‐KD, EZL1‐KD, PTCAF1‐KD, and ISWI1‐KDb. Alternative excision (%) = 100*(alternative excised reads)/(alternatively + correctly excised reads).
Reads mapped to an IES (IESPGM.PTET51.1.7.550914) showing both external (2 reads) and internal (1 read) alternatively excision; gaps opened in reads with excised IESs are indicated by dashes on a pink background.
Length distribution of conventional IESs compared to alternatively excised IESs in knockdowns of ISWI1, PtCAF1, and DCL2/3.
Difference in alternative IES lengths from the reference IES length.

Relationships in IES retention among knockdown pairs. Hexagonal binning of IES retention scores was used to generate the plots. Pearson's correlation coefficients are given above each subgraph. Red lines are for ordinary least‐squares (OLS) regression, orange lines are for LOWESS, and gray lines are for orthogonal distance regression (ODR).
IRSs versus IES length as described previously.
Base frequencies of the first three bases after the TA repeat relative to the IRS of ISWI1‐KDb from the first and third Paramecium tetraurelia IES length peak.

Length distribution of internally excised alternative (Alt) IES boundaries.
Length distribution of externally alternative (Alt) excised IES boundaries, respectively.
Genome‐wide analysis of cryptic IES excision. Cryptic excision (%) = 100*(cryptically excised reads)/(all reads).
Length distribution of cryptically excised IES.
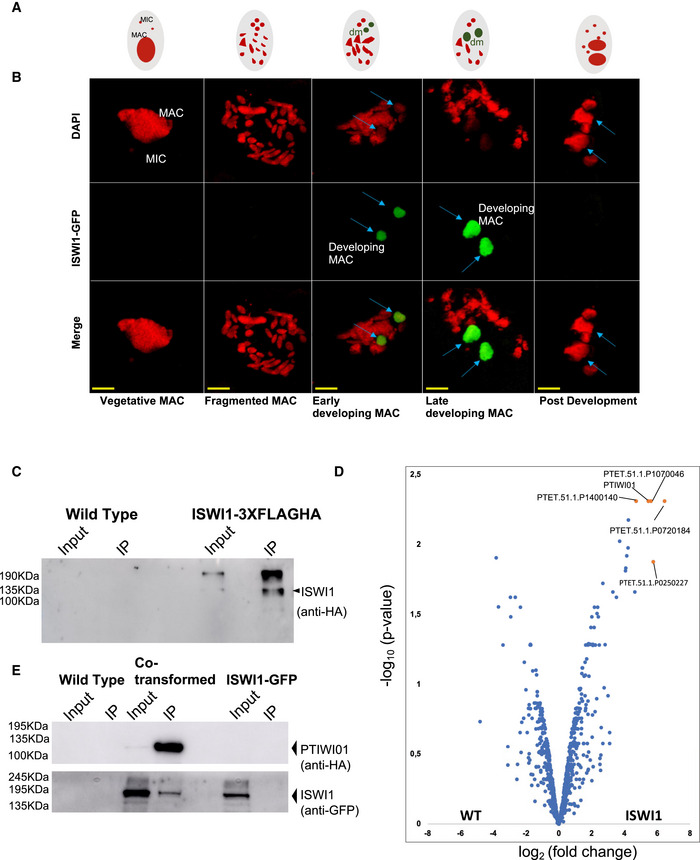
Schematic drawing of the life cycle stages of Paramecium tetraurelia. MIC and parental MAC are represented in red, representing the DAPI signal, and developing MAC (dm) is represented in green until fully developed, representing the GFP signal.
ISWI1‐tagged C‐terminally with GFP localizes in the developing MAC as soon as developing new MACs (panel Early Development) become visible and remain there throughout late MAC development (panel Late Development). Red: DAPI, Green: ISWI1–GFP. Blue arrows identify developing MAC; scale bar 10 μm.
Western blot analysis using anti‐HA antibody after coimmunoprecipitation of ISWI1‐3XFlagHA fusion protein. Non‐transformed cells (WT) of the same strain were used as the negative control. 1% of the total lysate was loaded as Input, and 20% of co‐immunoprecipitated samples were loaded on 12% SDS gel.
Volcano plot illustrating the distribution of proteins identified in label‐free MS in WT Vs. ISWI1‐3XFlagHA. Significantly abundant proteins (fold change ≥ 4) are highlighted in orange.
Western blot analysis using anti‐HA and anti‐GFP antibodies after coimmunoprecipitation of Ptiwi01‐3XFlagHA fusion protein co‐transformed with ISWI1‐GFP. Non‐transformed cells (WT) of the same strain and ISWI1‐GFP fusion protein transformation were used as negative controls. 1% of the total lysate was loaded as Input, and 20% of co‐immunoprecipitated samples were loaded on 10% SDS gel.

- A–D
(A and C) Survival test graph. Dead cells are represented in red, sick in orange and cells diving at a normal rate in green. (B and D) IES retention PCR (cropped inverted images). Mating type, 51G2832, and 51G4404 IESs are shown. The IES+ band represents retained IES; the IES‐band represents excised IES; additional bands are likely PCR artifacts or primer dimers.
- E
Most abundant proteins in the ISWI1‐3XFLAGHA MS analysis ISWI1 & ISWI2 are two biological replicates for ISWI1‐3XFLAGHA, while WT1 and WT2 are biological replicates for control in MS analysis. Peptide count refers to the number of peptides detected in MS. Adjusted P‐values were calculated following the Benjamini and Hochberg correction for multiple testing.
- F
ISWI1‐GFP localization to developing macronucleus seen in green during development; merge is an overlay of DAPI (red) staining parental and developing macronucleus, ISWI1‐GFP (green), and anti‐HA (yellow); scale bar = 10 μm.

- A, B
Nucleosome density histograms for IESs weakly (IRS < 0.2) or more strongly retained in ISWI1‐Kdb (IRS ≥ 0.2). Kolmogorov–Smirnov statistics and their P‐values are provided.
- C–F
Histograms as in (A&B), including additional length constraints, corresponding to the first IES length peak (26–31 bp; C and D) or the first non‐periodic length IESs (150–200 bp; E and F).

- A
IES Retention Score (IRS) distributions for PGM/ND7‐KD and PGM/ISWI1‐KD. (B, C) Histograms of outer paired‐end distances of mapped DNase‐seq reads.
- D–I
Normalized nucleosome density histograms for IESs weakly (IRS < 0.2) or more strongly retained in ISWI1‐Kdb (IRS ≥ 0.2), either for ND7/PGM‐KD or NOWA1/PGM‐KD. Kolmogorov–Smirnov statistics and their P‐values are provided. Titles for graphs give criteria for IES selection.

- A–C
(A) “Naked” model proposed by Arnaiz et al, ; (B and C) Revised “clothed” model, which accounts for accessibility of IES boundaries in the presence of nucleosomes. If nucleosomes are not properly positioned, IESs can be cut at alternative boundaries, leading to IES accumulation of the “forbidden peak” length. Image created with
BioRender.com .
References
Publication types
MeSH terms
Substances
Associated data
- Actions
- Actions
- Actions
- Actions
- Actions
- Actions
- SRA/SRX215498
