. 2023 Sep 1;78(3):727-740.
doi: 10.1002/hep.32802. Epub 2022 Oct 11.

TP53 R249S mutation in hepatic organoids captures the predisposing cancer risk

Affiliations

TP53 R249S mutation in hepatic organoids captures the predisposing cancer risk

Yin Kau Lam et al. Hepatology. .

Abstract

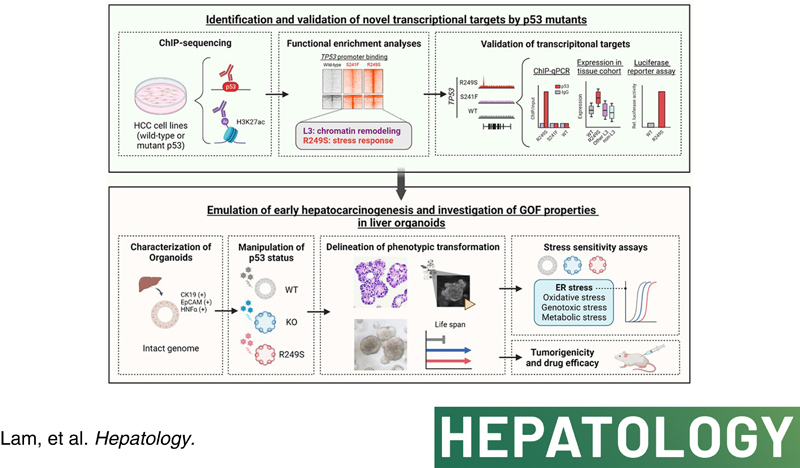
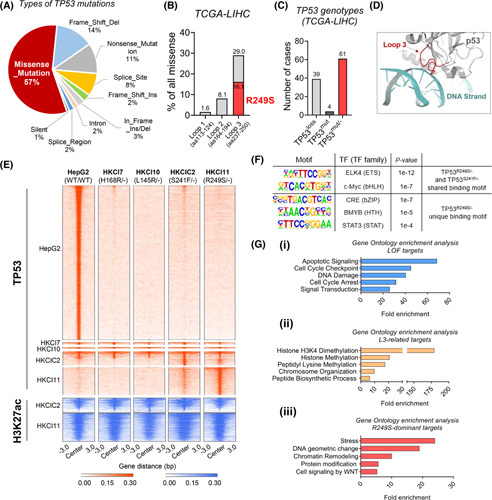
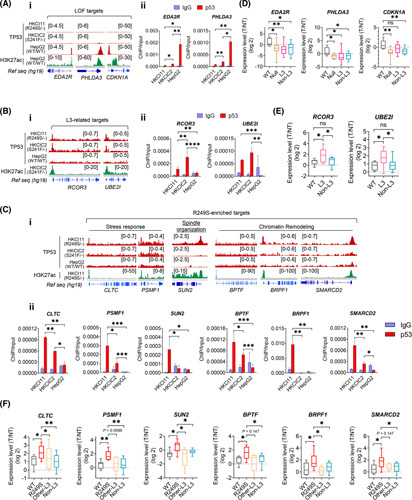
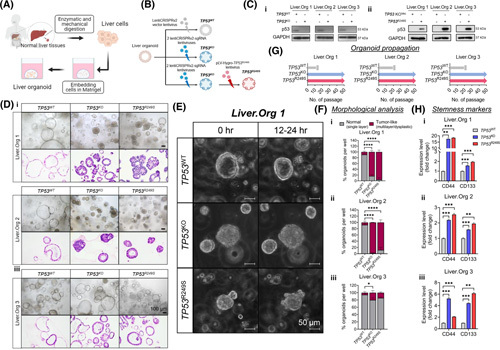
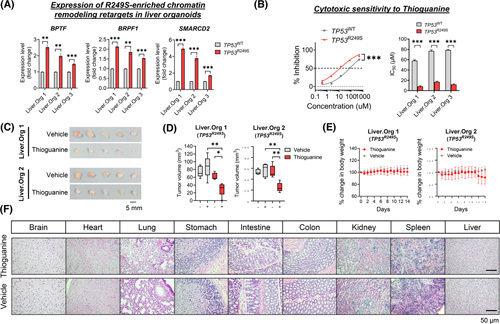
Background and aims: Major genomic drivers of hepatocellular carcinoma (HCC) are nowadays well recognized, although models to establish their roles in human HCC initiation remain scarce. Here, we used human liver organoids in experimental systems to mimic the early stages of human liver carcinogenesis from the genetic lesions of TP53 loss and L3 loop R249S mutation. In addition, chromatin immunoprecipitation sequencing (ChIP-seq) of HCC cell lines shed important functional insights into the initiation of HCC consequential to the loss of tumor-suppressive function from TP53 deficiency and gain-of-function activities from mutant p53.

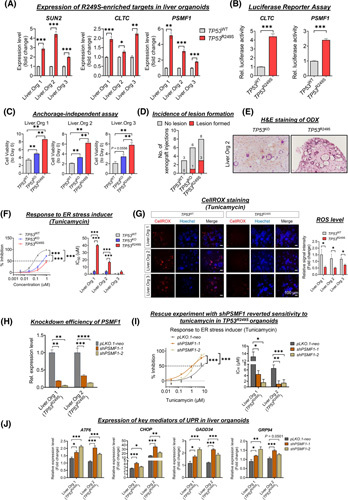
Approach and results: Human liver organoids were generated from surgical nontumor liver tissues. CRISPR knockout of TP53 in liver organoids consistently demonstrated tumor-like morphological changes, increased in stemness and unrestricted in vitro propagation. To recapitulate TP53 status in human HCC, we overexpressed mutant R249S in TP53 knockout organoids. A spontaneous increase in tumorigenic potentials and bona fide HCC histology in xenotransplantations were observed. ChIP-seq analysis of HCC cell lines underscored gain-of-function properties from L3 loop p53 mutants in chromatin remodeling and overcoming extrinsic stress. More importantly, direct transcriptional activation of PSMF1 by mutant R249S could increase organoid resistance to endoplasmic reticulum stress, which was readily abrogated by PSMF1 knockdown in rescue experiments. In a patient cohort of primary HCC tumors and genome-edited liver organoids, quantitative polymerase chain reaction corroborated ChIP-seq findings and verified preferential genes modulated by L3 mutants, especially those enriched by R249S.

Conclusions: We showed differential tumorigenic effects from TP53 loss and L3 mutations, which together confer normal hepatocytes with early clonal advantages and prosurvival functions.


Conflict of interest statement

This work was supported by the Hong Kong Research Grants Council Area of Excellence Scheme (Ref. AoE/M‐401/20), Research Impact Fund (Ref. R4017‐18) and internal funds from CUHK. This research is also supported in part by a National Cancer Institute fund of the National Institutes of Health (No. R01CA229836).

Nothing to report.

Figures

None
Graphical abstract
FIGURE 1
FIGURE 1
Chromatin immunoprecipitation sequencing (ChIP‐seq) of TP53 genotypes. (A) Proportion of different types of TP53 mutations in The Cancer Genome Atlas (TCGA) hepatocellular carcinoma (HCC) dataset. Missense mutations constitute 57% of all mutated cases. (B) Distribution of missense mutations within DNA binding domain Loops 1–3. (C) Incidence of TP53 copy loss, mutation, and concurrent loss and mutation in TCGA HCC dataset. (D) Structural interaction of p53 loop 3 and DNA strand as predicted by AlphaFold 2.0. (E) Heat map of genome‐wide occupancy patterns of TP53 binding and lysine H3K27 acetylation (H3K27ac) from ChIP‐seq of four TP53 mutants and wild type (WT). (F) List of DNA motifs enriched in TP53 R249S/‐ and TP53 S241F/‐. (G) Gene set enrichment analysis showed enrichment of signalings (top 5) in loss‐of‐function (LOF) targets (i), L3‐related targets (ii), and R249S‐dominant targets (iii). LIHC, Liver Hepatocellular Carcinoma, TF, transcription factor.
FIGURE 2
FIGURE 2
Verification of loss‐of‐function (LOF), Loop L3, and R249S‐enriched targets. (A) Chromatin immunoprecipitation sequencing (ChIP‐seq) signals for (i) LOF targets EDA2R, PHLDA3, and CDKN1A; (ii) chromatin immunoprecipitation–quantitative polymerase chain reaction (ChIP‐qPCR) validations of EDA2R and PHLDA3 in HKCI‐11 (R249S), HKCIC2 (S241F), and HepG2 (wild‐type; WT) (*p < 0.05, **p < 0.01). (B) ChIP‐seq signals for (i) L3‐related targets RCOR3 and UBE2I in HKCI‐11 (R249S), HKCIC2 (S241F), and HepG2 (WT); (ii) ChIP‐qPCR validations (**p < 0.01, ***p < 0.001, ****p < 0.0001). (C) ChIP‐seq signals for (i) R249S‐enriched targets CLTC, PSMF1, SUN2, BPTF, PSMF1, BRPF1, and SMARCD2 in HKCI‐11 (R249S), HKCIC2 (S241F), and HepG2 (WT); (ii) and ChIP‐qPCR validations (*p < 0.05, **p < 0.01, ***p < 0.001). (D) Expression of LOF targets in a cohort of patients with hepatocellular carcinoma (HCC) with various TP53 genotype statuses (*p < 0.05, **p < 0.01). Sample size: WT (n = 7), Null (n = 8), L3 (n = 14), Non‐L3 (n = 20). (E) Expression of L3‐related targets in a cohort of patients with HCC with various TP53 genotype statuses (*p < 0.05). Sample size: WT (n = 7), L3 (n = 14), Non‐L3 (n = 20). (F) Expression of R249S‐dominant targets in a cohort of patients with HCC with various TP53 genotype statuses (*p < 0.05, **p < 0.01). Sample size: WT (n = 7), R249S (n = 9), Other‐L3 (n = 5), Non‐L3 (n = 20). Data were plotted as mean ± SEM from three independent experiments in (Aii), (Bii), and (Cii). Box plots in (D)–(F) are presented as 10th to 90th percentiles. H3K27ac, H3K27 acetylation; IgG, immunoglobulin G; ns, not significant; Ref seq, reference sequence; T/NT, tumor/non‐tumor.
FIGURE 3
FIGURE 3
TP53 knockout (TP53 KO) and TP53 R249S liver organoids showed premalignant features. (A) Schematic workflow of primary culture for liver organoid generation. (B) Schematic diagram illustrating experimental approaches for developing TP53 wild‐type (TP53 WT), TP53 KO, and TP53 R249S organoids. (C) Protein levels of p53 in liver organoids were determined by western blot assay in (i) TP53 KO and (ii) TP53 R249S. (D) Representative brightfield and histological images of TP53 WT, TP53 KO, and TP53 R249S liver organoids from three individuals. The TP53 WT organoids grew as cystic structures, whereas TP53 KO and TP53 R249S organoids formed thickened walls or compact spheroids. Scale bar: 100 μm. (E) Representative time‐lapse images showed growth pattern of TP53 WT, TP53 KO, and TP53 R249S organoids within 12–24 h. Scale bar: 50 μm. (F) Morphological analysis indicated the proportion of single‐layered or tumor‐liked morphology in TP53 WT, TP53 KO, and TP53 R249S organoids (*p < 0.05, ****p < 0.0001). (G) Expansion potential of established liver organoids. The TP53 WT organoids stopped propagating within 20 passages, whereas both TP53 KO and TP53 R249S organoids continue to grow for more than 50 passages. (H) Expression of stemness markers, CD44 and CD133, in TP53 WT, TP53 KO, and TP53 R249S organoids (**p < 0.01, ***p < 0.001). Data were generated from three independent experiments and presented as mean ± SEM. Liver.Org 1, liver organoid 1; Liver.Org 2, liver organoid 2; Liver.Org 3, liver organoid 3; sgRNA, single guide RNA.
FIGURE 4
FIGURE 4
Tumor initiation in TP53 R249S organoids. (A) Expression of R249S‐enriched targets related to spindle organization and stress response in liver organoids. Increased levels of SUN2, CLTC, and PSMF1 in TP53 R249S organoids shown (*p < 0.05, **p < 0.01, ***p < 0.001). (B) Dual‐luciferase reporter assay showed promoter activities of CLTC and PSMF1 in R249S‐overexpressed Hep3B cells (***p < 0.001). (C) Induction of spheroid forming viability in TP53 wild type (TP53 WT), TP53 knockout (TP53 KO), and TP53 R249S organoids between Day 0 and 6. (D) TP53 WT, TP53 KO, and TP53 R249S organoids were subcutaneously transplanted into NSG mice. Incidence of lesions formed in each group shown. (E) Representative histological images of xenograft lesions. (F) Representative cell viability (left) and statistical analysis of the half maximal inhibitory concentration (IC50) value (right) of TP53 WT, TP53 KO, and TP53 R249S organoids after tunicamycin treatment (***p < 0.001). (G) Representative images of CellROX staining (left) and quantitative analysis of signal intensity (right) in TP53 WT and TP53 R249S organoids upon administration of tunicamycin. TP53 R249S organoids were more invulnerable to tunicamycin‐induced reactive oxygen species (ROS) levels (*p < 0.05). Scale bar: 100 μm. (H) Knockdown efficacy of PSMF1 in R249S‐expressing liver organoids (**p < 0.01, ***p < 0.001). (I) The effect of tunicamycin in PSMF1‐silenced TP53 R249S organoids. PSMF1 deficiency increased cell sensitivity to tunicamycin (left) with lower IC50 value (right) (*p < 0.05, **p < 0.01, ***p < 0.001). (J) Expression of key mediators of unfolded protein response (UPR) in liver organoids after administration of tunicamycin. Data shown as fold change between 0 and 8 h (*p < 0.05, **p < 0.01, ***p < 0.001). All data were generated from three independent experiments and presented as mean ± SEM. ER, endoplasmic reticulum; H&E, hematoxylin and eosin; Liver.Org 1, liver organoid 1; Liver.Org 2, liver organoid 2; Liver.Org 3, liver organoid 3; ODX, organoid‐derived xenograft.
FIGURE 5
FIGURE 5
A therapeutic window in targeting TP53 R249S. (A) Expression of R249S‐enriched targets associated with chromatin remodeling in liver organoids. Upregulation of BPTF, BRPF1, and SMARCD2 were determined in TP53 R249S organoids (**p < 0.01, ***p < 0.001). (B) The effect of thioguanine in TP53 wild‐type (TP53 WT) and TP53 R249S organoids. The R249S‐sufficient organoids illustrated increased sensitivity (left) with a lower IC50 value of thioguanine compared with TP53 WT control organoids (***p < 0.001). All data generated from three independent experiments and presented as mean ± SEM. (C) Photos of TP53 R249S xenografts retrieved from mice treated with thioguanine or vehicle. (D) Tumor volume of TP53 R249S xenografts before and after thioguanine or vehicle treatments (*p < 0.05, **p < 0.01). Sample size: thioguanine (n = 5), vehicle (n = 5). (E) Body weight recorded daily in both thioguanine and vehicle treatment groups. (F) Representative histological images of healthy organs expressing TP53 WT. Scale bar: 50 μm. Data presented as mean ± SD. Liver.Org 1, liver organoid 1; Liver.Org 2, liver organoid 2.

References

    1. Sung H, Ferlay J, Siegel RL, Laversanne M, Soerjomataram I, Jemal A, et al. Global Cancer Statistics 2020: GLOBOCAN estimates of incidence and mortality worldwide for 36 cancers in 185 countries. CA Cancer J Clin. 2021;71:209–49. - PubMed
    1. Schulze K, Imbeaud S, Letouze E, Alexandrov LB, Calderaro J, Rebouissou S, et al. Exome sequencing of hepatocellular carcinomas identifies new mutational signatures and potential therapeutic targets. Nat Genet. 2015;47:505–11. - PMC - PubMed
    1. Ghosh M, Saha S, Bettke J, Nagar R, Parrales A, Iwakuma T, et al. Mutant p53 suppresses innate immune signaling to promote tumorigenesis. Cancer Cell. 2021;39:494–508.e5. - PMC - PubMed
    1. Morrison CD, Chang JC, Keri RA, Schiemann WP. Mutant p53 dictates the oncogenic activity of c‐Abl in triple‐negative breast cancers. Cell Death Dis. 2017;8:9–e2899. - PMC - PubMed
    1. Dong P, Karaayvaz M, Jia N, Kaneuchi M, Hamada J, Watari H, et al. Mutant p53 gain‐of‐function induces epithelial–mesenchymal transition through modulation of the miR‐130b–ZEB1 axis. Oncogene. 2012;32:3286–95. - PMC - PubMed

Publication types

Substances