Highly Cytotoxic Molybdenocenes with Strong Metabolic Effects Inhibit Tumour Growth in Mice
- PMID: 36222279
- PMCID: PMC10099754
- DOI: 10.1002/chem.202202648
Highly Cytotoxic Molybdenocenes with Strong Metabolic Effects Inhibit Tumour Growth in Mice
Abstract
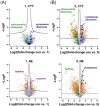
A series of six highly lipophilic Cp-substituted molybdenocenes bearing different bioactive chelating ligands was synthesized and characterized by NMR spectroscopy, mass spectrometry and X-ray crystallography. In vitro experiments showed a greatly increased cytotoxic potency when compared to the non-Cp-substituted counterparts. In vivo experiments performed with the dichlorido precursor, (Ph2 C-Cp)2 MoCl2 and the in vitro most active complex, containing the thioflavone ligand, showed an inhibition of tumour growth. Proteomic studies on the same two compounds demonstrated a significant regulation of tubulin-associated and mitochondrial inner membrane proteins for both compounds and a strong metabolic effect of the thioflavone containing complex.
Keywords: anticancer; biological tests (in vitro and in vivo); bioorganometallic chemistry; molybdenocenes; proteomics.
© 2022 The Authors. Chemistry - A European Journal published by Wiley-VCH GmbH.
Conflict of interest statement
The authors declare no conflict of interest.
Figures


Similar articles
-
Half-Sandwich Iridium(III) and Ruthenium(II) Complexes Containing P^P-Chelating Ligands: A New Class of Potent Anticancer Agents with Unusual Redox Features.Inorg Chem. 2018 Feb 19;57(4):1705-1716. doi: 10.1021/acs.inorgchem.7b01959. Epub 2018 Feb 5. Inorg Chem. 2018. PMID: 29400963
-
The First Anticancer Tris(pyrazolyl)borate Molybdenum(IV) Complexes: Tested in Vitro and in Vivo-A Comparison of O,O-, S,O-, and N,N-Chelate Effects.Chemistry. 2020 Feb 17;26(10):2211-2221. doi: 10.1002/chem.201903605. Epub 2019 Nov 19. Chemistry. 2020. PMID: 31560142 Free PMC article.
-
High in vitro and in vivo antitumor activities of Ln(III) complexes with mixed 5,7-dichloro-2-methyl-8-quinolinol and 4,4'-dimethyl-2,2'-bipyridyl chelating ligands.Eur J Med Chem. 2019 May 1;169:103-110. doi: 10.1016/j.ejmech.2019.02.066. Epub 2019 Mar 5. Eur J Med Chem. 2019. PMID: 30870791
-
A half-sandwich TaV dichlorido complex containing an O,N,O'-tridentate Schiff base ligand: synthesis, crystal structure and in vitro cytotoxicity.Acta Crystallogr C Struct Chem. 2019 Mar 1;75(Pt 3):248-254. doi: 10.1107/S2053229619001323. Epub 2019 Feb 8. Acta Crystallogr C Struct Chem. 2019. PMID: 30833518
-
New ligands of the tubulin colchicine site based on X-ray structures.Curr Top Med Chem. 2014;14(20):2231-52. doi: 10.2174/1568026614666141130092637. Curr Top Med Chem. 2014. PMID: 25434358 Review.
Cited by
-
Anticancer Tungstenocenes with a Diverse Set of (O,O-), (O,S-) and (O,N-) Chelates-A Detailed Biological Study Using an Improved Evaluation via 3D Spheroid Models.Pharmaceutics. 2023 Jul 3;15(7):1875. doi: 10.3390/pharmaceutics15071875. Pharmaceutics. 2023. PMID: 37514061 Free PMC article.
References
-
- Köpf H., Köpf-Maier P., Angew. Chem. Int. Ed. Engl. 1979, 18, 477–478. - PubMed
-
- Köpf-Maier P., Leitner M., Voigtländer R., Köpf H., Z. Naturforsch. C 1979, 34, 1174–1176. - PubMed
-
- Köpf-Maier P., Köpf H., Z., Naturforsch. B 1979, 34, 805–807. - PubMed
-
- Köpf-Maier P., Leitner M., Köpf H., J. Inorg. Nucl. Chem. 1980, 42, 1789–1791.
-
- Korfel A., Scheulen M. E., Schmoll H. J., Gründel O., Harstrick A., Knoche M., Fels L. M., Skorzec M., Bach F., Baumgart J., Sass G., Seeber S., Thiel E., Berdel W. E., Clin. Cancer Res. 1998, 4, 2701–2708. - PubMed
MeSH terms
Substances
Grants and funding
LinkOut - more resources
Full Text Sources
Medical
Miscellaneous

