. 2022 Oct 12:11:e80140.
doi: 10.7554/eLife.80140.

Ligand-induced shifts in conformational ensembles that describe transcriptional activation

Affiliations

Ligand-induced shifts in conformational ensembles that describe transcriptional activation

Sabab Hasan Khan et al. Elife. .

Abstract

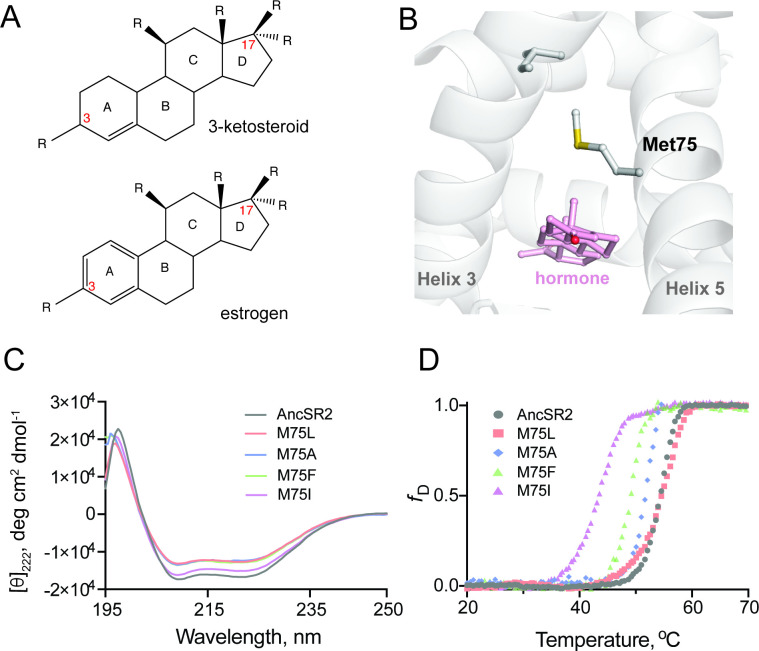
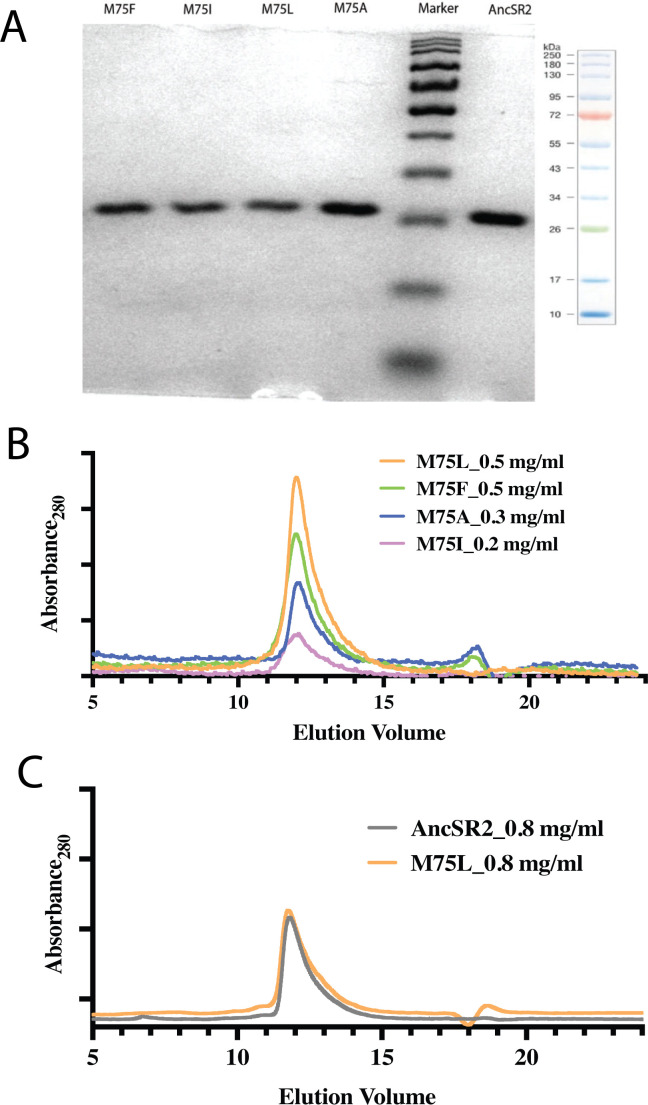
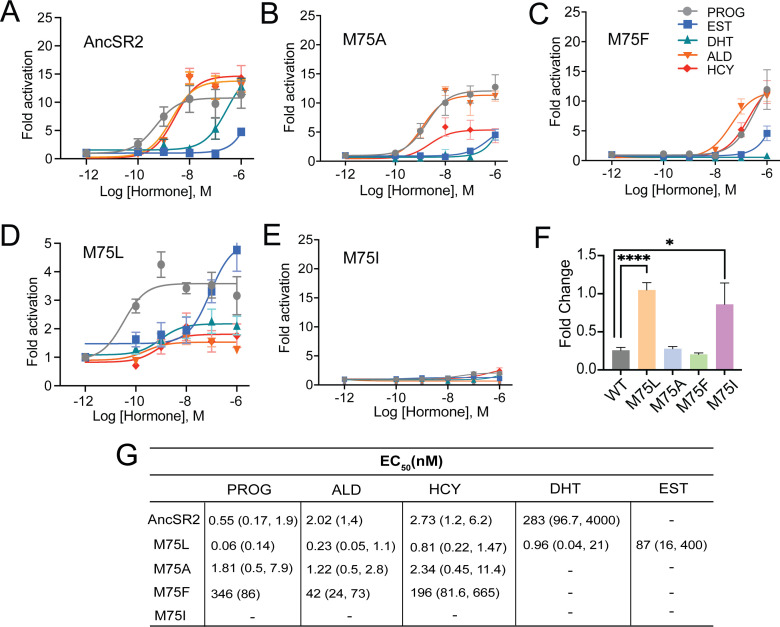
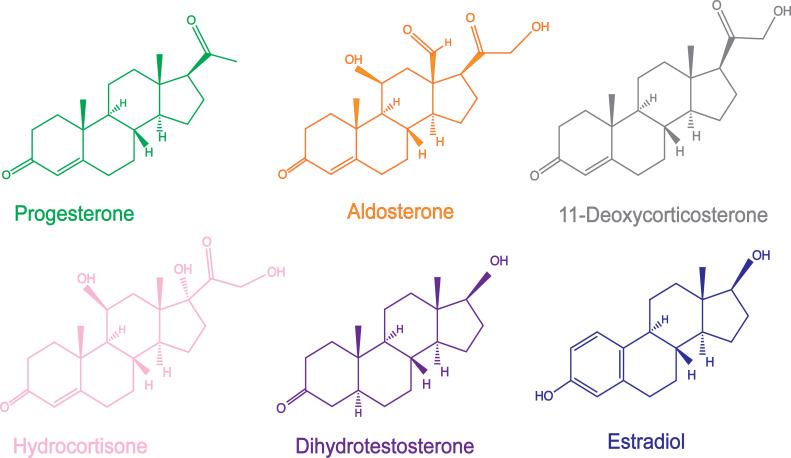
Nuclear receptors function as ligand-regulated transcription factors whose ability to regulate diverse physiological processes is closely linked with conformational changes induced upon ligand binding. Understanding how conformational populations of nuclear receptors are shifted by various ligands could illuminate strategies for the design of synthetic modulators to regulate specific transcriptional programs. Here, we investigate ligand-induced conformational changes using a reconstructed, ancestral nuclear receptor. By making substitutions at a key position, we engineer receptor variants with altered ligand specificities. We combine cellular and biophysical experiments to characterize transcriptional activity, as well as elucidate mechanisms underlying altered transcription in receptor variants. We then use atomistic molecular dynamics (MD) simulations with enhanced sampling to generate ensembles of wildtype and engineered receptors in combination with multiple ligands, followed by conformational analysis and correlation of MD-based predictions with functional ligand profiles. We determine that conformational ensembles accurately describe ligand responses based on observed population shifts. These studies provide a platform which will allow structural characterization of physiologically-relevant conformational ensembles, as well as provide the ability to design and predict transcriptional responses in novel ligands.

Keywords: biochemistry; chemical biology; conformational ensembles; molecular biophysics; molecular dynamics; none; nuclear receptors; protein dynamics; structural biology; transcriptional activation.


Conflict of interest statement

SK, SB, SK, EE, GA, CO No competing interests declared

Figures

Figure 1.
Figure 1.. Structure and stability of AncSR2 and M75 mutants.
(A) Chemical structure of A-ring aromatized estrogen and non-aromatized 3-ketosteroid. (B) Met75 (H5) is positioned to form critical contacts with H3 and the hormone located in the ligand binding pocket. (C) Far-UV CD spectra of AncSR2 and its variants in the wavelength range 195–250 nm, showed mutants LBD remains in the folded state similarly as AncSR2. (D) Normalized heat-induced denaturation transition curves of AncSR2 and its variants monitored by change in the [θ]222 as function of temperature. Each curve represents averaged measurements from two replicates and two independent purifications.
Figure 1—figure supplement 1.
Figure 1—figure supplement 1.. Purity and homogeneity of mutants were assessed by SDS-PAGE and Gel filtration chromatography.
(A) Purity of the LBDs were assessed on 14% SDS-PAGE. (B) Gel filtration profile of AncSR2 and variants over ENrich SEC 70 (Bio-Rad, USA) gel filtration column at 4 °C. A 100 μl sample of mutants at concentrations of 0.2 mg-0.5 mg/ml was loaded on pre-equilibrated SEC70 gel filtration column and their elution profile was monitored at a wavelength 280 nm. (C) A higher concentration (0.8 mg/ml) of AncSR2 and M75L mutant proteins was loaded on the column to check the concentration effect on the elution profile. Mutant LBDs eluted as a single peak at identical positions as AncSR2 LBD, suggesting that LBD mutants maintain the AncSR2 globular conformation.
Figure 2.
Figure 2.. Differential ligand activation of AncSR2 variants.
Dose-response curves of AncSR2 and its variants in the presence of aromatized and non-aromatized hormones. Five hormones are used: progesterone (PROG), aldosterone (ALD), hydrocortisone (HCY), Dihydrotestosterone (DHT) and Estradiol (EST). (A) AncSR2 receptor showed differential response to non-aromatized hormones with no response to estradiol with ligand treatment up to 1 µM. (B) M75A substitution slightly increased the fold activation as compared to AncSR2 with no change in the receptor efficacy for progesterone, aldosterone, hydrocortisone. (C) M75F substitution decreased the receptor responsiveness for hormones. (D) M75L receptor efficacy is significantly reduced compared to WT AncSR2. In contrast to WT AncSR2, M75L was activated by estradiol. (E) M75I substitution completely abolished the ligand activation for both types of hormones. Each data point is an average of two to three biological replicates. The error bar associated with each data point represent SEM. (F) M75L and M75I receptors fold change over empty vector in the absence of hormone suggest that they exhibit constitutive activity. Two-tailed unpaired t-test, (****) p<0.0001, (*) p<0.05. (G). Table shows EC50 values obtained from the analysis of dose-response curves of individual receptors for different hormones. 95% confidence interval values are shown in parentheses.
Figure 2—figure supplement 1.
Figure 2—figure supplement 1.. Chemical structures of different hormones used in the FP-based competition binding experiments.
Figure 2—figure supplement 2.
Figure 2—figure supplement 2.. Constitutive activity and expression levels of AncSR2 variants.
(A) The constitutive activity of M75L receptor was independent of the cell lines used. Fold change of AncSR2 and variants over empty vector in the absence of ligand (cell line: CHO). The error bars associated with each column represent SEM from three independent replicates. Two-tailed unpaired t-test, (***) p<0.0002, (*) p<0.05. (B) Western blot experiment showing that the expression of mutant proteins are comparable to WT AncSR2.
Figure 3.
Figure 3.. Fluorescence polarization assay of binding affinity of AncSR2 and M75 mutants.
(A) Structure of synthesized probe: FAM labelled 11-DOC (11-DOC-FAM). (B) 11-DOC-FAM binds to AncSR2-LBD and M75L, M75A, M75F with equilibrium dissociation constant, Kd = 180 nM (107, 293) and Kd = 542 nM (330,869), Kd = 314 nM (127, 692), Kd = 485 nM (227, 986), respectively. 95% confidence intervals are shown in parentheses. Binding data is the average of six (for WT AncSR2 and M75L) and three (M75A, M75F and M75I) replicates from two and one independent experiment, respectively where each experiment consists of three independent replicates. (C and D) FP-based competition binding experiments shows that all steroid hormones bind WT AncSR2 and M75L with nM inhibition constants (Ki), respectively. Error bars indicate SD from three independent replicates. (E) Ki values obtained for five hormones from FP-based competition ligand binding assay. 95% confidence intervals from independent triplicate measurements are shown in parentheses.
Figure 4.
Figure 4.. Conformational effects of AncSR2 M75L mutation probed by HDX-MS.
(A) Sequence coverage maps for WT AncSR2 (blue) and M75L (pink) in their apo, estradiol (EST), and progesterone (PROG) bound form. (B) The percentage difference in relative fractional uptake (ΔRFU) of deuterium at a time point (15 min) between M75L and WT AncSR2 apo states (M75LApo – WTApo). (C) ΔRFU between M75L-progesterone bound and M75L Apo state (M75LPROG-M75LApo). (D) ΔRFU between WT-progesterone bound and WT Apo state (WTPROG-WTApo). Color bar indicates the fractional difference in relative deuterium uptake for the two states compared. Positive percentage numbers (red) correspond to higher deuterium exchange in state A compared to state B, that is, deprotection, while negative numbers (blue) indicate lower exchange, that is, protection against deuteration exchange. Dark grey regions represent peptides with no sequence coverage.
Figure 4—figure supplement 1.
Figure 4—figure supplement 1.. Deuterium exchange difference plot (Woods plot) between M75L and WT AncSR2 apo states (M75LApo – WTApo) at multiple time points.
A positive difference indicates increased exchange in the apo M75L while a negative difference represents decrease in the deuterium exchange.
Figure 4—figure supplement 2.
Figure 4—figure supplement 2.. Deuterium exchange difference plots (Time = 15 min) between M75L and AncSR2 apo and ligand-bound states.
AncSR2 in the PRO and EST-bound states showed significantly increased deuterium exchange. In M75L-PRO-bound states, no uptake difference was observed in most protein regions while significant decreased exchange was seen (close to significant threshold value –0.5 Da) in the peptide region (56-63).
Figure 4—figure supplement 3.
Figure 4—figure supplement 3.. The relative fractional uptake of AncSR2 and M75L under different states.
(A) Relative fractional uptake of M75L and WT AncSR2 in the apo state. Relative fractional uptake of WT AncSR2 apo state with WT-EST (B) and WT-PRO (C) bound state.
Figure 4—figure supplement 4.
Figure 4—figure supplement 4.. Relative fractional uptake of M75L apo state with M75L-EST (A) and M75L-PRO (B) bound state.
Figure 5.
Figure 5.. Contact measurements and conformational analysis of classical MD simulations.
(A) AncSR2 structure indicating positions of M75 along with bound hormone and additional H5 and H3 residues used to determine contact measurements. To assess H3-H5 interhelical distances, measurements were performed between Leu42-Trp71 and Gln41-res75. (B) Average distances between residue 75 (H5) and A-ring of hormones. (C) Average distances between L42 Cα and Trp71 Cα atoms. M75A showed the smallest distances, M75F the largest, with all other complexes in between, indicating that the size of the sidechain determines the interhelical distance. (D) Average distances between Q41 Cα and res75 Cα atoms. This contact follows the same trends observed in (C). Individual data points in B, C, D represent distance measurements averaged over simulations. Each box and whisker representation displays the distribution of calculated distances for the five hormone-bound complexes and apo receptor. The lower bounds for each box in (C and D) correspond to the apo receptors. (E) Two potential explanations for enhanced activity in M75A are the proximity of Q41 (top) and Trp71 (bottom) to hormones, due to the reduced H3-H5 distances. (F) In estradiol-bound M75F, a pi-stacking triad is formed between Trp71, Phe75 and the hormone A-ring. This observation suggests an explanation for why the mutant is selectively activated by 3-ketosteroids but not by estrogens. (G) Simulations predict that the Ile sidechain of M75I is likely to insert into the binding pocket and interfere with ligand binding. This effect is not observed any of the other complexes.
Figure 5—figure supplement 1.
Figure 5—figure supplement 1.. Root mean square deviation (RMSD) calculated for all complexes from classical MD simulations.
Figure 5—figure supplement 2.
Figure 5—figure supplement 2.. Distribution of calculated distances between Q41-ligand (left) and W71-ligand.
All heavy atoms of either residues or ligands were used to determine the shortest distance between both (See Materials and methods – Analysis). The shortest distances over the length of the trajectory (75,000 points) were binned to generate the plots above.
Figure 5—figure supplement 3.
Figure 5—figure supplement 3.. M75A mutant receptor activation response abolished upon substitution of Q41A in the M75A background mutant (M75A-Q41A).
Four different ligands used in the assay: progesterone (PRO), estradiol (EST), aldosterone (ALDO) and hydrocortisone (HCY). Each data point is average of six independent replicates from two biological experiment. The error bar associated with each data point represent SEM.
Figure 5—figure supplement 4.
Figure 5—figure supplement 4.. Distances and angles between F75 and W71 are monitored for MD simulations of M75F complexes.
Red boxes indicate when pi stacking occurred between both rings. Numbers indicate the percentage of time spent by both rings in pi-stacking for all complexes.
Figure 6.
Figure 6.. Clustering of accelerated MD simulations and correlation analysis.
(A) Conformations obtained from accelerated MD simulations of unliganded AncSR2 were co-clustered with frames obtained from M75 mutants. M75A reveals substantial conformational overlap with AncSR2, M75F reveals no AncSR2 overlap while both M75L and M75I stabilize a minor conformational substate of AncSR2. Each stacked cluster represented the population obtained from WT AncSR2 frames (gray) stacked on the fraction obtained from mutant complexes (blue/green/pink/purple). (B–E) For each AncSR2 variant (except M75I), frames from ligand-bound simulations were co-clustered with conformations from the unliganded simulation of the same receptor. In M75A (B), M75L(D) and WT AncSR2 (E) all hormones introduce new conformational states to varying extents. In M75F, all liganded complexes show overlap with the apo receptor. Each stacked cluster represented the population obtained from apo frames (gray) stacked with the fraction of the cluster containing ligand-bound frames (blue/green/pink/black). (F–H) Overlap fraction shows correlation with EC50 (F), and fractional fold activation, measured as fold change at 100 nM (G) and 10 nM (H) ligand divided by Emax/efficacy.
Figure 7.
Figure 7.. Structural analysis of MD simulations of AncSR2 variants to explain altered transcriptional response.
(A) Ensemblator analysis of local/backbone changes of M75 variants compared to WT AncSR2. Conformational changes are quantified and colored by the discrimination index (DI). Lower DI values indicate regions where structures are nearly identical between WT and mutant receptors while higher DI indicates changes in local backbone angles induced by mutations. Spheres on H5 identify position 75. (B) Ensemblator analysis of global changes in M75 mutants compared to WT. Structures are globally overlaid prior to analysis. Structures are colored by DI, where lower values correspond to highly similar regions in superimposed structures while higher values indicate regions of structural dissimilarity. Spheres on H5 identify position 75. (C) Overlay of 200 structures used for Ensemblator analysis showing conformational changes observed in H8-H9 and H9-H10 loops. Structures from WT AncSR2 are colored blue while mutant structures are shown in cyan, illustrating that structural variations are the result of mutation.
Figure 7—figure supplement 1.
Figure 7—figure supplement 1.. Root mean square fluctuations (RMSF) for each cluster, by receptor-ligand complex.
Each graph contains the number of curves corresponding to the number of clusters from that analysis. Each curve is the calculated RMSF of all PDB frames in that cluster.
Figure 7—figure supplement 2.
Figure 7—figure supplement 2.. Discrimination Scores reporting on the global and local conformational differences between ensembles of WT AncSR2 and mutants.
Scheme 1.
Scheme 1.. Synthesis of 11-DOC-FAM from 11-deoxycorticosterone.

Similar articles

Cited by

References

    1. Allison JR. Computational methods for exploring protein conformations. Biochemical Society Transactions. 2020;48:1707–1724. doi: 10.1042/BST20200193. - DOI - PMC - PubMed
    1. Araki M, Matsumoto S, Bekker G-J, Isaka Y, Sagae Y, Kamiya N, Okuno Y. Exploring ligand binding pathways on proteins using hypersound-accelerated molecular dynamics. Nature Communications. 2021;12:2793. doi: 10.1038/s41467-021-23157-1. - DOI - PMC - PubMed
    1. Bagchi MK, Elliston JF, Tsai SY, Edwards DP, Tsai MJ, O’Malley BW. Steroid hormone-dependent interaction of human progesterone receptor with its target enhancer element. Molecular Endocrinology. 1988;2:1221–1229. doi: 10.1210/mend-2-12-1221. - DOI - PubMed
    1. Becker PB, Gloss B, Schmid W, Strähle U, Schütz G. In vivo protein-DNA interactions in a glucocorticoid response element require the presence of the hormone. Nature. 1986;324:686–688. doi: 10.1038/324686a0. - DOI - PubMed
    1. Beekman JM, Allan GF, Tsai SY, Tsai MJ, O’Malley BW. Transcriptional activation by the estrogen receptor requires a conformational change in the ligand binding domain. Molecular Endocrinology. 1993;7:1266–1274. doi: 10.1210/mend.7.10.8264659. - DOI - PubMed

Publication types